We haven’t looked at the oil market for several months for the simple reason that it has been dull and boring – our time has been better spent elsewhere, specifically on the Precious Metals sector where we have garnered big gains. It’s worth looking at again now after this lapse of time in order to keep abreast of what is going on, especially as it looks like a larger move may be in the offing.
Essentially, there are two main powerful and conflicting forces in play that will determine the oil price going forward. One is the growing impoverishment of the global population due to accelerating inflation caused by the reckless behaviour of Central Banks and governments that will reduce aggregate demand, which is why we have seen the price gradually sinking in recent months. The other is the unpredictable effect of probable wars involving Iran and Venezuela that could have a big impact on the oil price if supply is seriously disrupted - we see the battle between these opposing forces playing out on our charts, and it is not clear at this stage which will prevail. While time will tell of course, as ever, if we understand in advance the setup on the charts we will be better positioned to take advantage of whatever major trend emerges. So let’s get started.
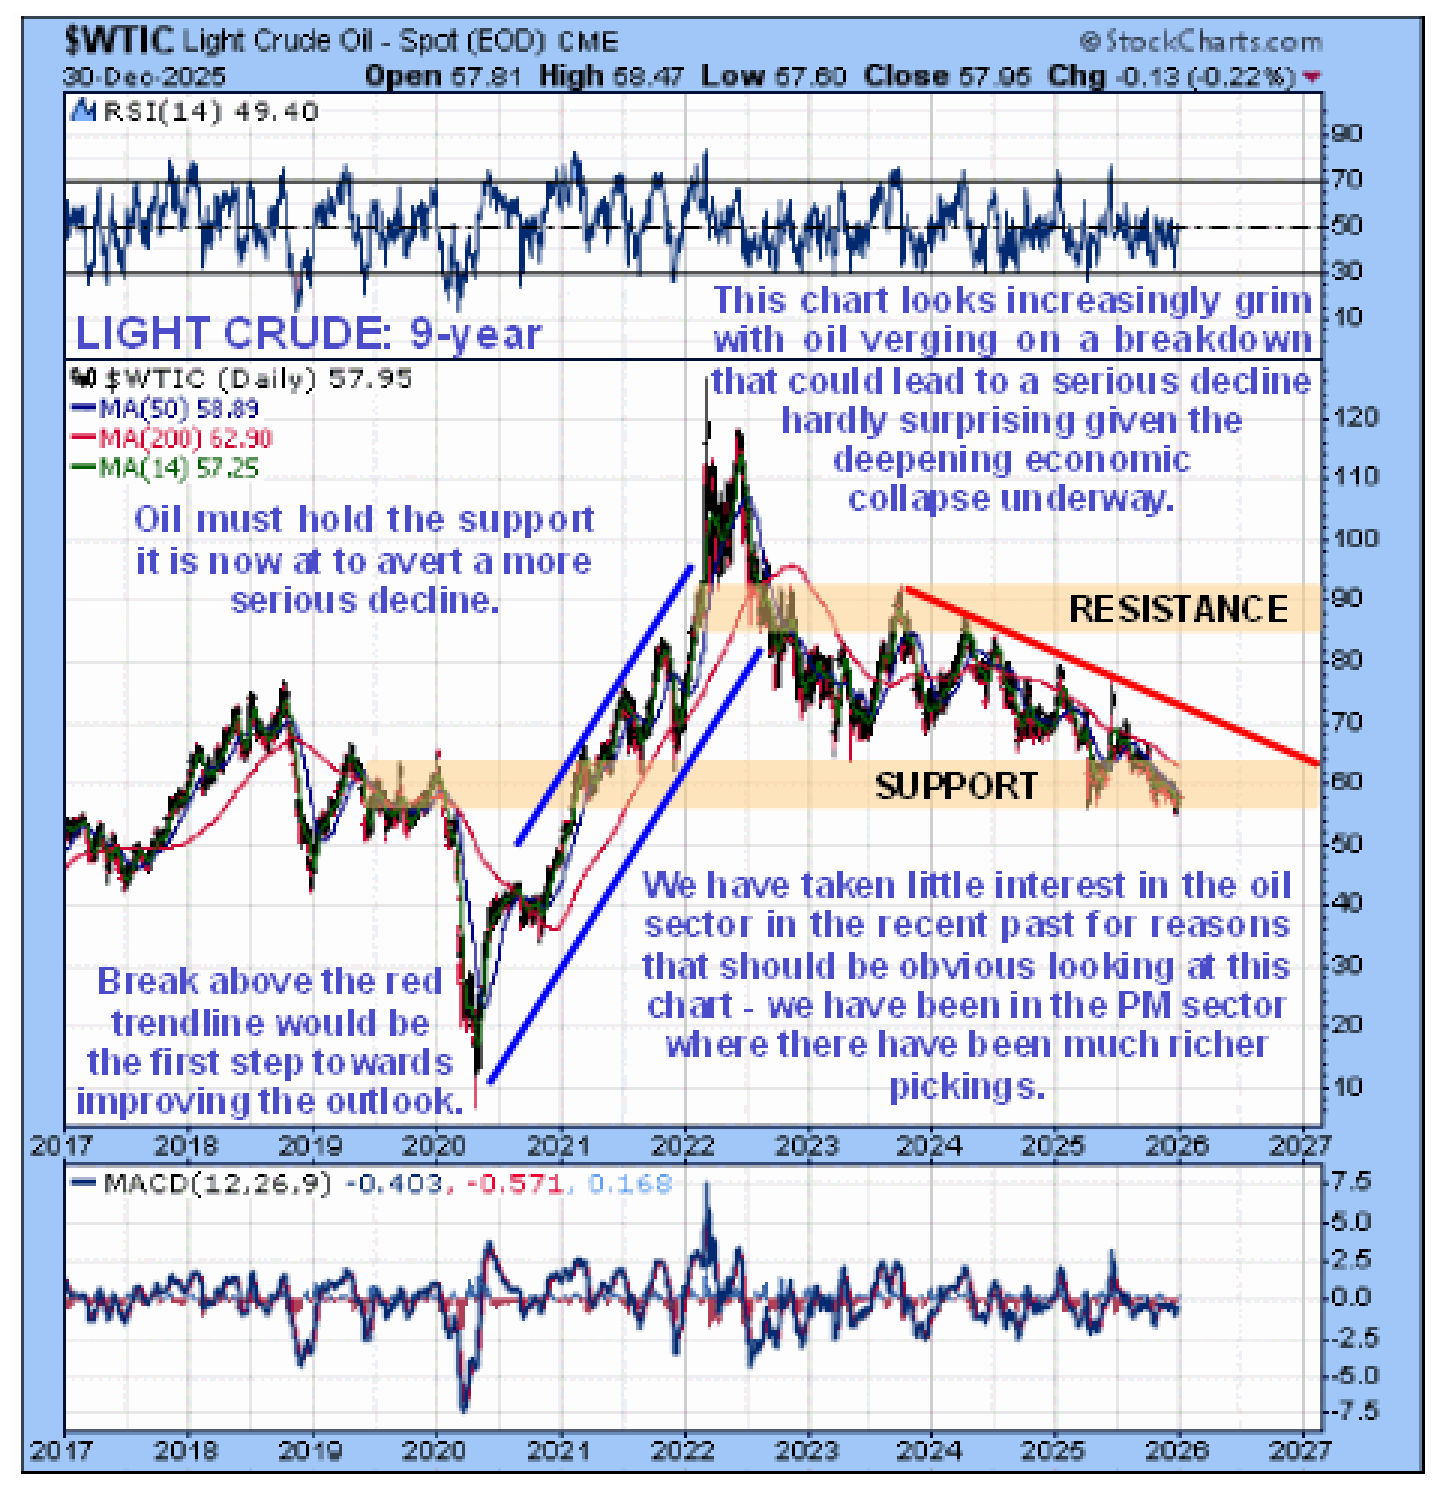
On the 9-year chart for Light Crude we can see that, like a slowly deflating tire, it has been gradually sinking since late 2023 in the face of dwindling demand as people get poorer, with the US middle class in particular suffering the ravages of inflation (the CPI is BS if you know what I mean), so that, instead of families going on carefree motoring vacations, their trips tend to be a lot shorter with many homeless people simply relocating the camper van that they live in from one street to another. Despite the war drums playing in the background the price has been pushed steadily lower by the red trendline shown to the point that it is close to breaching the key support level shown which would be expected to lead to a more rapid decline.
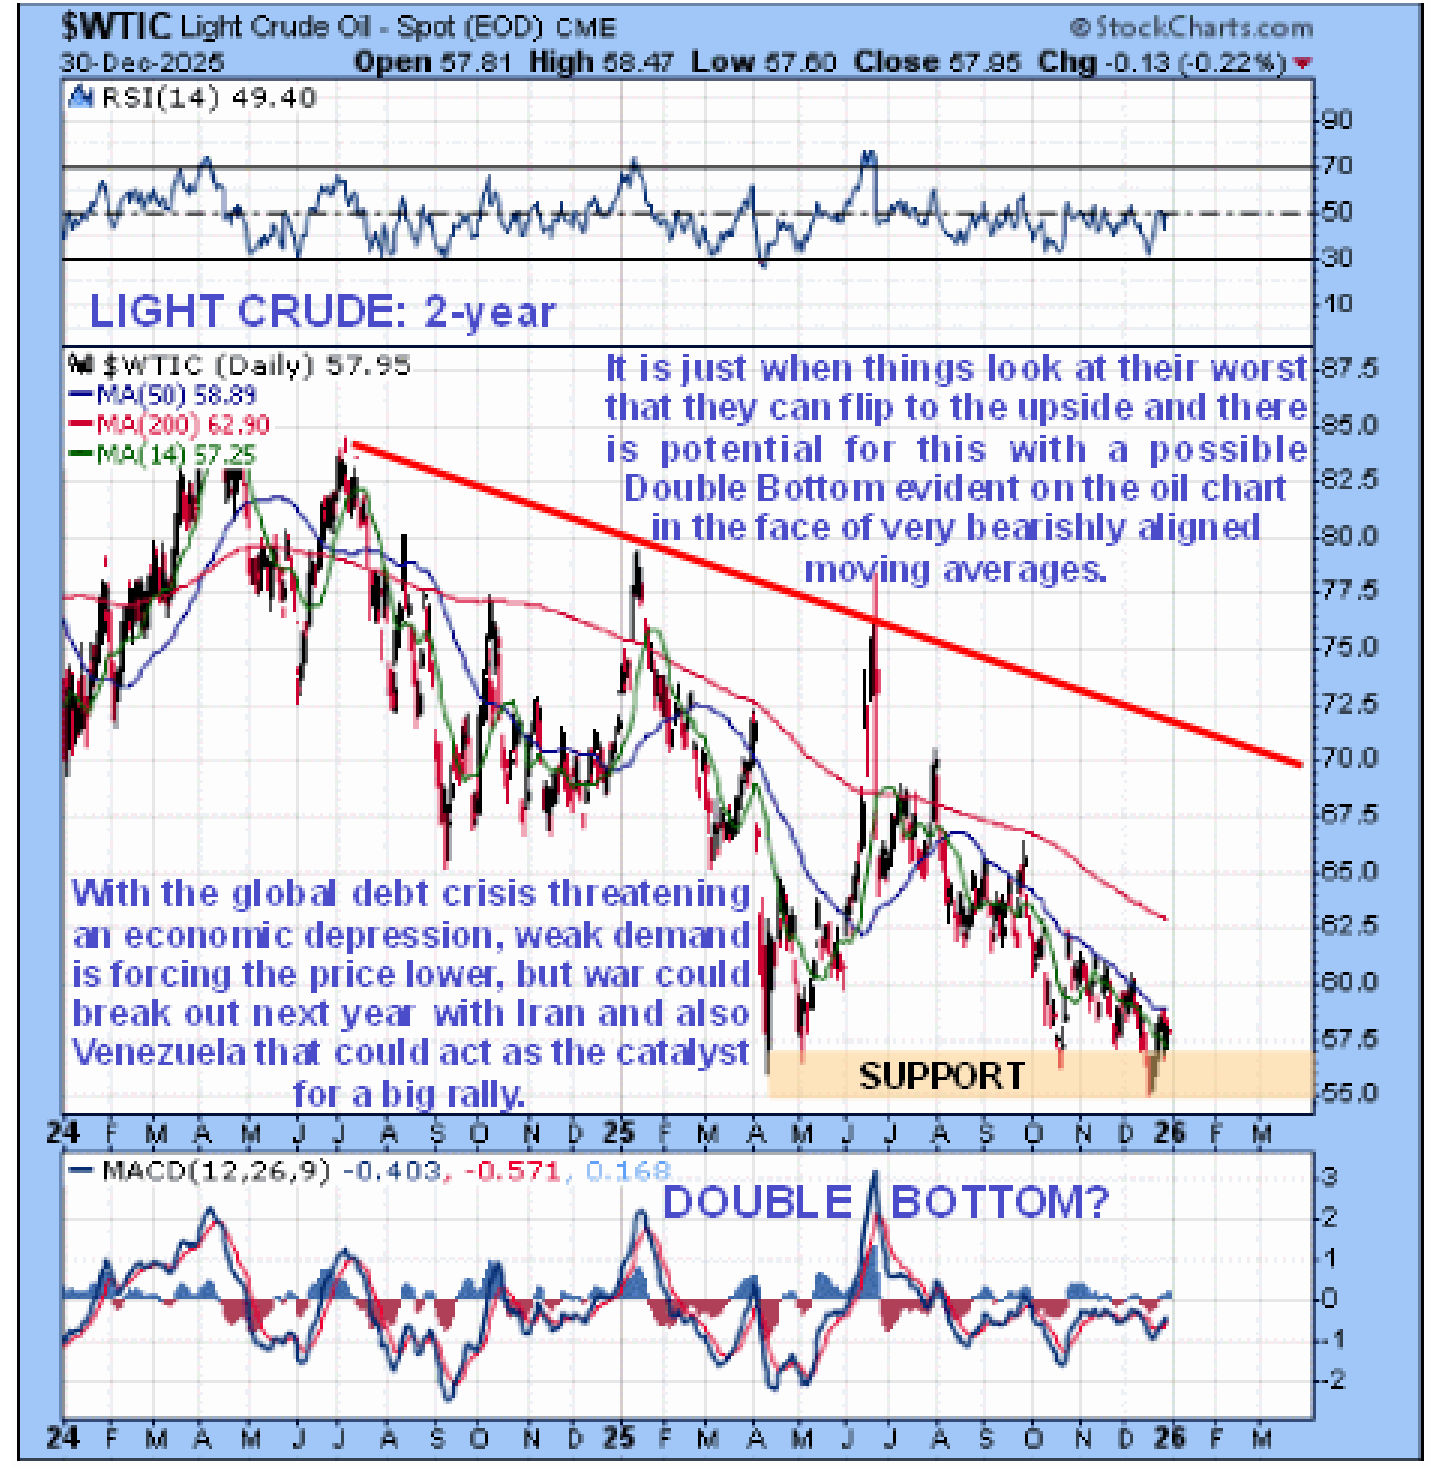
In contrast, the shorter-term 2-year chart shows us a potentially positive factor in play that could lead to a reversal to the upside from here. Despite the price trending lower since June and its moving averages being in decidedly bearish alignment, we can see that it may right now be forming the 2nd low of a Double Bottom at the support centered on the lows of last April – May, in which case it could take off higher from here. Which way it breaks probably depends on whether serious hostilities break out either between Israel and Iran or between the US and Venezuela, or between both pairs of countries at the same time. It is common knowledge that, one way or another, Israel plans to take down Iran with the assistance of the US military in order to gain dominance of the entire Mid-East and greatly enlarge its territory and also that the US wants to grab Venezuala’s massive oil reserves and simultaneously make it clear to the entirety of Central and South America who is the Big Boss of the region. When Netanyahu and Trump got together in Mar del Lago a few days back it was clear that they are as “thick as thieves” – they were even wearing the same colored jackets and ties, so it may be that they decide to “do Iran and Venezuela” at the same time, in which case it will be interesting to see how Israel and the US get on with Iran’s formidable missile arsenal. The consequences of such military action for the oil price could be dramatic, which is why it is important to point out that a Double Bottom may be completing in the oil price at the key support. It will take a break above the red trendline drawn on this chart to start turning the picture more positive although just getting to this trendline will involve a significant gain in price from here.
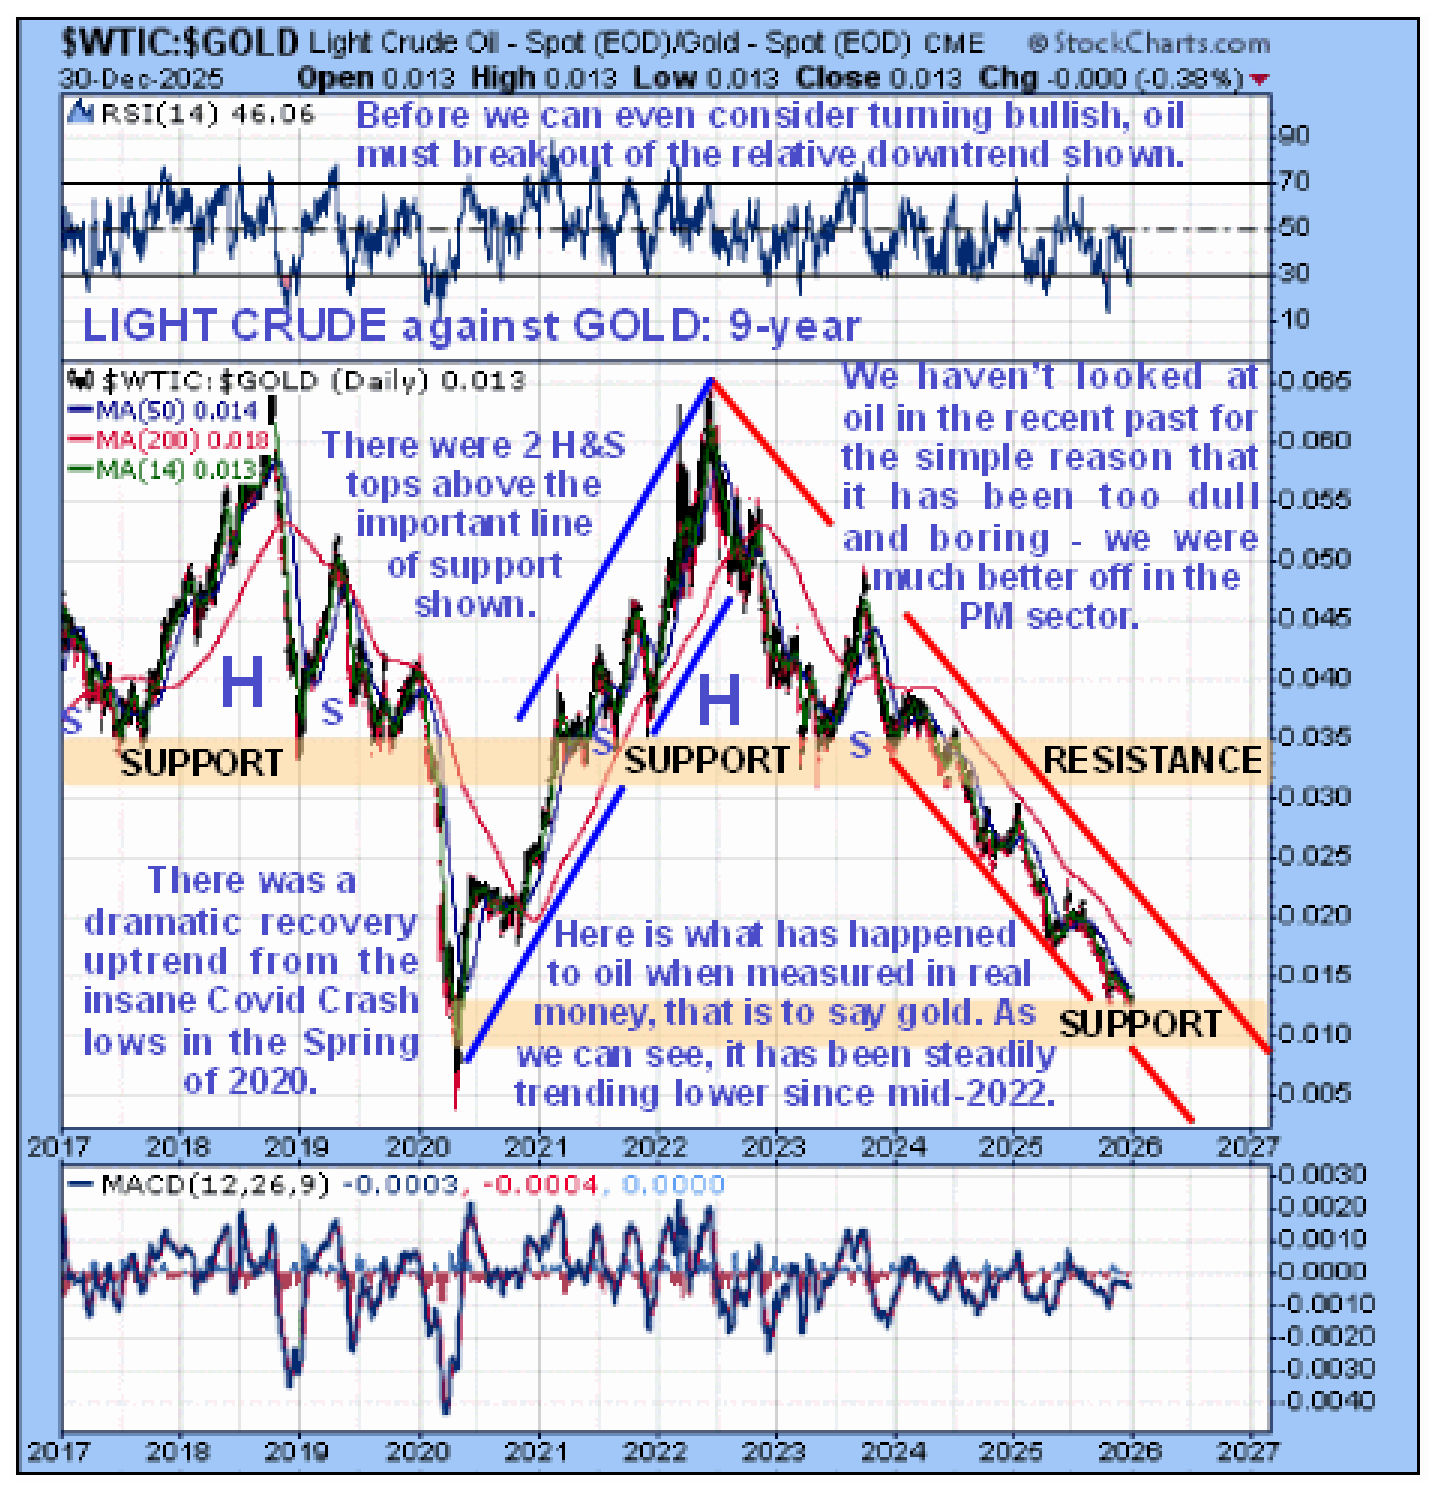
Now we’ll look at a very interesting chart showing how oil has performed relative to gold in recent years. The first point to observe is that oil had a spectacular runup relative to gold from its crazy low at the depths of the Covid Crash orchestrated collective psychosis in the Spring of 2020 that ran until the middle of 2022. Then it went into reverse and it has performed terribly relative to gold ever since with a brutal downtrend bringing it down to relative support approaching the Covid Crash lows – a good point for it to start higher again. However, we cannot even consider turning bullish on oil until it breaks clear out of this relative downtrend.
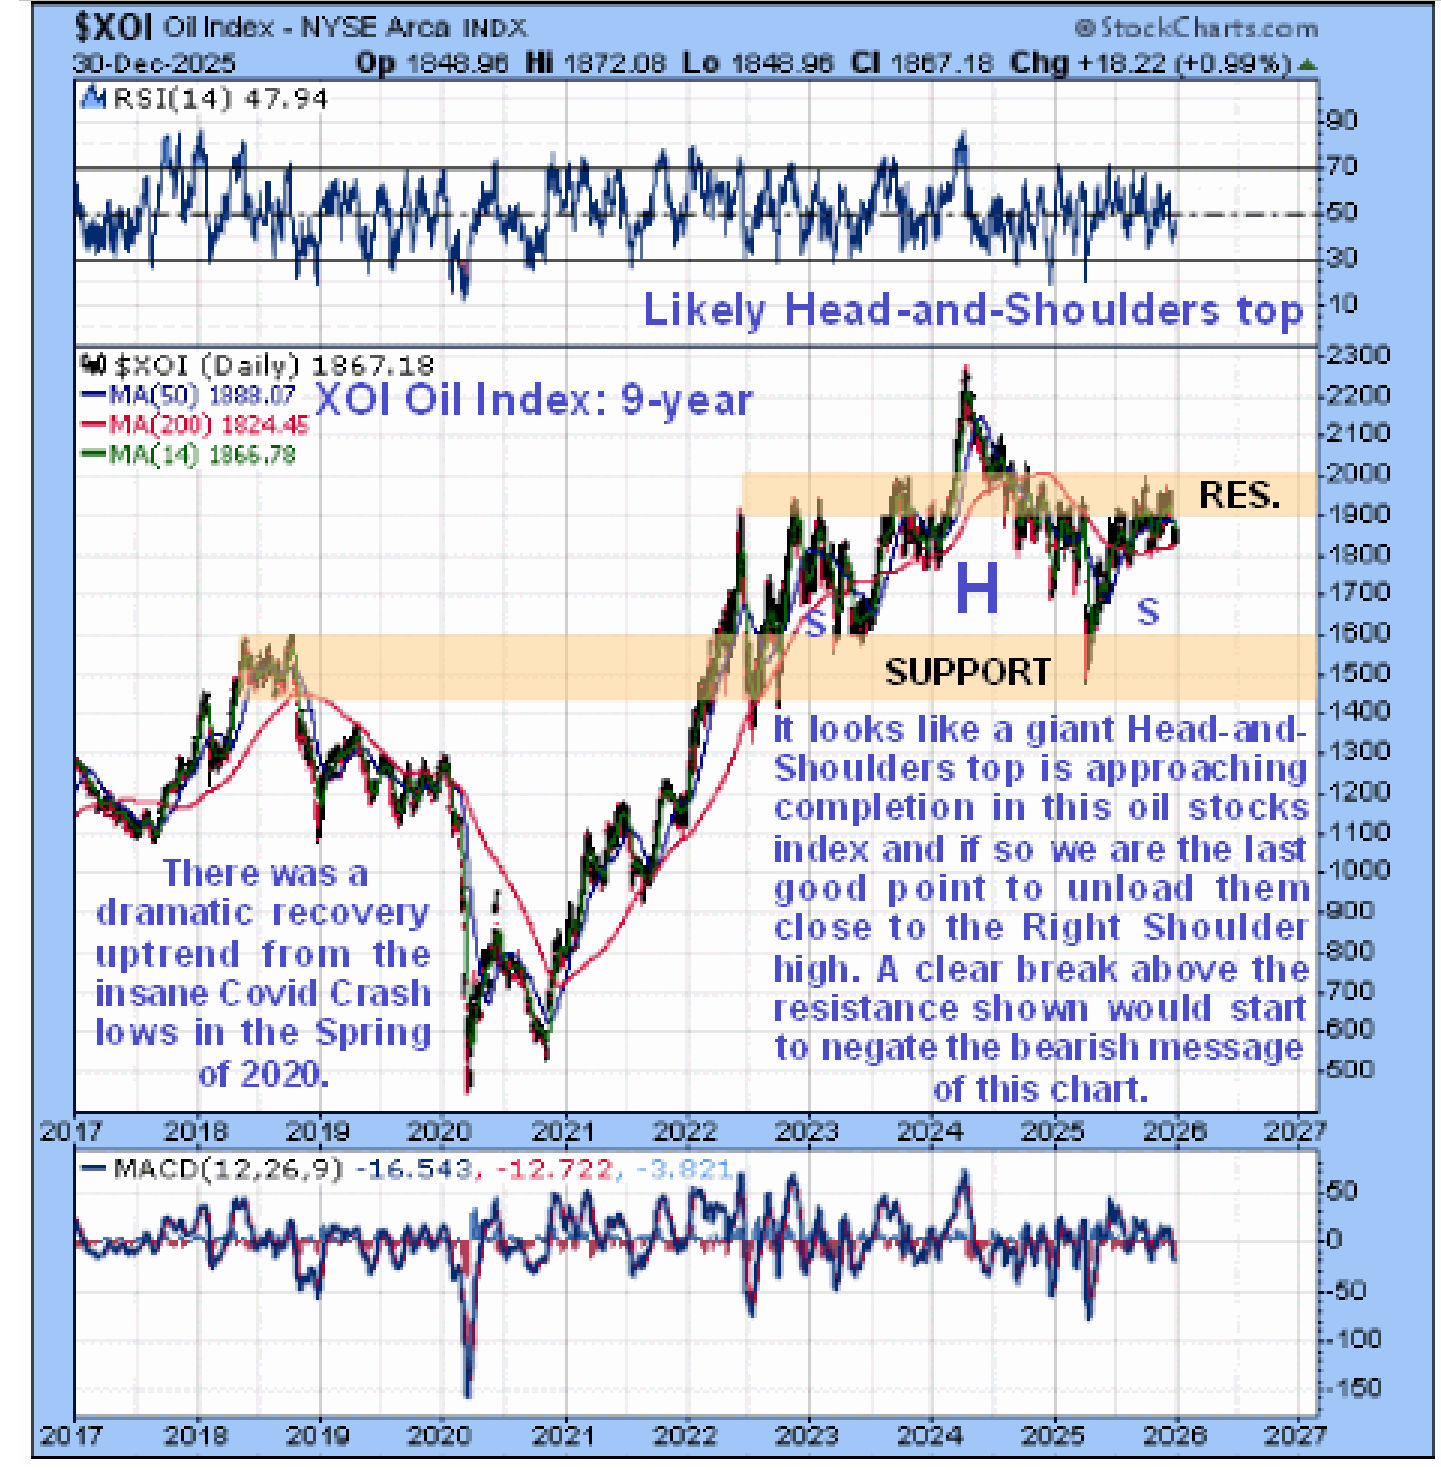
So what about oil stocks? Looking at a 9-year chart for the XOI oil index we see that at this point the picture looks grim with this index appearing to be marking out the high of the Right Shoulder of a giant Head-and-Shoulders top. If this is what it is - and it very much looks like it, then we are at a very good point to dump most oil stocks, especially those those slavishly follow the indices, taking advantage of the current good prices.
 2026 should prove to be much more interesting than 2025 was for the oil market.
End of update.
Posted at 10.55 am EST on 31st December 25.