The situation is paradoxical ? the charts of just about everything are positioned for a plunge ? or a turnaround and limited recovery, which reflects the fact that markets are waiting on some sort of resolution of the standoff with Greece, either Greece walking away, a Grexit, or a fudge solution where Greece accepts defeat and is denied debt relief or it is obfuscated sufficiently for the markets to buy it and this may involve another ?can kicking? exercise. While the charts for many commodities look scary, including gold and silver, their COTs now look bullish, which suggests that the fudge solution will be the outcome.
As far as the charts are concerned the situation remains the same as at the time of last week?s update, with the risk of a steep drop by both gold and silver. Both broke sharply lower early last week but went on to recover their losses as the week wore on. The big difference is in the COTs, which have improved rather dramatically over the past 2 weeks, especially silver?s COT, which is now flat out bullish, at least for the short to medium-term.
Let?s now proceed to look at the latest charts. The 8-year chart for gold shows it positioned for a C-wave plunge to the $850 - $1000 area, but its latest COT chart shown immediately below, reveals that Large Specs have almost given up on it, which in itself is bullish ? these sort of readings have almost always marked important bottoms in the past. The COTs for both copper and silver now look positive too, in copper?s case after a quite steep drop. Here we should note too that the Chinese market has scope for further recovery after its recent brutal plunge, and the US stockmarkets are positioned to rally back to near their highs ? if there is an easing of the Greek crisis.


Click on chart to popup a larger clearer version.
The 1-year chart for gold shows that it is testing a zone of important support at its November and March lows, which is clearly a good point for it to turn up, although the positioning of the bearishly aligned moving averages close by above could force a breakdown to new lows.

It?s worth digressing to look at the charts for copper, which provide circumstantial evidence of a possible intermediate bottom in commodities here. On copper?s 1-year chart we see that it too is in a good position to turn up, because after a steep drop from its May highs which got panicky early this month, it is oversold and at important support at its January lows. We shorted copper early in May.

Copper?s COT is now looking increasingly positive, with the ever right Commercials building a bigger long position?

Click on chart to popup a larger clearer version.
The biggest threat to commodity prices is the potential for another big upleg in the dollar, and what happens with the dollar depends on what happens to the euro (the dollar index has a 57% euro weighting), and what happens to the euro now depends now on the outcome of the Greek mess. In the last update we pointed out that the dollar was poised to begin another major upleg ? it still is, BUT the breakout attempt is starting to look shaky and like it could fail. If it does fail and the support in the 93 area on the index fails, which just to be where the 200-day moving average is, which makes it more significant, then things could get ugly fast. This may be what the positive commodity COTs are signaling.

What about the dollar hedgers chart? ? it is still showing quite strongly bearish readings, although they have eased from the extremes of a couple of months ago. So the dollar could be topping out after all. The big dollar rally of the past year has been driven by a combination of the euro?s woes and unwinding of the global carry trade ahead of an expected Fed rate rise. While it is hard to see the euro improving much, since a fudge solution of the Greek mess will only buy time for the beleaguered single currency, the carry trade unwind could stall out if the market senses that the Fed is bluffing re raising rates, because it can?t due to its back being to the wall. This would probably be the reason for a drop in the dollar.

Click on chart to popup a larger clearer version.
Chart courtesy of www.sentimentrader.com
Now let?s proceed to view various indicators for gold as usual.
The gold hedgers chart, a form of COT chart going back further, is starting to look quite strongly bullish, having improved markedly in recent weeks. This certainly suggests that at least a bounce is probable in the weeks ahead?

Click on chart to popup a larger clearer version.
Chart courtesy of www.sentimentrader.com
The Gold Optix has improved substantially over the past couple of weeks to levels that are flat out bullish?

Click on chart to popup a larger clearer version.
Chart courtesy of www.sentimentrader.com
Rydex Precious Metals assets readings are now strongly bullish, since the dumb Rydex traders are always wrong and their holdings are now at a very low level. Their holdings peaked at the top of the bearmarket rally late in 2012. Interestingly, we have seen a pickup in volatility in this gauge in recent weeks, suggesting that some Rydex traders may be having second thoughts.

Click on chart to popup a larger clearer version.
Chart courtesy of www.sentimentrader.com
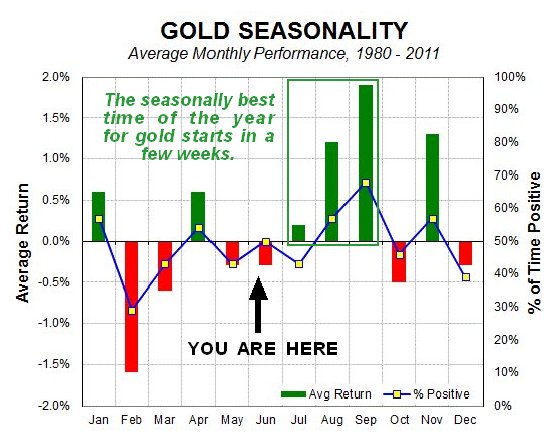
Finally, it is worth keeping in mind that we are now entering the most bullish time of year for gold, as the seasonal chart below shows?
Conclusion: while it may look like this update is a classic example of fence sitting, there is a good reason for this, since the situation depends on the outcome of something which is unknowable, except to God ? the outcome of the negotiations between the EU and Greece. What we can be sure about is that the scales will tip one way or the other very soon, and we do have some indication in the COTs, which are suggesting that after much protest the Greeks will kneel before their European masters and live on bread and water for years ? in other words the recent vote will be ignored. However, if they walk away and out of the euro, a global selloff is likely to be the result involving a rising dollar and falling commodities, including gold and silver.