The higher is gets the more dangerous it becomes, and now we have news that this meltup in the broad market is being driven by the retail investor, just as we would expect going into the top. SentimentTrader reports that so far this month, 34% of the trades have been accounted for by E-Trade and TD Ameritrade, more than triple the low in 2016, with daily average revenue trades skyrocketing.
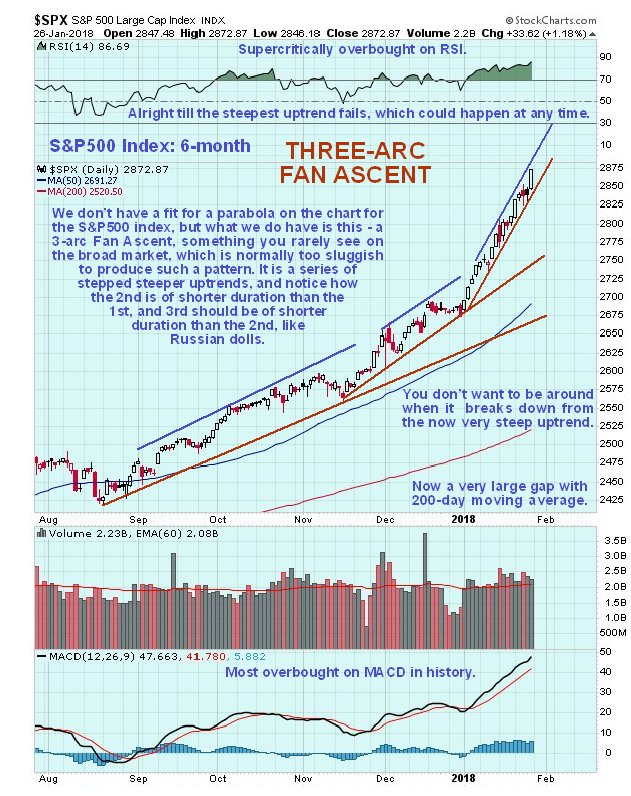
Now we will review the charts. On the 6-month chart for the S&P500 index we can see that the index is continuing to advance steeply within the third channel of a 3-arc Fan Ascent. Actually, although impossibly steep, this ascent is so far orderly, insofar as it is continuing within the confines of this parallel channel. This is important to know because it will take a breakdown from this channel to constitute a sell signal – either that or a big reversal candle. Until either of these events it could continue even higher, although it is so incredibly overbought now that reversal looks imminent.
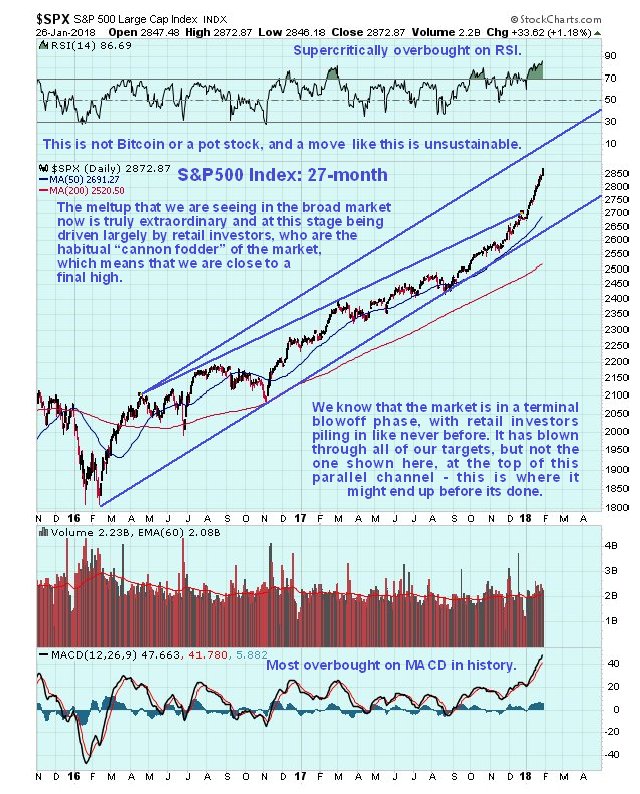
The market blew right through our earlier channel, delineated on a 27-month arithmetic chart, so now we see what we get with a log chart. If we draw a parallel upper trend channel boundary to complement the lower one, which is valid as it has 3 distinct contacts, we find that the meltup could blast even higher before it’s done, to the upper channel boundary, which would probably happen fast with a “throwover” breakout of the steepest channel shown on the 6-month chart. While we should look out for this possibility, the market could now reverse anytime as it is so overbought. Here the point made in an earlier article is worth repeating that that the US stockmarket is not some tiny fringe market like Bitcoin, or even a modest sized sector like cannabis, it is broad and deep and it takes vast amounts of capital to drive it steeply higher as now, and for this reason such vertical moves are unsustainable for a long period of time. Thus, it is considered very likely that this rally will reverse to the downside soon.
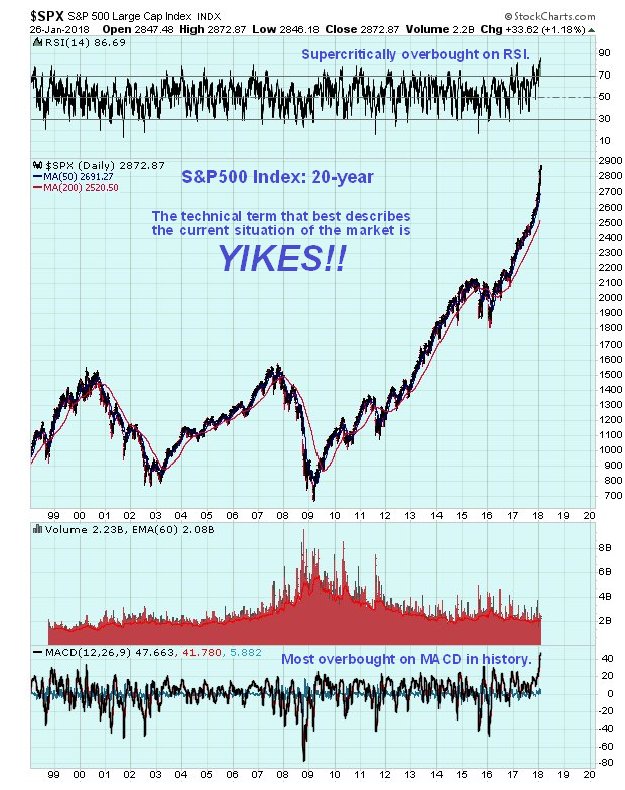
The long-term 20-year chart makes it as plain as day that this market is riding for a fall and probably very soon, with the retail investor now arriving right on cue in vast flocks to be fleeced and left for dead.
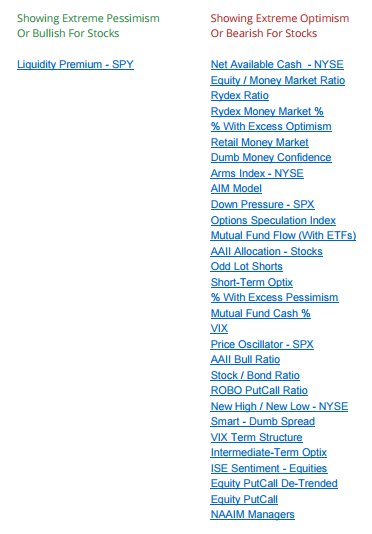
Now we will look at some ancillary indicators which provide additional evidence that the market is closing in on a very important reversal.
We start with indicators at extremes, which show that nearly all indicators are at levels of extreme optimism, which is bearish for stocks…
Next the Put / Call ratio – the mob and trend followers are “falling over themselves” bullish, and thus heavily skewed to Call over Puts, a sign of a top, especially at these extreme readings…
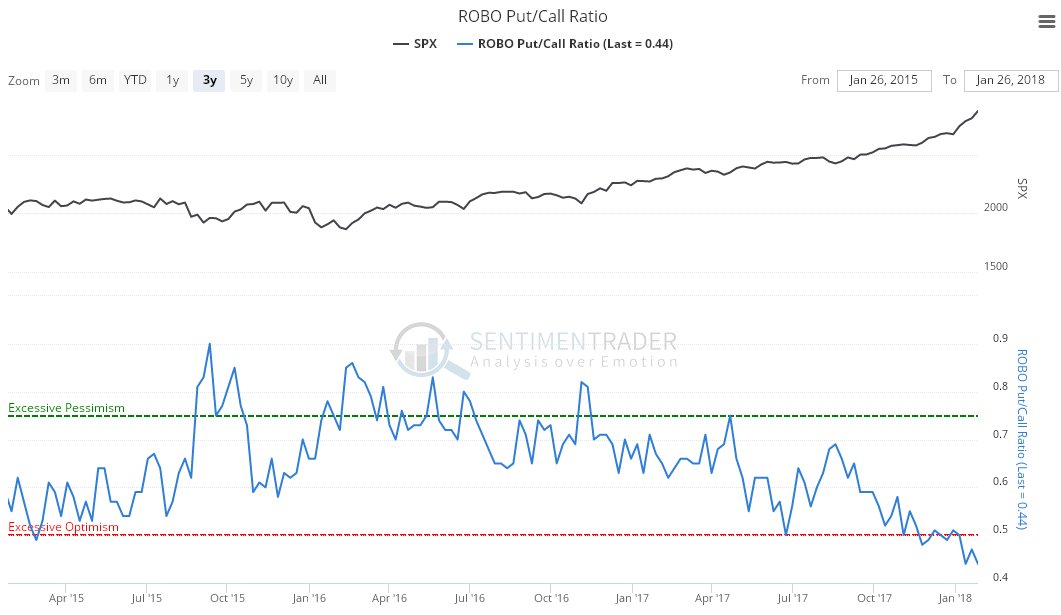
Click on chart to popup a larger clearer version.
Now the percentage of “gap up opens”, which is at an all-time record, an obvious manifestation of an extreme….
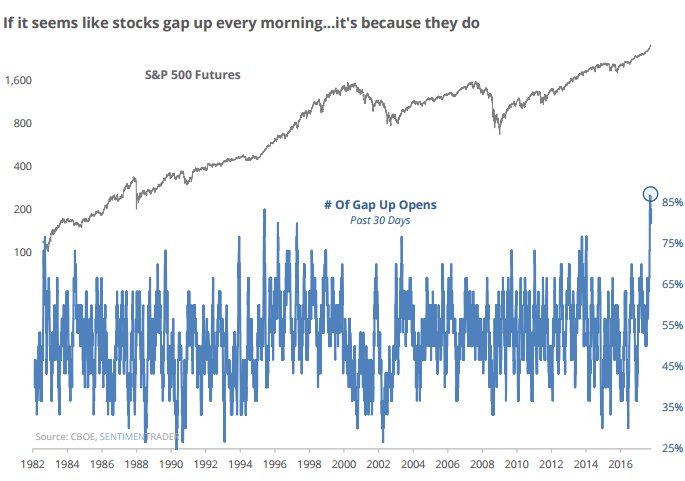
Last 3 charts courtesy of sentimentrader.com
Finally, the NYSE Investor Credit chart, which shows it at mind-boggling extremes. The last 2 extremes, just ahead of the Tech Wreck in 2000 and the market crash of 2008 are dwarfed by the extremes we are seeing now…
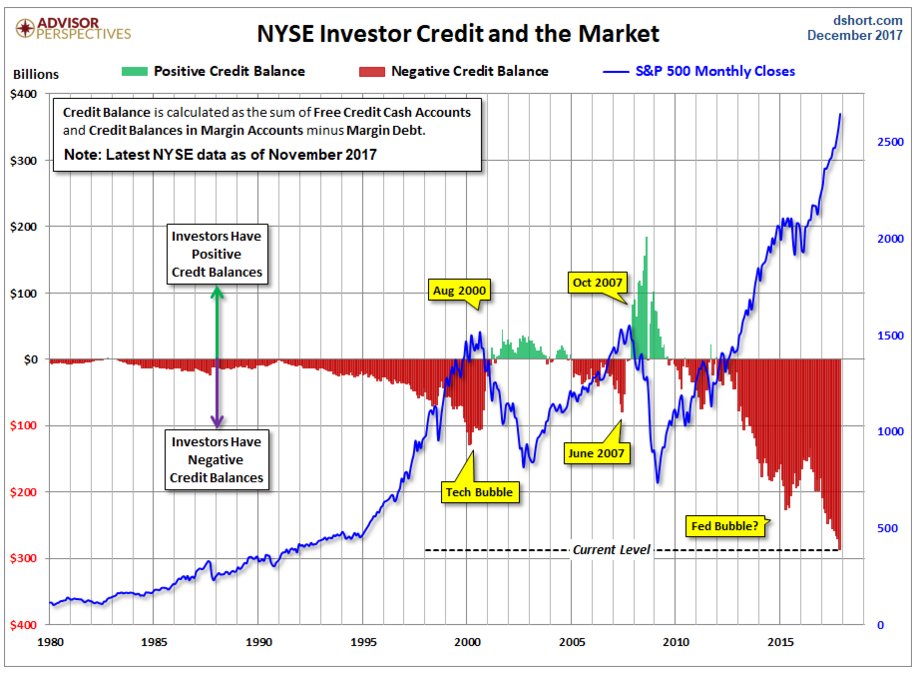
Click on chart to popup a larger clearer version.
Chart courtesy of Advisor Perspectives (dshort.com)
So, we now await either a breach of the steep uptrend shown on our 6-month chart, or a reversal day candle or candles to signal the final top.
End of update.
Posted at 9.40 am EDT on 29th January 18.


