Just when you think you have it all sewn up and in the bag, the market throws a curve ball. During the day intermediate reversal candles have started appearing in many of our cannabis stocks, in some cases on immense volume. This is a warning that the sector may be topping out, at least for now, and it has to be said that some of them could use a rest. So forget what I said about “staying the course” in the update posted on the site this morning. We are not going to stand by and watch our profits evaporate, which in some cases are very substantial and made in a short space of time. We did pick up on this with
Canopy Growth Corp and
sold it at the top in the early trade this morning.
The following stocks in particular should be sold before the close today. Note that clicking on the stock name will take you back to the most relevant article on it.
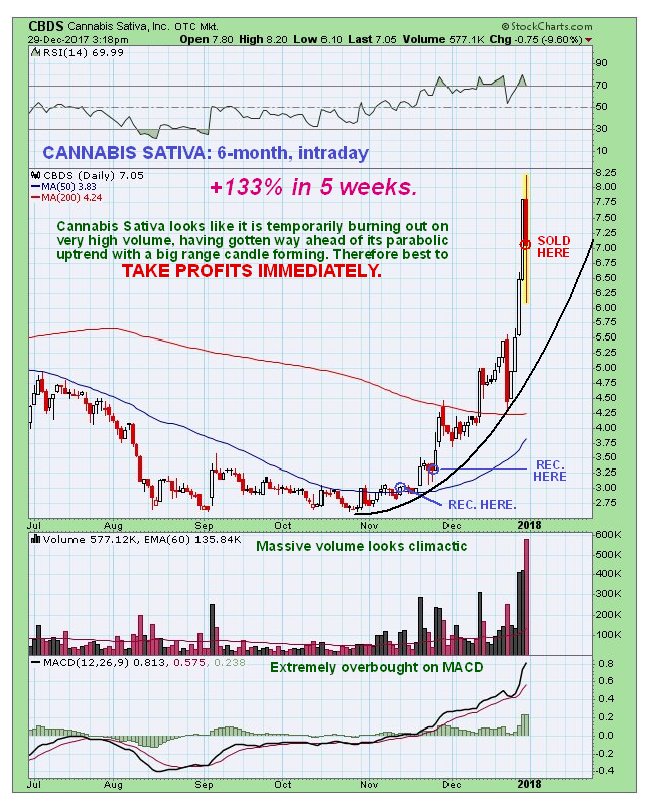
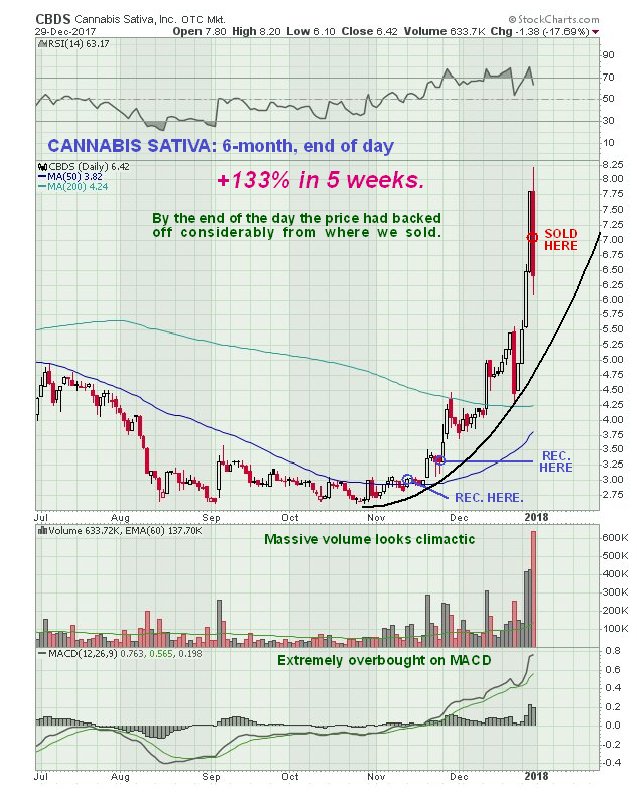
Cannabis Sativa CBDS on OTC, $7.05
 General Cannabis
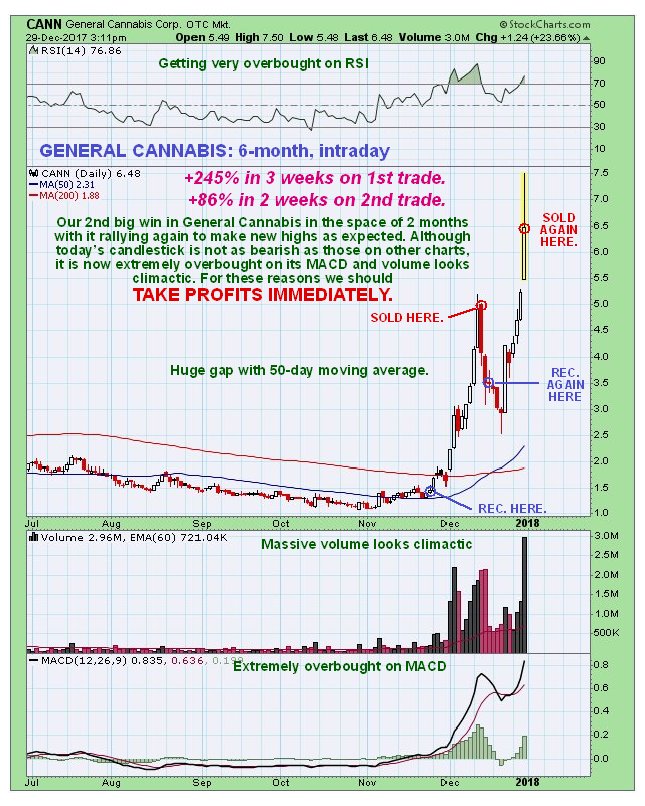
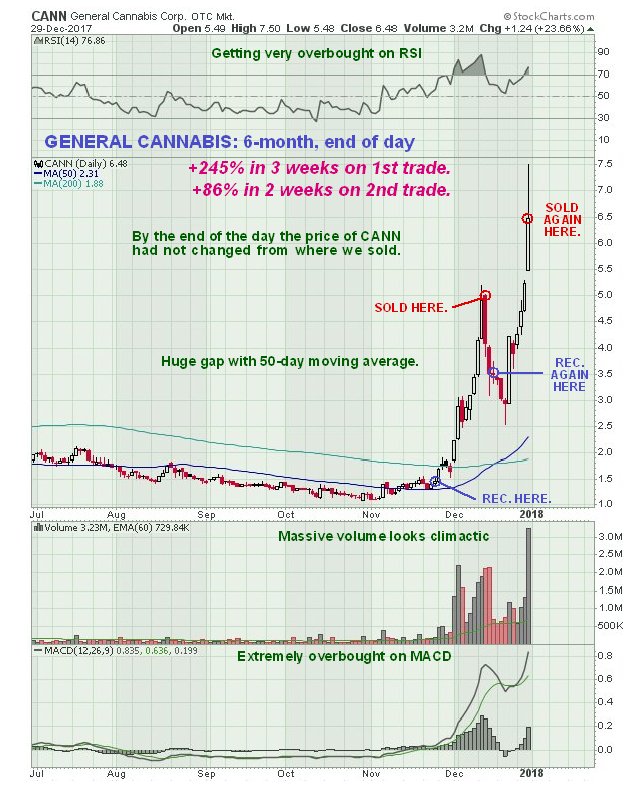
 CANN on OTC, $6.48
You may have missed the 2nd trade shown on these charts, if you set a stop at $2.98 and got stopped out.
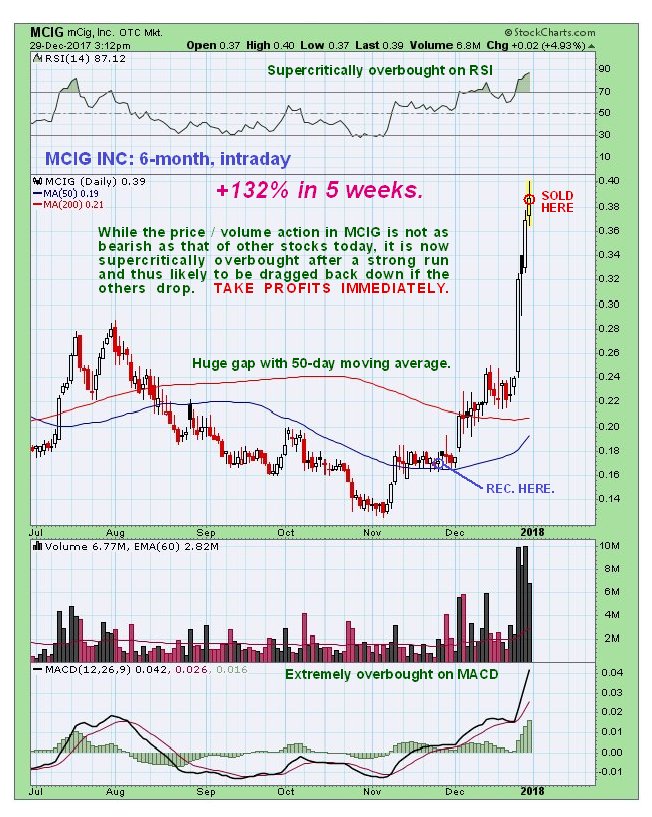
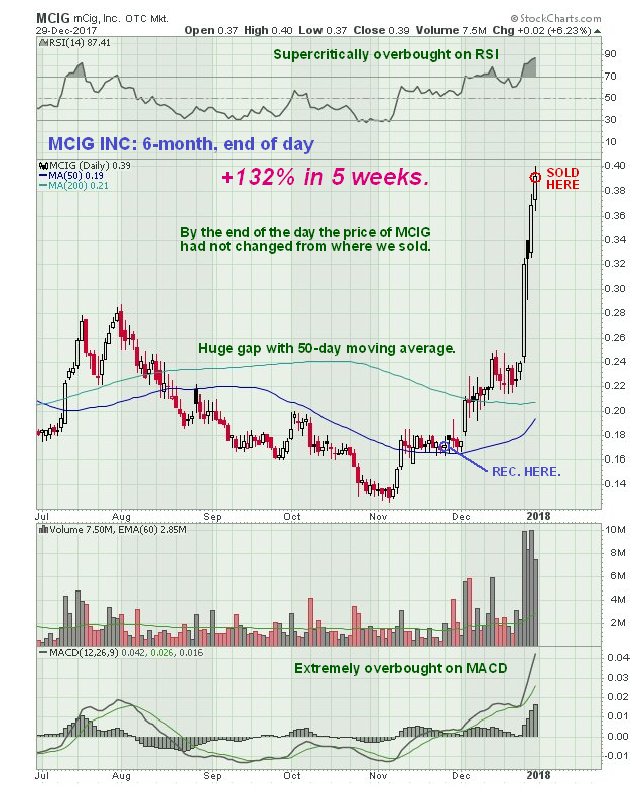
 mCiG Inc
 MCIG on OTC, $0.39
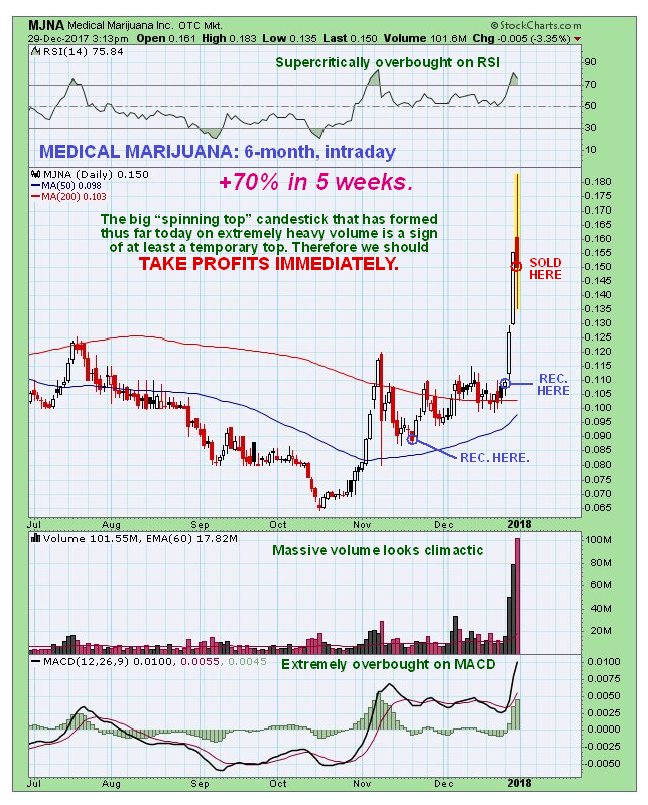
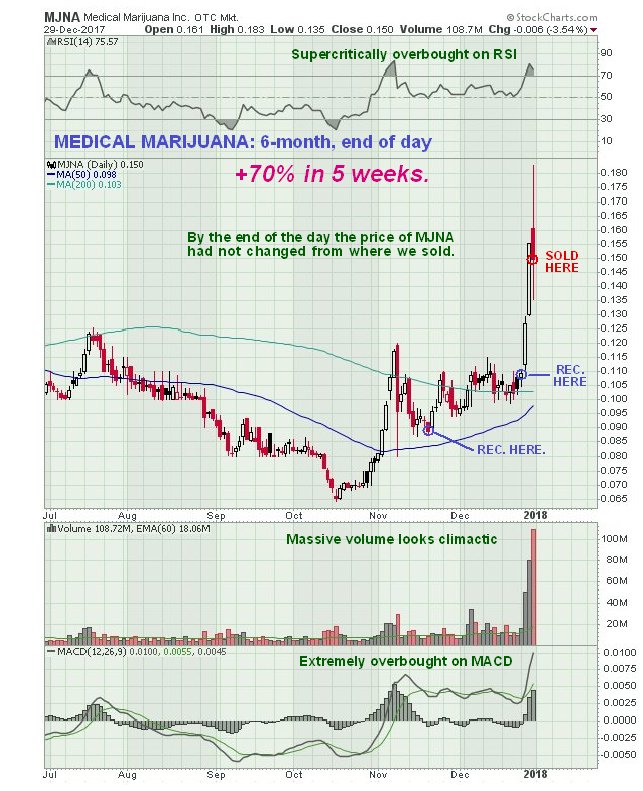
 Medical Marijuana
 MJNA on OTC, $0.15
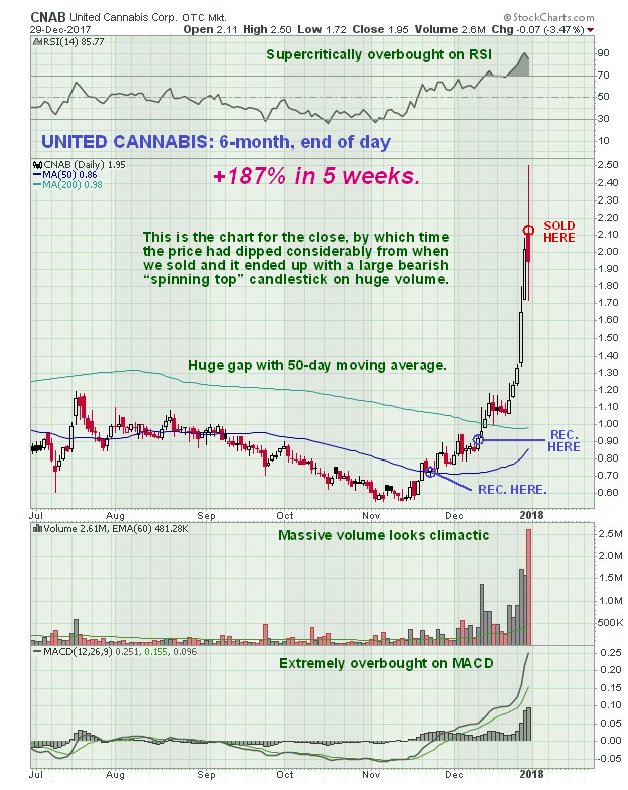
 United Cannabis
 CNAB on OTC, $2.13
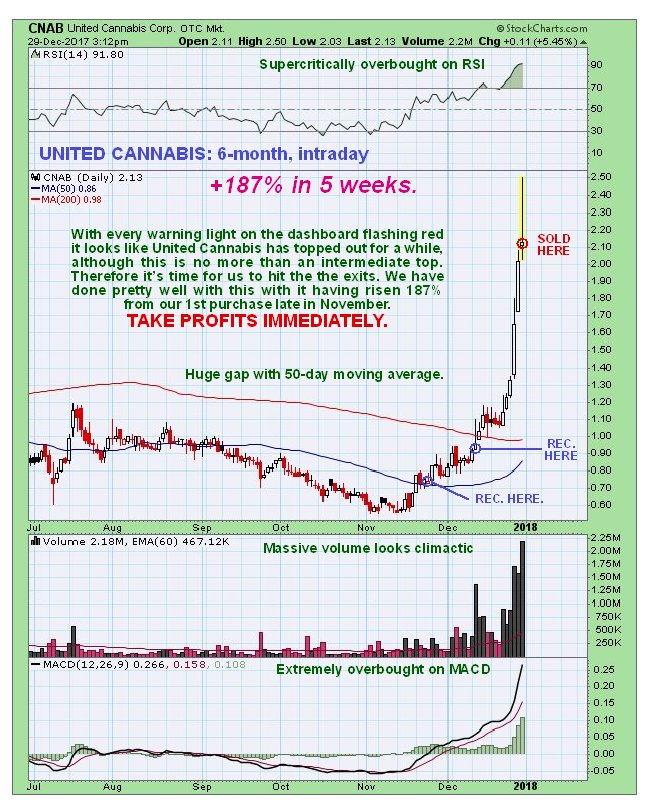
According to the perverse logic of the markets it might make sense for an intermediate top to form here – they have had a big run, it’s the end of the week, end of the month, end of the year, and it might be the old “sell on the news” thing, where the legalization in California on the 1st is the fundamental “magnet” that has pulled them higher, but once this date arrives, investors start looking for other things to worry about.
Whilst this may seem panicky, we have reason to be very pleased overall. There is an old saying “You can’t go wrong taking a profit” – that is much more true, when it’s a BIG profit, as is happily the case for us with these. The other positive aspect of taking this action now is that if they do react back soon, we can zoom right in and scoop them all up again at better prices.
So, man your stations.
End of update.
Posted at 3.20 pm EST on 29th December 17. Charts added and improvements made the following morning and posted at 6.30 am EST on the 30th. All prices are for the times of the intraday charts in the article, whilst the closing prices may be observed on the 2nd chart for each stock, which were lifted after the close.