If there was a competition for the “poster child” of the great bullmarket, Apple would certainly be a strong contender, for its price has risen from about $10 at the end of the 2007 – 2009 financial crisis to recently hit $233.47, which is no mean achievement given that it has close to 5 billion shares in issue – small wonder then that its capitalization recently surpassed the $1 trillion mark.
A big reason for Apple’s stellar success has been strong product differentiation that has fostered extraordinary brand loyalty that the company has tapped to the full, enabling it to benefit from huge gross margins on its products. This is the reason that it has been able to splash out on its grandiose “donut” HQ at Cupertino, near San Francisco, which is probably a more imperious establishment than the governments of some countries have.
In the world of technology however, things are always changing, and if you have a great product or products, sooner or later your competitors are going to close the gap with you, especially if complacency and extravagance set in, which is normally inevitable. It is therefore not logical to expect Apple to stand Head-and-Shoulders above its competitors for ever – yet to look at it stock price, that is clearly what most investors expect. The potential for future disappointment is huge, and if we couple this with the fact that the world is heading for a debt induced recession /depression that will reduce aggregate demand, it becomes clear that the downside for Apple’s stock from here is massive – not to put too fine a point on it, it could crater, and as we will see on its latest charts, it looks set up to do just that.
We’ll start by looking at the comfort inducing short-term chart for Apple and then zoom out via the not particularly troubling 3-year chart before concluding with the “tip you out of your chair” long-term chart.
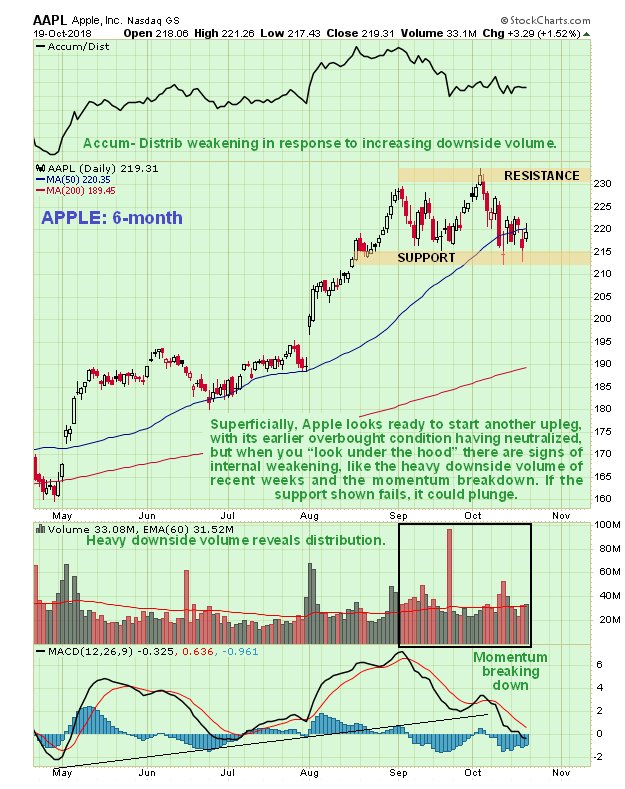
At first glance Apple’s 6-month chart does not give rise for concern – it looks like it has been fluctuating in another common or garden consolidation pattern since the last strong runup in August. However, if we look closer we can see that downside volume during this trading range has been heavy, which is why the Accumulation line has been sinking, and while bulls can reasonably point to the unwinding of the overbought condition as shown by the MACD indicator retreating to the zero line as a sign that Apple is ready to go up again because the trend is still up, again, if we look carefully, we can see that momentum is starting to break down. If we now factor in that the stockmarket is weakening in the direction of crashing, thanks to the Fed’s ongoing liquidity drain (QT) and continued raising of rates, it is not hard to see how Apple’s stock could soon weaken dramatically.
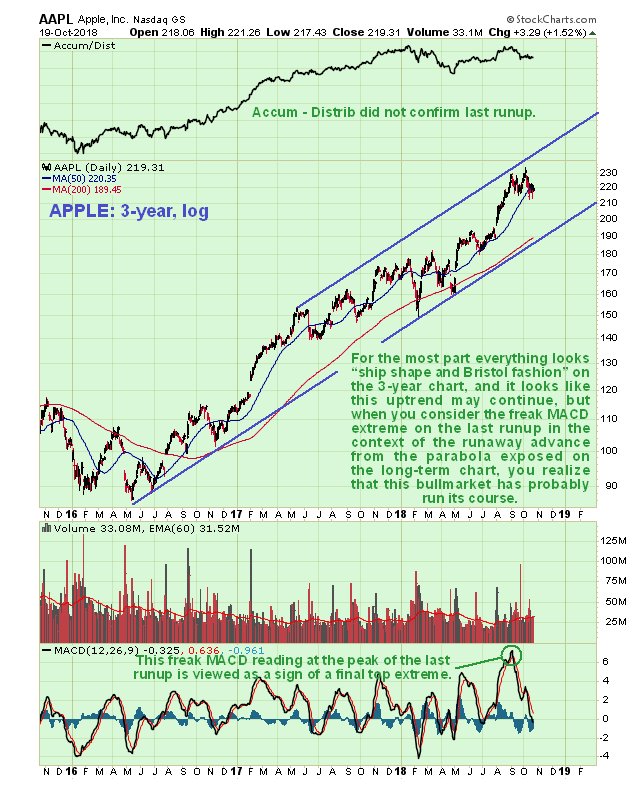
The 3-year chart for Apple is not particularly worrying either since it shows an ongoing uptrend, but again, on closer inspection we can see a couple of factors that significantly raise the risk of a breakdown and steep drop soon. One is that the runup from April through August was big, from $160 to $228, and exceptionally steep, resulting in a freak overbought reading on the MACD indicator which reached a record extreme by a wide margin. This is the sort of action that we would associate with something closing in on a final top, and we can easily see why that might be the case when we look at the very long-term chart. At the very least Apple has put in an intermediate top close to the upper boundary of the uptrend channel shown and would be expected to react back across it.
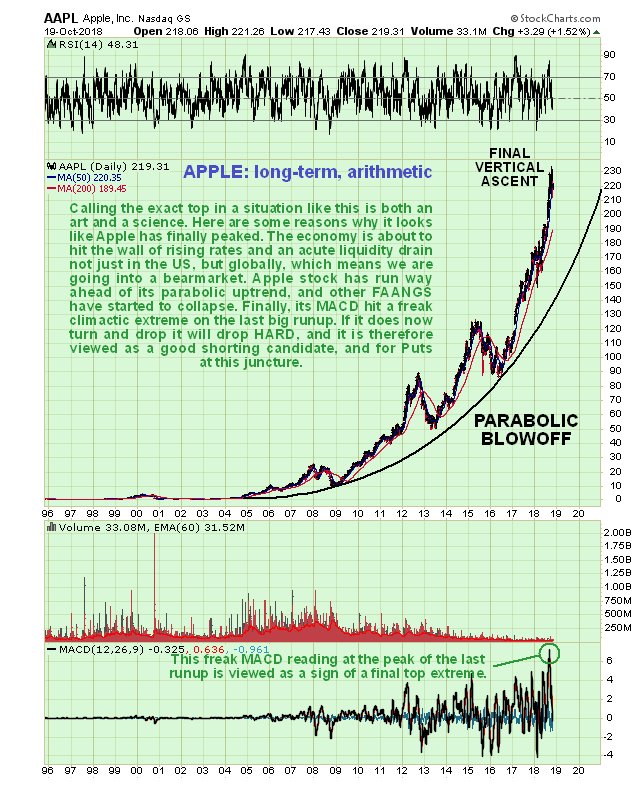
Now we come to the chart that should serve to rinse away any remaining insouciance on the part of investors, the very long-term chart going way back to late 1995 and thus encompasses the entirety of Apple’s long bullmarket. This shocking chart reveals that Apple is now well into the final vertical slingshot phase of a parabolic blowoff. In fact this chart resembles the Bitcoin chart when it peaked last December, and you may recall that we called Bitcoin’s top at about $20,000 within a day of its occurence. It is true though that Bitcoin’s final vertical ramp was more extreme than what we have seen in Apple up to now, but keep in mind that Apple has limiting factors in play, like the fact that it has over 4.8 billion shares in issue, so it is not be capable on putting on a finale like Bitcoin even if it wanted to. Taking this latter statistic into account it is truly remarkable that it has risen as far and as fast as it has, and the reason that it has is that it has had the wind at its back with the FAANGS stocks generally benefitting from a speculative frenzy against the background of a continually rising stockmarket until a week or two ago. Now though, with a stockmarket crash bearing down on us and Apple’s stock price way ahead even of its fast rising parabolic uptrend, the probability is high that it will soon break down below the nearby support shown on its 6-month chart and plunge. Depending on what is going on in the broad stockmarket at the time we can expect it to drop steeply to the parabola boundary, bounce off its briefly, and then crash through it and plunge.
Alright, so how can we first off avoid harm and furthermore turn this situation to our advantage? In the first place anyone holding Apple stock should sell all of it, immediately. Secondly, with a severe decline in prospect for this stock, it is a good candidate for shorting. Third, it may be possible to net huge gains by buying Puts in it, and Apple’s options have the advantage of reasonably good liquidity. The way to look at it is this – there is probably a 70:30 or at least a 50:50 chance of its dropping hard within the next 2 to 3 months. When we say drop hard, a rapid decline to say $150 is well within the bounds of possibility. If that were to happen before the November $210 Puts that are shown on the table below expire, then we are looking at them appreciating from the current $3.25 ask (Friday’s close) to about $60, which would result in a gain of almost 20-fold. Whilst this is certainly a most attractive prospect for anyone looking to make a big speculative gain, you are reminded that such a trade is only recommended for traders who are experienced with options and who understand and are comfortable with the risks involved.
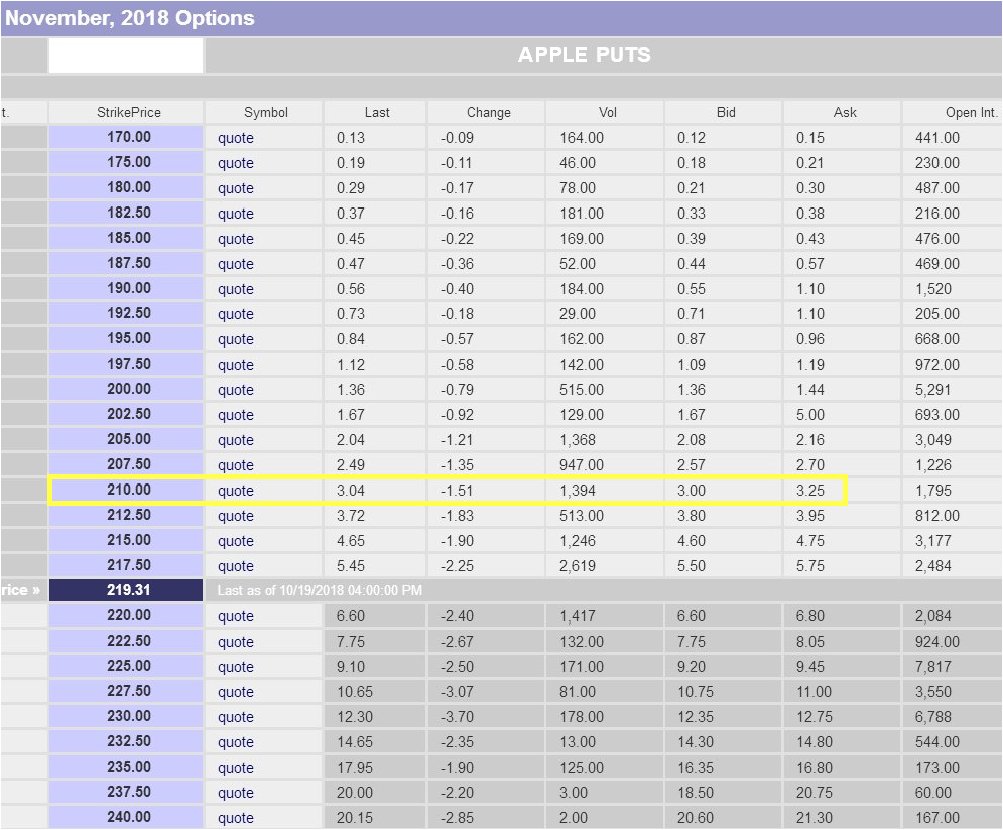
Click on table to popup a larger, clearer version.
Table courtesy of bigcharts.com
If Apple goes down as we are expecting then the other FAANGS are likely to go down in flames too, and they have already started to drop away hard in recent weeks.
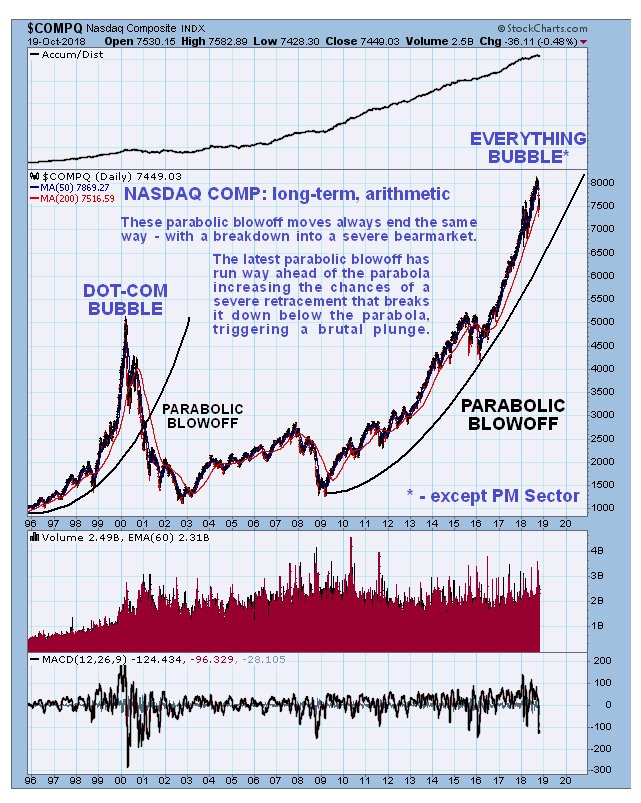
The long-term chart for the NASDAQ Composite index is congruent with the long-term chart for Apple, as we would expect, and shows it going parabolic and running way ahead of the parabola boundary, which, as in the case of Apple, should lead to a reversal and severe drop…
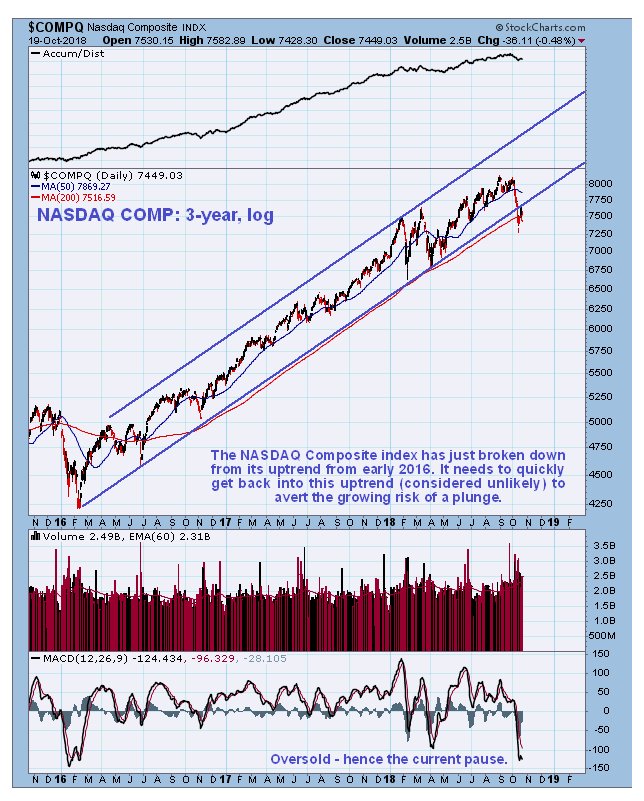
The 3-year chart for the NASDAQ Composite index shows it starting to break down from the steep uptrend in force from early 2016, and we have seen the FAANGS plunge in recent weeks, with the exception of Netflix. (NFLX). The index is currently making a backtest of the failed trendline. From this position it could soon plunge.
End of article.
Apple Inc
website
Apple Inc, AAPL on NASDAQ GS, closed at $219.31 on 19th October 18.
Posted at 12.10 pm EDT on 20th October 18.