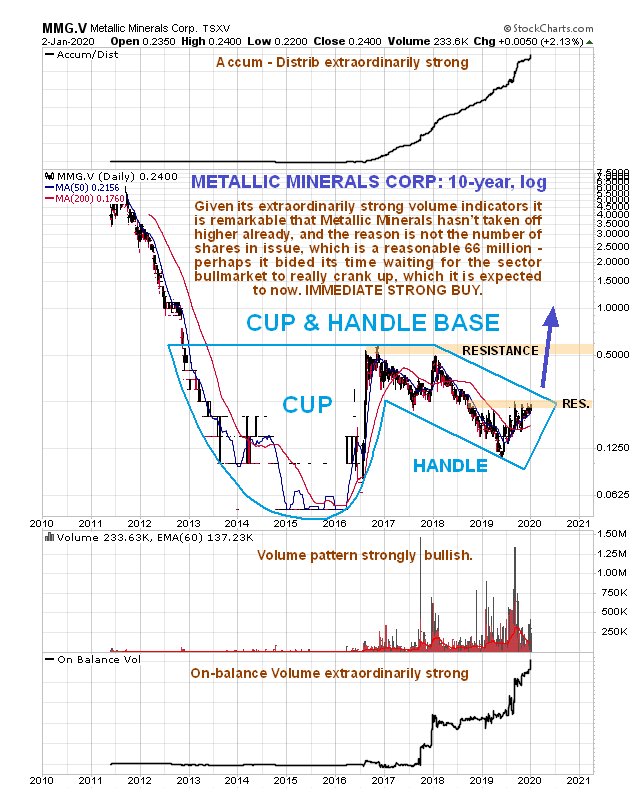
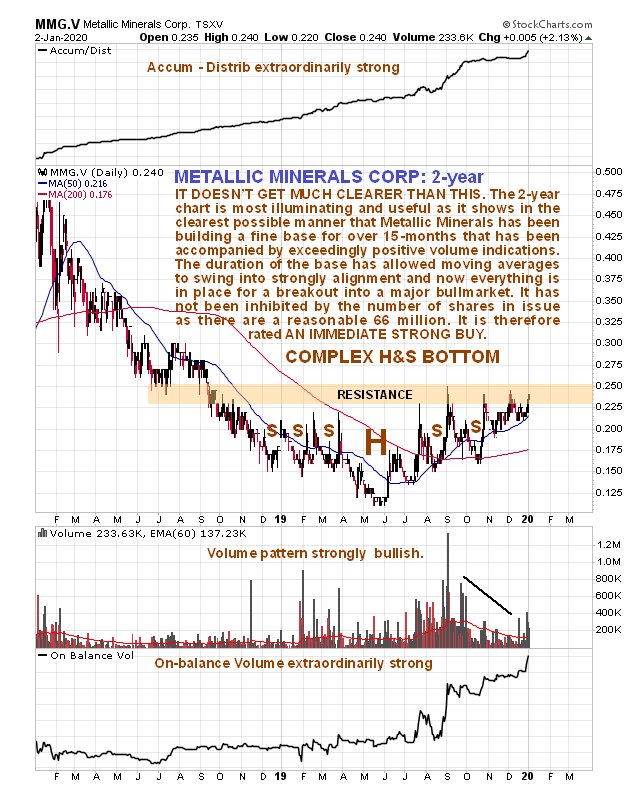
It’s seldom that you see a setup this bullish. Like the steam in a pressure cooker, Metallic Minerals has been building towards a breakout into a major bullmarket for a long, long time, and in fact it is remarkable and almost disconcerting that it hasn’t broken out already – and it isn’t because it has a huge number of shares in issue, because the number of shares in issue is reasonable at about 66 million. Our 2-year chart below however is very reassuring and it would appear that it has simply been waiting for the more dynamic Stage 2 phase of the Precious Metals sector to get underway, which it appears to be about to.
We’ll start by getting a handle on the big picture by means of a 10-year chart, and on this occasion we will use a log chart, because the arithmetic chart flattens out the base pattern so much that you can hardly see it. The log chart reveals that a fine, giant Cup & Handle base pattern has been building out since as far back as late 2012, so it’s been an awful long wait for those investors who have contributed to building out this base – but it won’t be a long wait for those to turn up now, just as the party is due to get started. As we can also see, the volume pattern and volume indicators have been persistently bullish, and extraordinarily so. However, on this chart it is rather hard to make out what has been going on in the recent past, so we will now move on to the 2-year chart.
The 2-year chart is most illuminating and useful, for it reveals that a fine large complex Head-and-Shoulders bottom has been developing for over 15 months that is now fast approaching completion, with the strongly bullish volume pattern and volume indicators pointing to an upside breakout into a major bullmarket. This base pattern has allowed time for the moving averages to swing from a very bearish alignment into bullish alignment, signifying that the time has arrived for the new bullmarket to start.
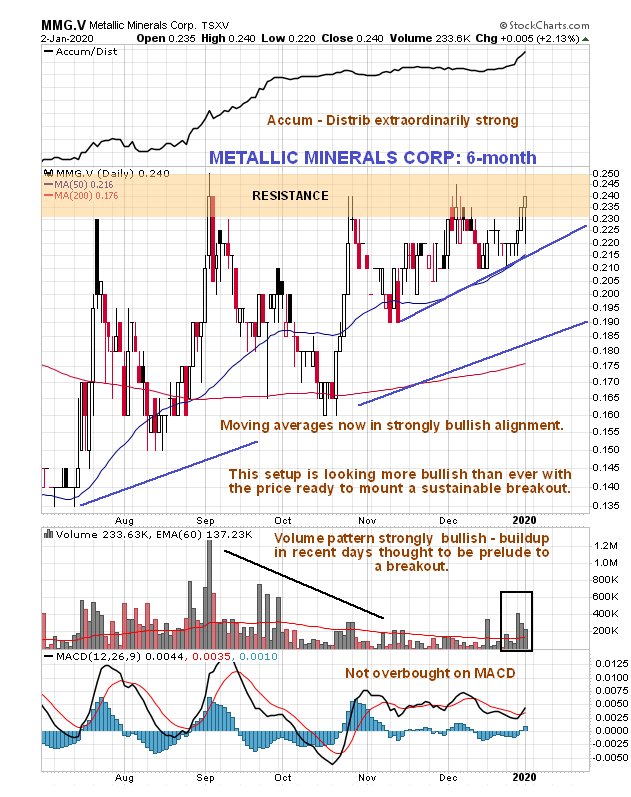
On the 6-month chart we can see the price nudging a breakout already and being forced higher by the nearby rising trendline, with the volume buildup in recent days probably being the prelude to a breakout. The MACD indicator shows plenty of upside potential from here.
Metallic Minerals
website
Metallic Minerals Corp, MMG.V, MMNGF on OTC, closed at C$0.24, $0.183 on 2nd January 20.
Posted at 9.15 pm EST on 3rd January 20.