Whilst it must be frustrating for Precious Metals sector investors to watch Tech stocks continuing to “shoot the moon” while PM stocks have mostly done nothing, the chart presented below suggests that this situation won’t persist for much longer.
The 7-month chart for GDX shows it probably completing the Handle of a sizeable Cup & Handle continuation pattern. GDX has stayed above the support level shown as the Handle of the pattern has formed, which has allowed the earlier overbought condition at the start of the year to unwind and moving averages to catch up. Volume has eased over the past several weeks which is also a positive sign.
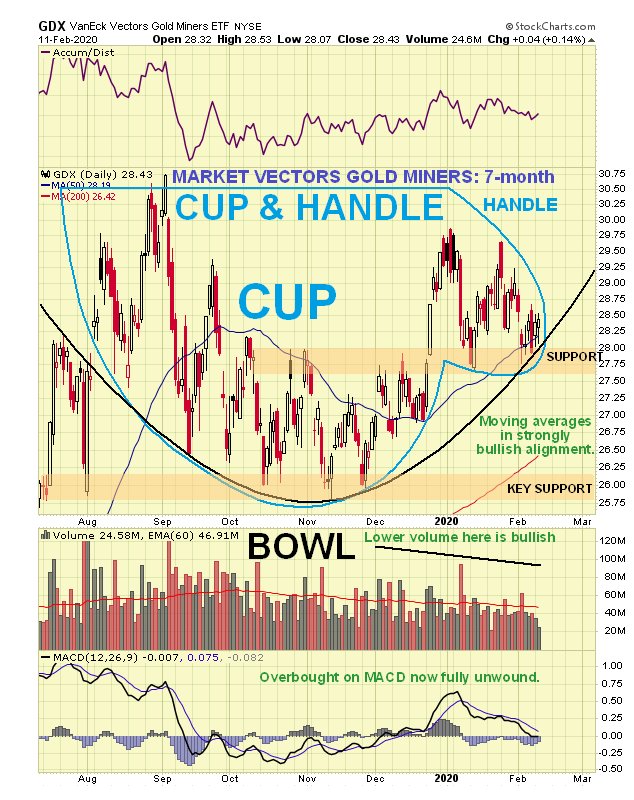
With respect to the timing of the next upleg, the valid Bowl pattern also drawn on the chart helps, for it shows that the price has consistently found support at the Bowl boundary since it started to form last August, and now that it is at it again, with the Handle of the Cup & Handle looking about complete, the time for a new upleg to start is believed to be at hand.
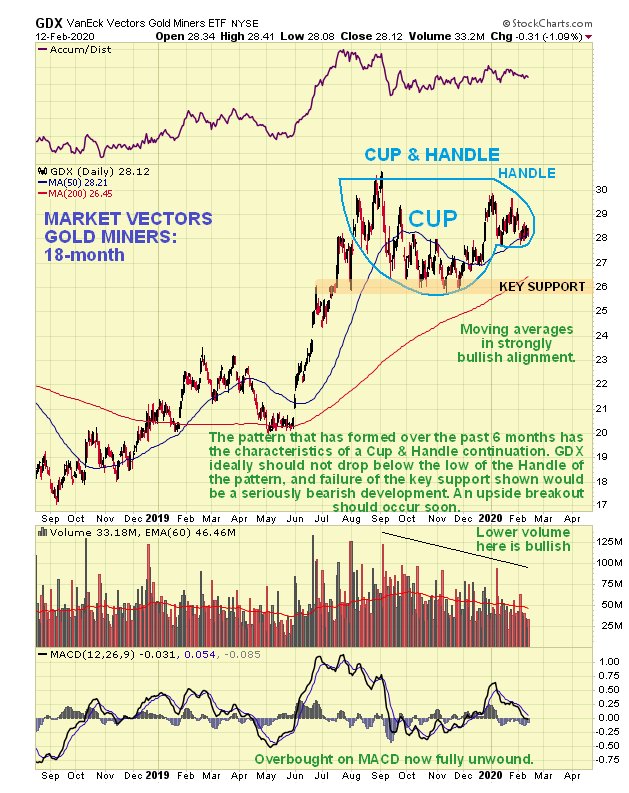
The longer-term 18-month chart for GDX shows what is meant by labeling the Cup & Handle as a “continuation pattern” rather than a Cup & Handle base, which of course follows a drop, for as we can see it has formed at a higher level following the steep runup last Summer. Calling it a continuation pattern means that it is believed to be a consolidation pattern that will lead to renewed advance. While it is expected to break to the upside shortly it should be noted that it would be an unwelcome development if it should drop below the low of the Handle, and also that a breach of the support shown at the lows of the pattern would be a seriously bearish development, although it is considered much more likely that it will soon break to the upside.
 So, with the price at the right side of the Cup & Handle pattern, at the support of the Bowl boundary, at the rising 50-day moving average and at an important support level the time appears to be nigh for a new upleg to begin.
 In addition, the Bollinger Bands (not shown) are pinched together quite tightly suggesting that a big move is imminent and the dollar is in position to reverse to the downside after a run.
End of update.
Posted at 7.00 am EST on 12th February 20.