Outcrop Gold was the subject of an Email alert sent out yesterday before the open, which read as follows…
“Outcrop Gold is amazingly cheap here and good value, especially after it just reported positive drilling results, and closed a Private Placement. It is very close to the 2nd low of a big Double Bottom with its lows of late 2018, and looking set to turn higher. Charts have been saved and we will look at it later today. It is viewed as an immediate strong speculative buy.”
Outcrop gapped up at the open and closed the day up on all-time record volume, only part of which was due to our buying. This was clearly very bullish price / volume action which portends higher prices down the road. We will now proceed to review its charts as promised.
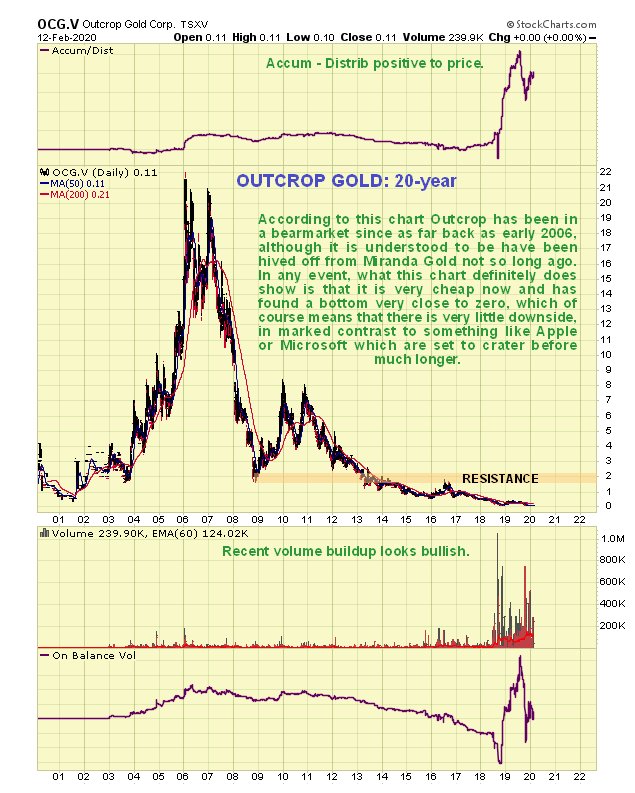
Starting with the very long long-term 20-year chart, we see that Outcrop is now very cheap indeed, which is more than can be said for the likes of Apple and Microsoft etc. That said, I’m not sure what we are looking at here, because it is understood that Outcrop was hived off from Miranda Gold not so long ago, so this chart may be back extrapolated, if you know what I mean. Whatever, there is no arguing with the fact that it is cheap, and even on this chart we can see that it is bumping along at rock, stony bottom.
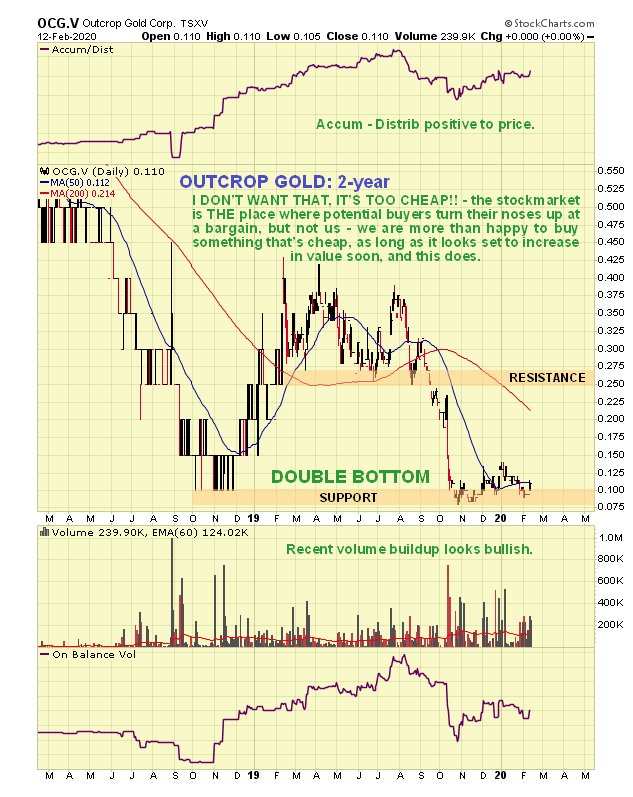
Now we’ll open out recent action by means of the 2-year chart, to see more clearly what is going on. This chart enables us to see at once that Outcrop appears to be completing the 2nd low of a large Double Bottom pattern, and it is now unlikely that it will break lower still for several reasons – one is that it is now very cheap, as already mentioned, another is that the fundamentals of the company are improving, and they just reported good drilling results, and a third reason is that the sector is believed to be getting ready to take off higher again. If it proceeds to break out upside from the current trading range that comprises the 2nd low of the Double Bottom, then it should at least run to the resistance shown in the C$0.25 – C$0.27 area, which would result in it more than doubling from the current price.
On the 6-month chart we can see that after the price dove down to form the 2nd low of the Double Bottom, it has been trundling sideways since October in a fairly narrow trading bounded by support at 8 cents and resistance at 14 cents. So clearly, a break above the 14 cent level should trigger the anticipated advance. On this chart we can also see that most of trading volume since last October is upside volume, which is bullish, and this is the reason that the Accumulation line has been trending higher over the same period, which is also bullish. Although it could mark time for a while longer to allow the 200-day moving average to drop down closer to the price, basically it could break higher at any time, and yesterday’s big volume advance suggests that it will sooner rather than later.
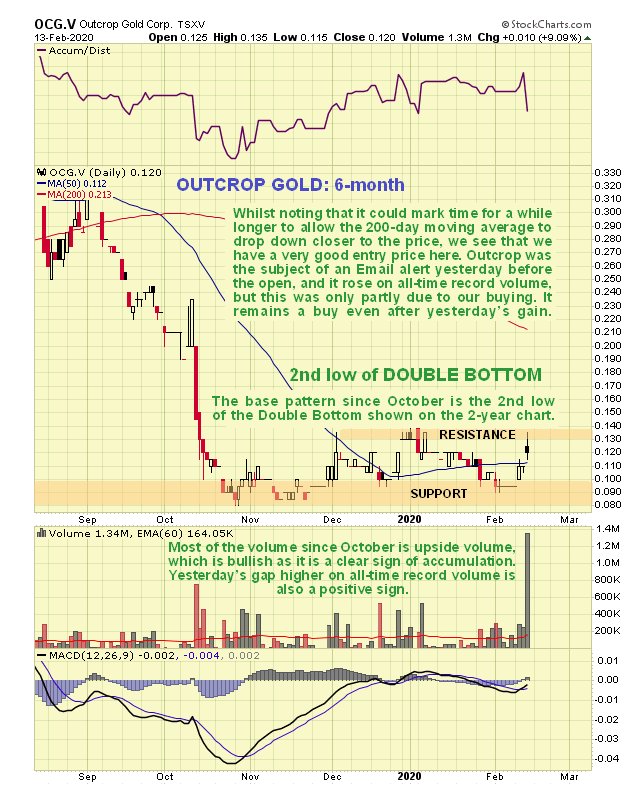 Although we bought Outcrop yesterday, it is little changed in price from where we bought it, as it gapped higher at the open and then didn’t move all that much during the day, and since it is still quite some way from breaking out of the trading range even after yesterday’s 9% gain it is as much a buy today as yesterday.
Finally, this article is aimed at the majority of subscribers who it is understood like to buy low and sell high, but in an effort to cater to all tastes the following chart is included for the benefit of those few of you who like to the opposite…
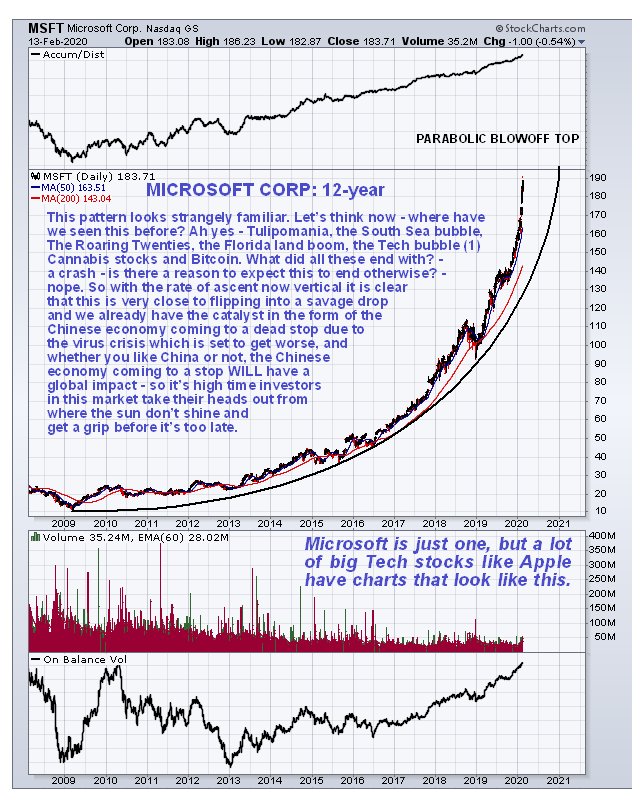
To be honest, I prefer Outcrop Gold at this juncture and I suspect that most of you do too. We will be looking at Put options in Apple and Microsoft on the site soon.
Outcrop Gold
website
Outcrop Gold Corp, OCG.V, MRDDF on OTC, closed at C$0.12, $0.09 on 13th February 20.
Posted at 6.40 am EDT on 14th February 20.