In this update we are going to review a small but important range of commodities / lead indicators which strongly suggest that the seemingly endless bullmarket in US equities is living on borrowed time and will end sooner rather than later, and given how long it has lasted and how extremely overvalued it has become, the downturn will likely start with a crash phase.
Regardless of what the eventual impact of the Coronavirus epidemic is, US stockmarkets in particular seem to be in a state of denial about the actual real-world consequences of the Chinese shutdown and impact on the global supply chain and corporate profitability everywhere, and some elements even seem to be gloating about China’s misfortune and predicament, completely oblivious to the fact that this is going to have a negative impact on almost everyone.
The following points were made by a reader and while I don’t necessarily concur with all he has written, I am open to the possibility that all or much of this may be correct, and if it is, we are looking at serious problems emerging before much longer…
I am getting reports from friends in SE Asia of the precipitous collapse of
global freight as the full impact of China's colossal shutdown impacts across its economy and now, unsurprisingly, the global economy. Port ship handling in Malaysia, Singapore and Japan is down 50% already; i.e. shipping freight.
Supply chains across all sorts of industries are collapsing as all components made in China dry up for all sorts of products from cars to i-phones and computers. There has never been a Global economic disruption on this scale in history as nCoV's contagion rate is 4 x as fast as SAR's and 5 to 8 x as virulent. The Chinese have been economical with the truth concerning deaths, infection rates and the numbers of those now under full quarantine. The real numbers have been variably estimated at being 5 to 10 times the official figures. All attempts at real reporting on the scale of this pandemic are being heavily censored but what I have seen emerging on youtube is very scary / harrowing.
International air and sea travel is in virtual freefall as people are now reluctant to travel or simply can't travel on so many air and sea routes due to these now being closed down by States protecting their populations from infection. Holidays to SE Asia are in a state of collapse in Australia and Europe.
Stock market highs are entirely due to major market manipulative forces / players and not due to any underlying fundamental economic reasons, hence, the market is now totally defying gravity. The MSM is even beginning to acknowledge this fact and most market experts see a major correction / recession as being imminent.
The commodity of the last resort gold (and silver) looks set to go ballistic and takeovers of underdeveloped gold mining assets is in "blast off mode" in Australia. All top brokers in the Australian gold markets are foreseeing AU$ 3,000 / ounce gold by the end of 2020. It's already at AU$ 2,343 / ounce. Silver is the huge sleeper...but not for much longer!”
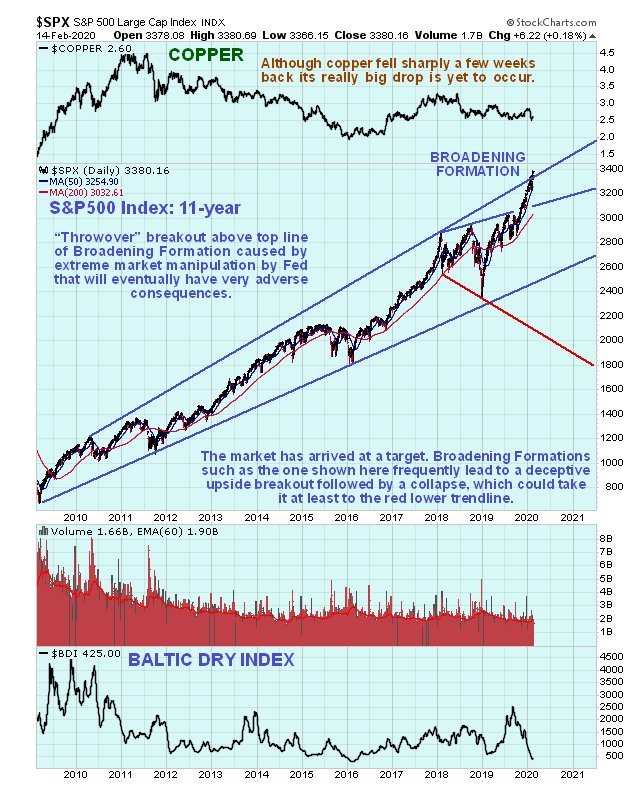
Our roundup of the charts starts with a review of the bullmarket in its entirety using an 11-year chart for the S&P500 index. On this chart we see that this bullmarket has been going on for almost 11 years now, from the low in the Spring of 2009, with the latest upleg, which is really steep, taking the index up to a target at trendline resistance at the top of the expanding uptrend channel shown, which is clearly a good point for it turn down, especially given how steeply it has risen in the recent past. One of the big arguments currently being put forward by bulls is that “the market can’t drop because Trump is going to win the election in November by a landslide” This may well be true, but since the market moves to discount larger economic developments 9 months in advance of them, it means that it is already right now discounting a Trump victory.
Now let’s turn our attention to the lead commodities / indicators which are already calling time on this bullmarket.
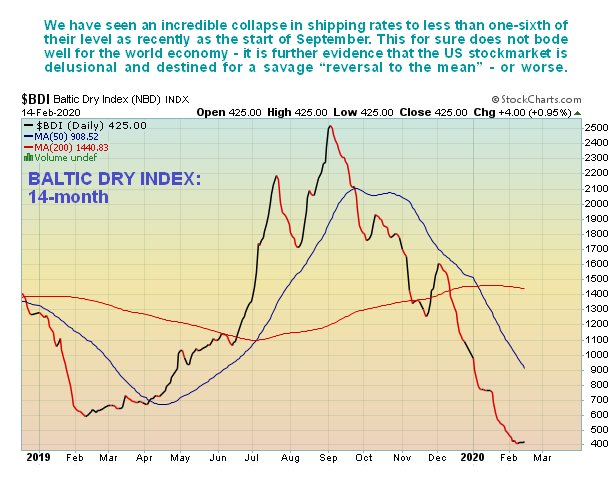
The first is the Baltic Dry index, which is the cost of shipping. On the 14-month chart for the BDI we see that, just since the start of September it has plummeted from 2500 to just above 400, meaning that the cost of shipping is just one-sixth of what it was about 5 months ago. That should tell you all you need to know about the state of world trade – just don’t expect Wall St to go pasting this chart up on sidewalk billboards.
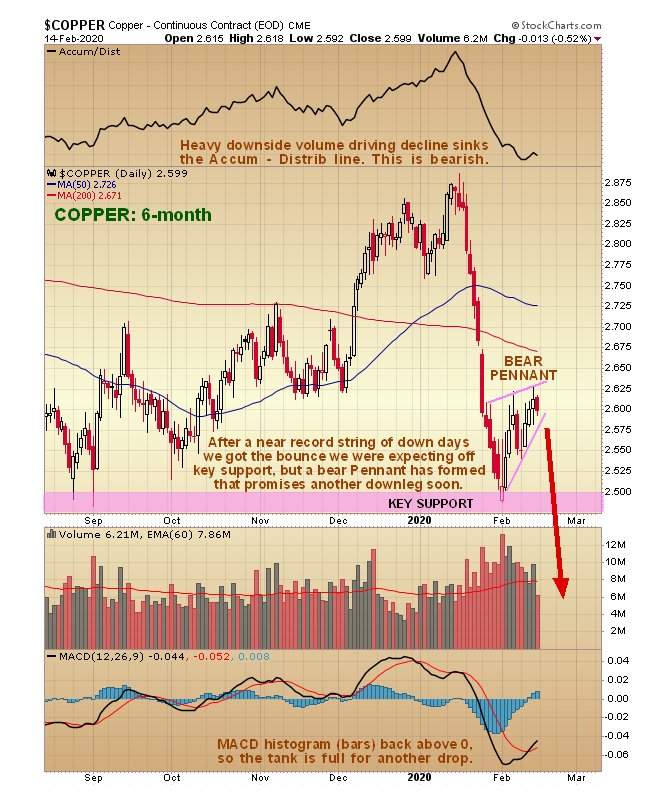
Next copper, which had an extraordinary string of 13 down days in a row on heavy volume a few weeks ago. This drop brought it down to an important support level in a deeply oversold state and
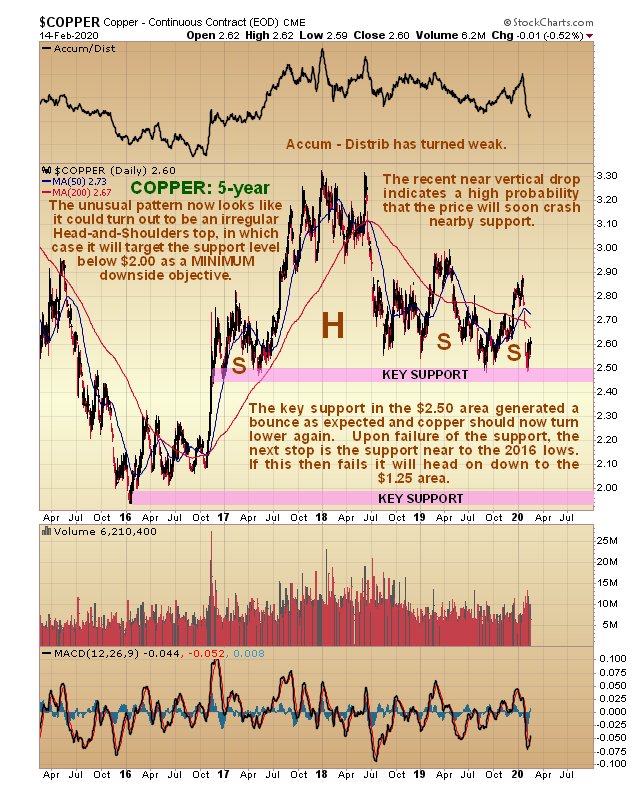
we looked for a weak rebound to alleviate this oversold condition, which has since occurred, but as we can see on its latest 6-month chart, the tight pattern that has formed looks like a bear Pennant, not an intermediate base, and if this interpretation is correct, then another severe downleg will begin soon that will see copper crack the key support and drop, probably steeply, to the next important support level below $2.00 that can be seen on the 5-year chart below. If this happens it will be very bad news for the global economy. Copper is not called Dr Copper for nothing – weakness in copper is frequently an early warning sign of an impending recession (in this case depression) which is why it so called.
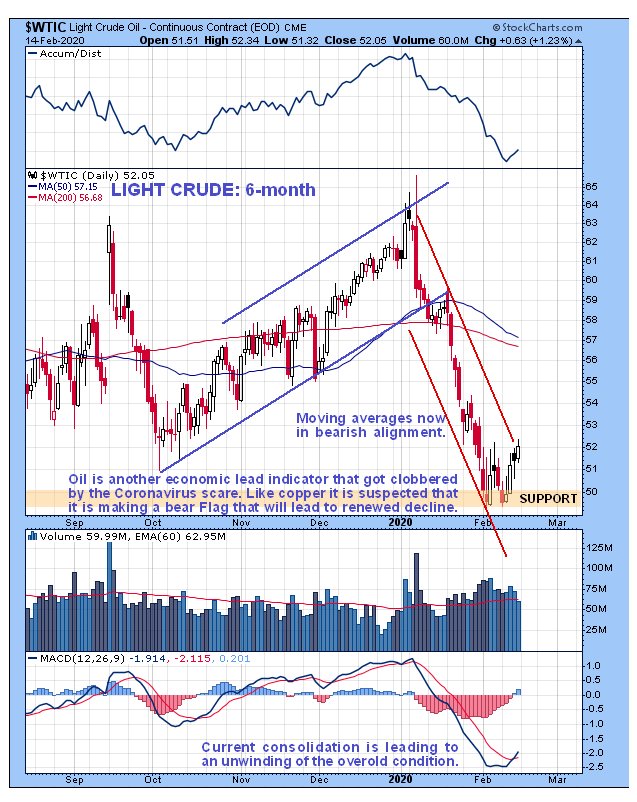
Another commodity signaling serious problems ahead is oil, which has dropped steeply within the same timeframe as copper, as we can we on the 6-month chart for Light Crude below, and it too is rallying feebly from an important support level to alleviate its oversold condition, but the pattern that has formed so far this month also looks like it will turn out to be a countertrend bear Flag / Pennant that will be followed by a drop to new lows.
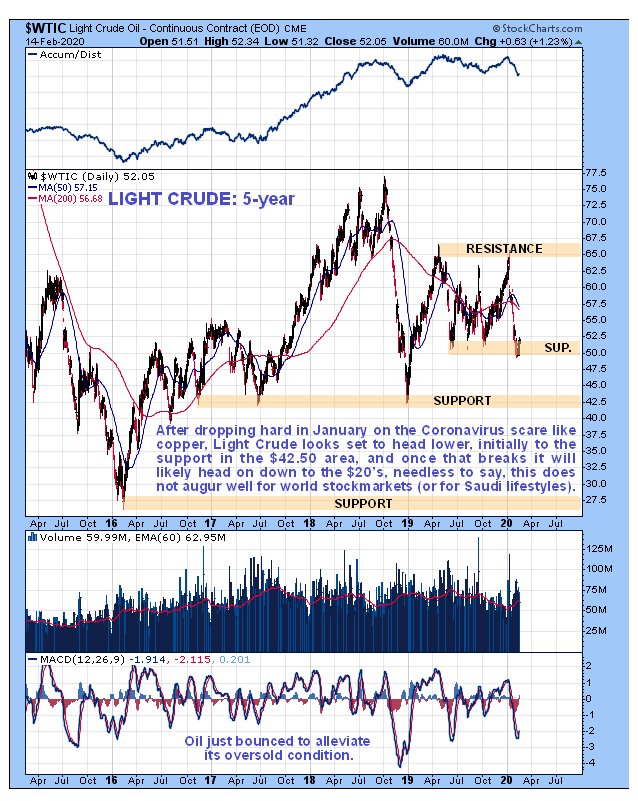
The 5-year chart enables to see where Light Crude is likely to go if it breaks below the nearby support just below $50. If this support is breached oil will target the next important support level at around $42.50, and if that fails, as we would expect it to in a crash scenario, then Light Crude is likely to find itself back in the high $20’s or even lower. Needless to say, such a scenario is likely to be accompanied by a severe decline in the stockmarket.
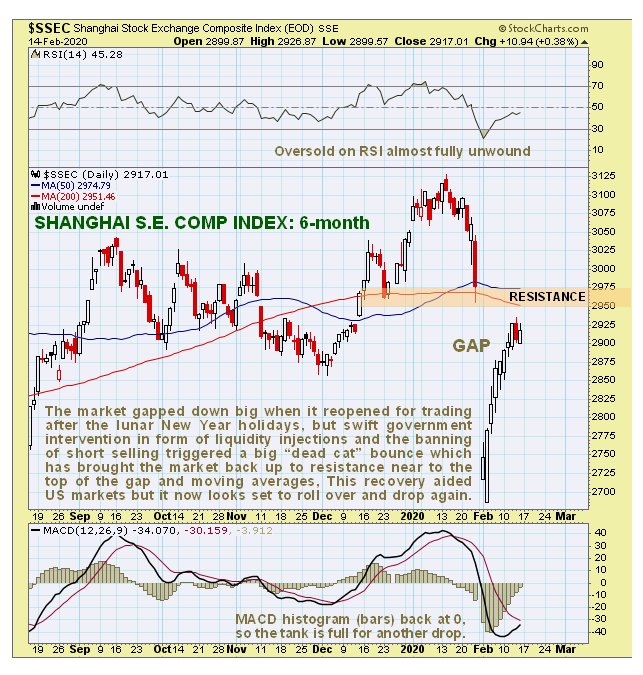
One reason that US stockmarkets have managed to stay elevated despite the looming severe problems, is the recovery in the Chinese stockmarket in recent weeks. On the 6-month chart for the Shanghai Composite index we can see that, following it opening with a big gap down after the end of the Chinese lunar New Year holidays it has made what at first sight looks like an impressive recovery due to the government pledging to pump billions into the market and also banning short-selling. However, on closer inspection this looks like nothing more than a “dead cat bounce” that has only succeeded in bringing the market up to resistance towards the top of the gap and close to its falling moving averages. If it now proceeds to roll over and drop again, this is likely to put pressure on lofty US markets.
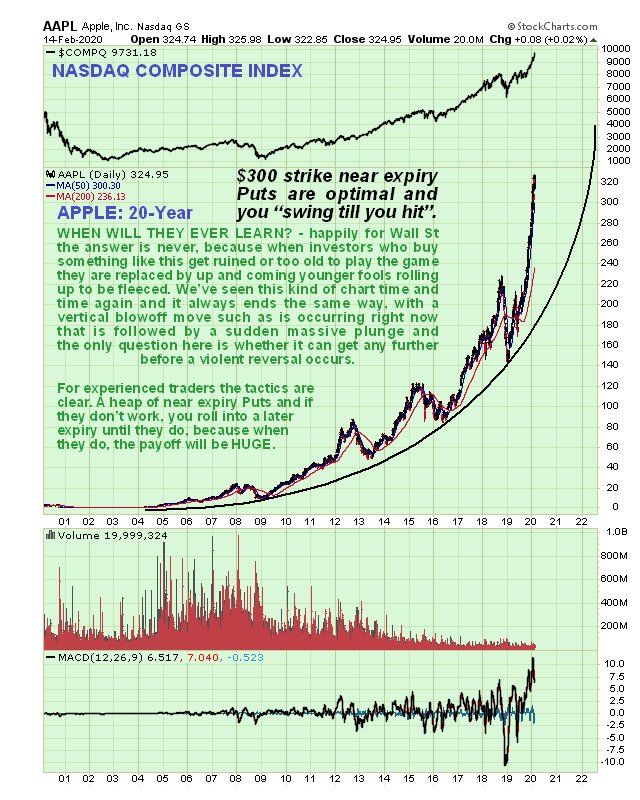
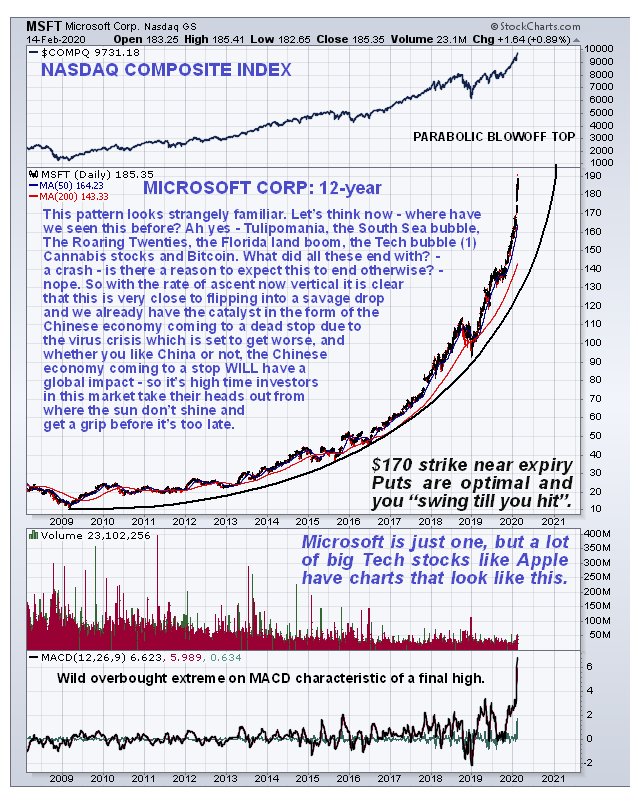
But if you want more compelling evidence that it’s 1 minute to 12 on the market clock, or more like 5 seconds to 12, then take at the following 2 long-term charts for Apple and Microsoft, which shows them ending their long parabolic bullmarkets with spectacular vertical blowoff tops. Could they go even higher before they crash and burn? – maybe, but the higher they go the greater the probability that they will suddenly flip to the downside, and the initial plunge is likely to be brutal. Many investors in these stocks up to now are not so stupid as one might think – they know the situation is unsustainable but are looking to sell to an even bigger idiot before the music stops – just make sure you are not around when it does because the exits will be instantly jammed solid.
It is very hard to believe that these stocks are at these levels, especially given Apple’s presence in China, and the fact that they are is viewed as an indication of a staggering complacency rooted in dire ignorance.
When you read and understand what is written in the articles
Cognitive Dissonance and
China is Disintegrating you should be able to comprehend that these stocks are very likely to crash and burn as the whole market
goes down like the Titanic.
Looking at the charts above, especially those for the Tech stocks Apple and Microsoft, it should be obvious that the vast majority of investors are now living in “cloud cuckoo land” oblivious to the catastrophic fallout that a dead stop of the Chinese economy will lead to, especially as the global debt situation was precarious before all these latest problems.
We will shortly be
looking at some Apple and Microsoft Puts on the site, with an awareness that they could make one last stab higher before they cave in. Close inspection of their 6-month charts turns up that they may make one final vertical run to new highs and even more overbought extremes before they are exhausted and reverse into a crash.
Posted at 4.10 pm EST on 15th February 20.