In this update on the broad stockmarket we are going to look at the remarkable similarities between the way the charts looks now and the way they looked in the run in to the 2008 market crash, but also highlight some major differences between then and now that must be taken into account.
Although I have done this before it is not an original idea. The similarities between now and 2008 at least with respect to how the charts look was made dramatically clear by a pair of charts that appeared on Twitter which Bob Moriarty included in his article
The Stock Market Crash Continues which was posted on his site 321gold on the 10th.
The reason that we are going to look at this more closely is that I am aware that sentiment readings are at wild oversold extremes – it would appear that
no-one is bullish. While there is good reason for this, with thousands dying from the vaccines and millions sickening and governments around the world sabotaging food production and supply chains, when you have a situation where no-one is bullish, it obviously means that there is no-one left to sell and so the slightest excuse, however superficial, can trigger a bounce that grows as a result of panic short-covering.
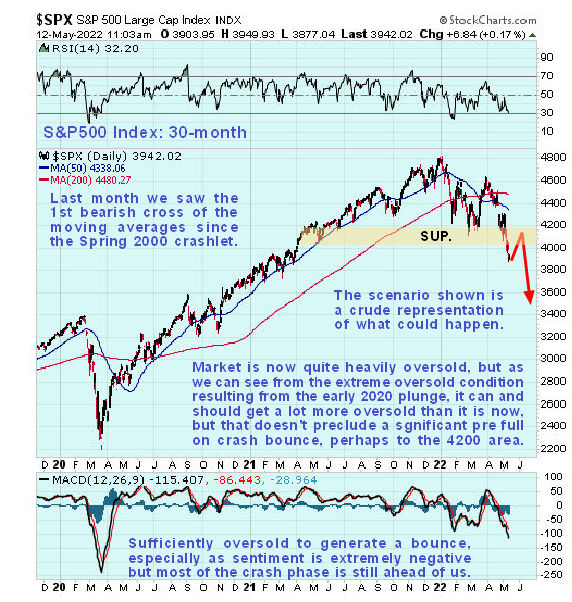
So let’s start by looking at the latest 30-month chart for the S&P500 index on which we see that, having breached key support, it has dropped hard to become heavily oversold, opening up a large gap with its 200-day moving average which is now rolling over and turning down. It looks like it could drop like a rock, but the sentiment extremes pointed out above suggest that instead some sort of self-feeding countertrend relief rally may happen first. The chart showing the lead in to the 2008 crash is stacked right below this chart for ease of comparison.
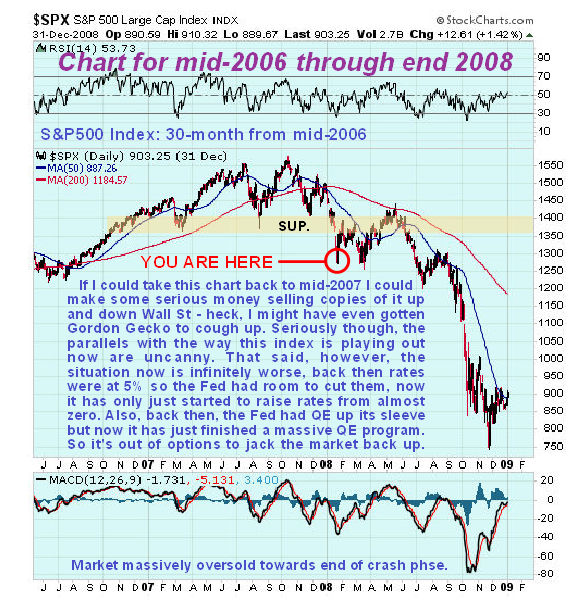
Now let’s look at the chart for about the same time period which shows the topping out process of the market in 2007 and the lead in to the 2008 crash. We can see that the market kind of rolled over into the crash back then – it took a while for it to gather steam. As you will see the charts look remarkably similar, although we cannot expect the exact same scenario this round for the simple reason that the fundamental outlook now is infinitely worse, not least because governments are actively seeking to sabotage their economies and kill their citizens using
bioweapons,
famine and
war in pursuit of the WEF’s Great Reset objectives.
Given the wildly negative sentiment extremes that we are now witnessing it could be that we are at a similar point now to the low that which occurred in early in 2008 that led to a countertrend rally back to the vicinity of the falling 200-day moving average. This is why this point on the earlier chart has been marked “YOU ARE HERE” although it must be emphasized that this is something of an educated guess.
If this supposition is correct – and it is a reasonable one given that everyone is now bearish – then some sort of countertrend rally is to be expected that could last some weeks. The hole in this theory of course is that the fundamentals are now infinitely worse than in 2008, and it is truly remarkable that the market has held up as long as it has, and the only reason it has is believed to be the Fed wading in with vast quantities of newly created money to prop it up. The biggest differences between now and 2008 are of course that the Fed has nothing left to fall back on. When the market went into the 2008 crash, rates were at 5% so the Fed could lower them significantly which acted as a crutch or prop, especially when assisted by the introduction of the 1st massive QE program. Now, with rates still at dismally low levels even after their recent rise off rock bottom, there is no room to lower them significantly, and having just finished a string of massive QE programs, the Fed is also nursing a bloated blance sheet, so more QE isn’t going to help, and will only further destroy its credibility. This means that there is nothing that can be done to save the stockmarket, not if the Fed wants to stop the much more important bond market from blowing up. What all this means is that, perhaps after a technical relief rally to ease the current oversold condition and sentiment extremes, the market is headed much, much lower. The practical implication of this is that, in addition to the bearish hedges and Puts that we have laid on in the recent past, if we do see any such countertrend rally, we can use it to lighten long positions selectively and also to add more short positions.
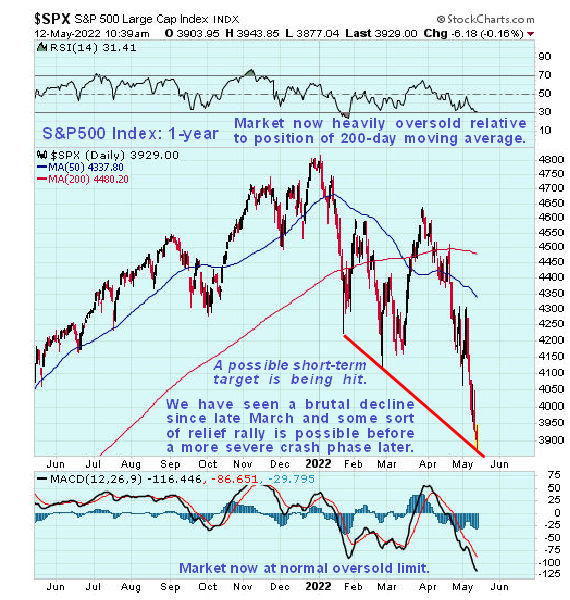
The 1-year chart for the S&P500 index shows recent action in more detail and the rather horrendous decline this year to date, that has consisted of 2 downwaves punctuated by a relief rally in March. The market is now heavily oversold relative to the position of its 200-day moving average and on its MACD, although as we saw on longer-term charts this can get a lot worse in an all-out crash situation. It is interesting observe that it is today hitting a downside target at the red treendline shown, so this might be a good point for aggressive traders to unload some short positions, especially Puts just in case we see a snapback rally shortly.
 IMPORTANT FOOTNOTE: anyone who bought the $390 and $380 Puts expiring on the 20th May that were originally recommended in the article of the 1st May should consider taking profits here, as the market is down heavily today and we might see a late trade rally.
 We are well up on these positions at the time of writing.
End of update.
Posted at 2.40 pm EDT on 12th May 22.