Whilst we know that EVs (Electric Vehicles) are being used as a “trojan horse” to eliminate private motoring for the masses altogether probably over the next 10 years or so with heavy subsidies being used initially to snare them into making the switch, when it comes to considering stocks to buy we have to be pragmatic, and this company, which is primarily a lithium explorer and developer, lithium being used in EV batteries, is certainly likely to be favored by powerful New World Order forces, and its stock looks poised to embark on a bullmarket soon, which is why we are interested in it. Global Battery Metals was highlighted in an email sent out before the open yesterday and was up on the day.
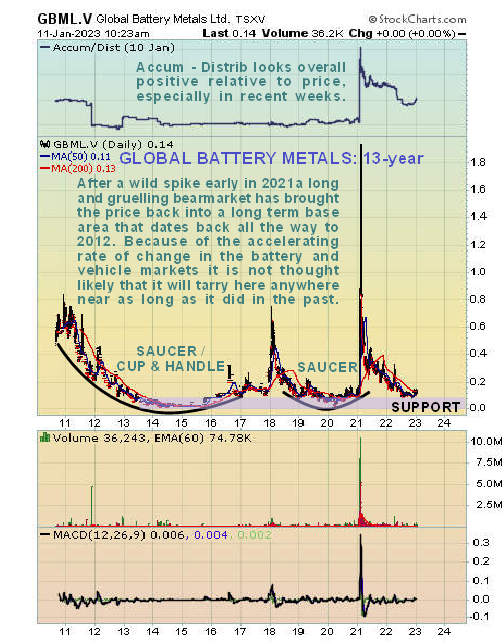
On its 13-year arithmetic chart we can see that, following a wild spike early in 2021, it went straight into a bearmarket that eventually ground down all the gains made by the spike as it gradually slumped back close to its lows and it now appears to be basing at strong support in this area. Could it stay stuck down here for a long time as it did in the past? – it’s possible but it doesn’t look likely because of the speed at which the accelerating transition is taking place in the world of motoring, a transition which, unknown to the hapless fools acquiring an EV, will eventually see them riding the bus or walking or cycling, if they are allowed out at all, that is.
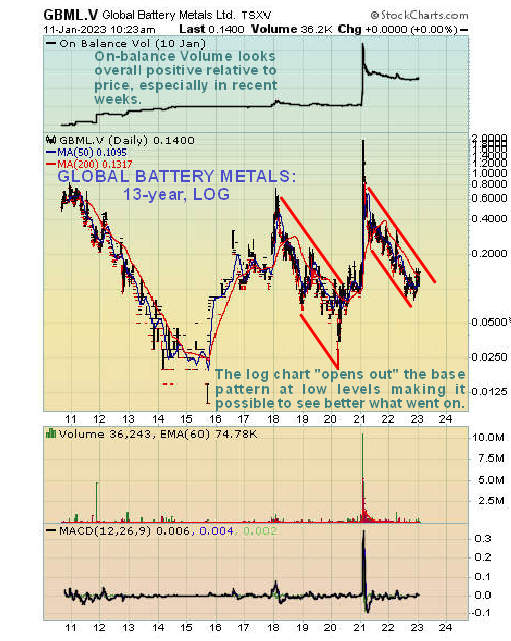
As a matter of curiosity it is interesting to compare the 13-year arithmetic chart with the 13-year log chart shown below. The log chart has the effect of opening out the base pattern so that we can see what happened at very low levels. Back in 2014 – 2015 we can see that it dropped to the miserable price of a little over 1 cent and it almost hit that price again during the Covid crash pan selloff early in 2020.
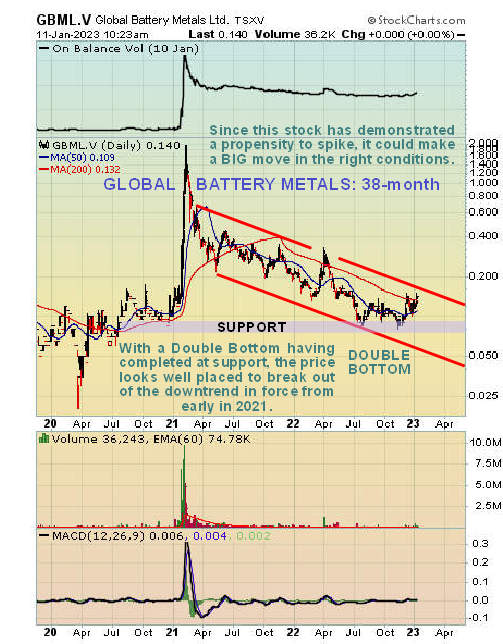
A 38-month (3-year 2-month) chart is interesting and useful as it enables us to see all the major moves in the stock over the past several years. First the “Covid crash” in the Spring of 2020, when the nurses in hospitals were practicing their dance routines, saw it plunge briefly to a very low level that approached the 2014 – 2015 lows. After recovering from that it had an enormous spike early in 2021 which I heard was due to some positive battery hysteria but after this spike it went into a long and gruelling downtrend that eventually resulted in it losing all of the gains it made during the spike. It hit bottom last July and then went on to build out a Double Bottom, the 2nd low of which occurred in October and took the price a shade below the July low and we will now proceed to look at this base pattern and recent action in much more detail on an 8-month chart.
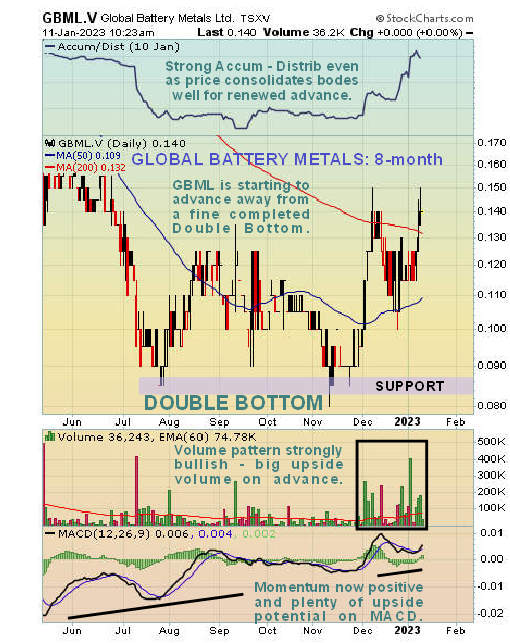
On the 8-month chart we can clearly see the fine Double Bottom that has built out in the stock in recent months. It rose sharply out of the 2nd low early in December to complete the pattern and it now appears to be in the process of breaking out of it with the sideways pattern since the early December runup providing time for the moving averages to converge and for more stock to change from weaker to stronger hands. Note the persistent strong upside volume since early December which is a very positive sign, especially as it has driven the Accumulation line higher in a robust manner and the way that it has continued to press higher so far this year suggests that the price will have little trouble in soon breaking above the line of resistance at the C$0.15 level. Lastly the MACD indicator shows that it is only a little overbought here and so it has plenty of immediate upside potential.
 In conclusion, Global Battery Metals is rated an immediate speculative buy here and especially on any near-term minor dips, which could as it is close to resistance.
 The stock trades in adequate volumes on the US OTC market.
Global Battery Metals
website
Global Battery Metals, GBML.V, REZZF on OTC, trading at C$0.14, $0.104 at 11. 00 am EST on 11th January 23.
Posted at 12.30 pm EST on 11th January 23.