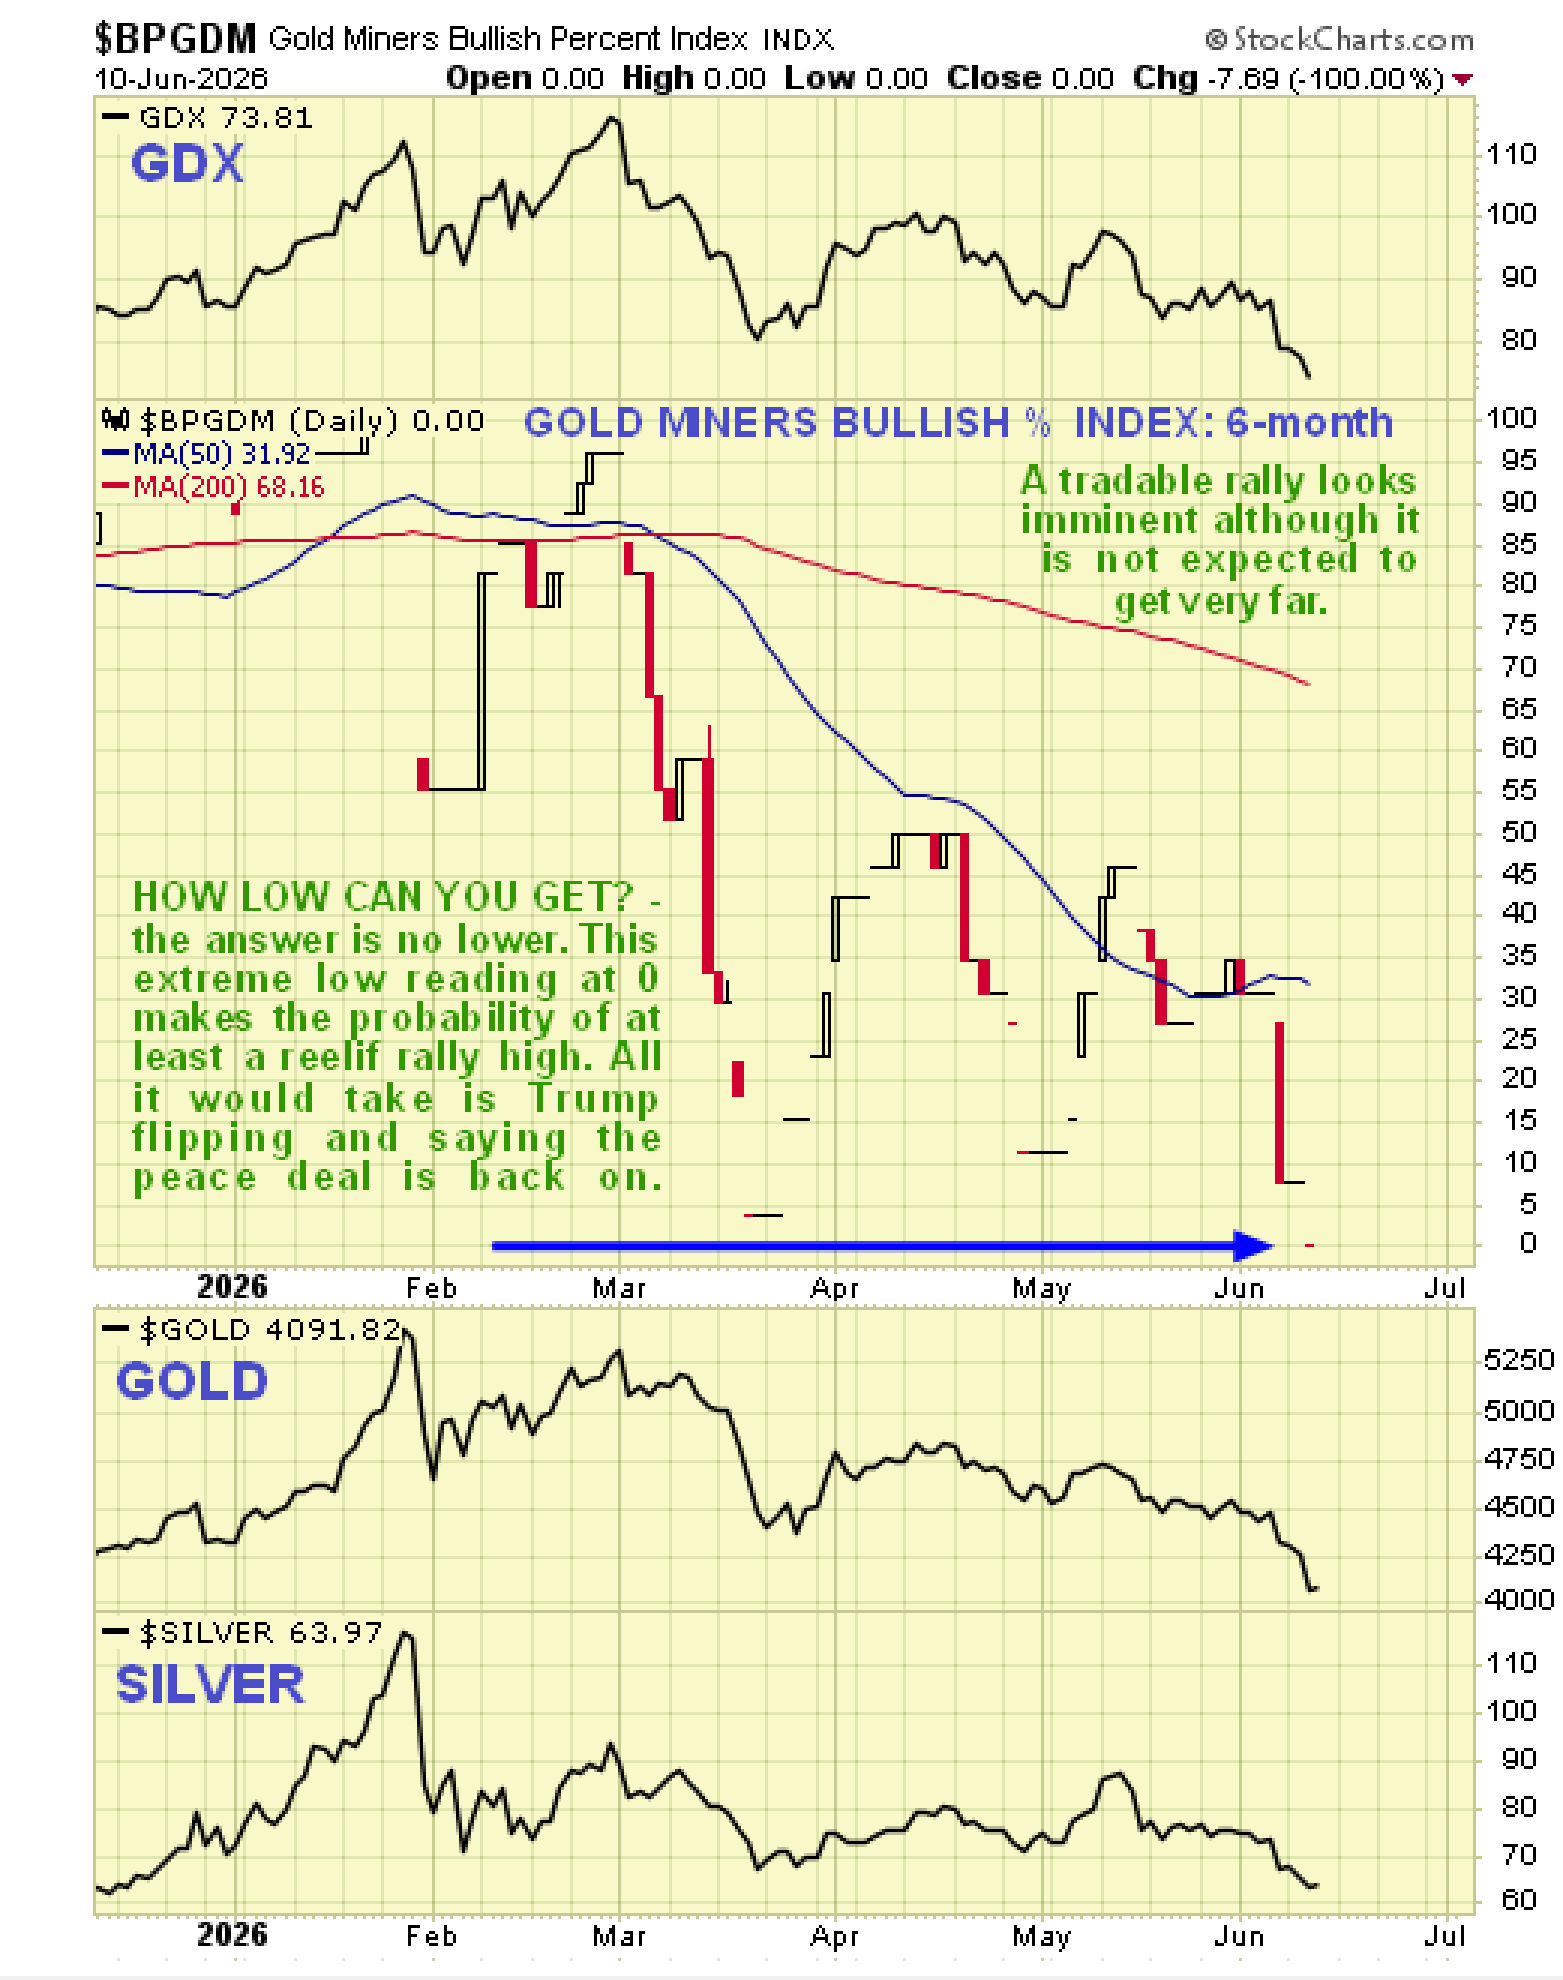
The reason for this update is that we have a truly remarkable situation where the last reading for the Gold Miners’ Bullish % Index is 0%. This means that, assuming the data is correct (it wasn’t when I was told it was a 0% a couple of trading days ago – it was later revised upwards to about 8%, still a very low figure), NOBODY is bullish on the sector, and that of course has very bullish implications. However, that doesn’t mean the sector won’t fall further, but it at least makes a significant near-term bounce highly likely – remember when all the mugs were piling into the sector at the end of January? – the reading was 100% bullish then which meant that everyone was on board, small wonder then that it did an about face and plunged.
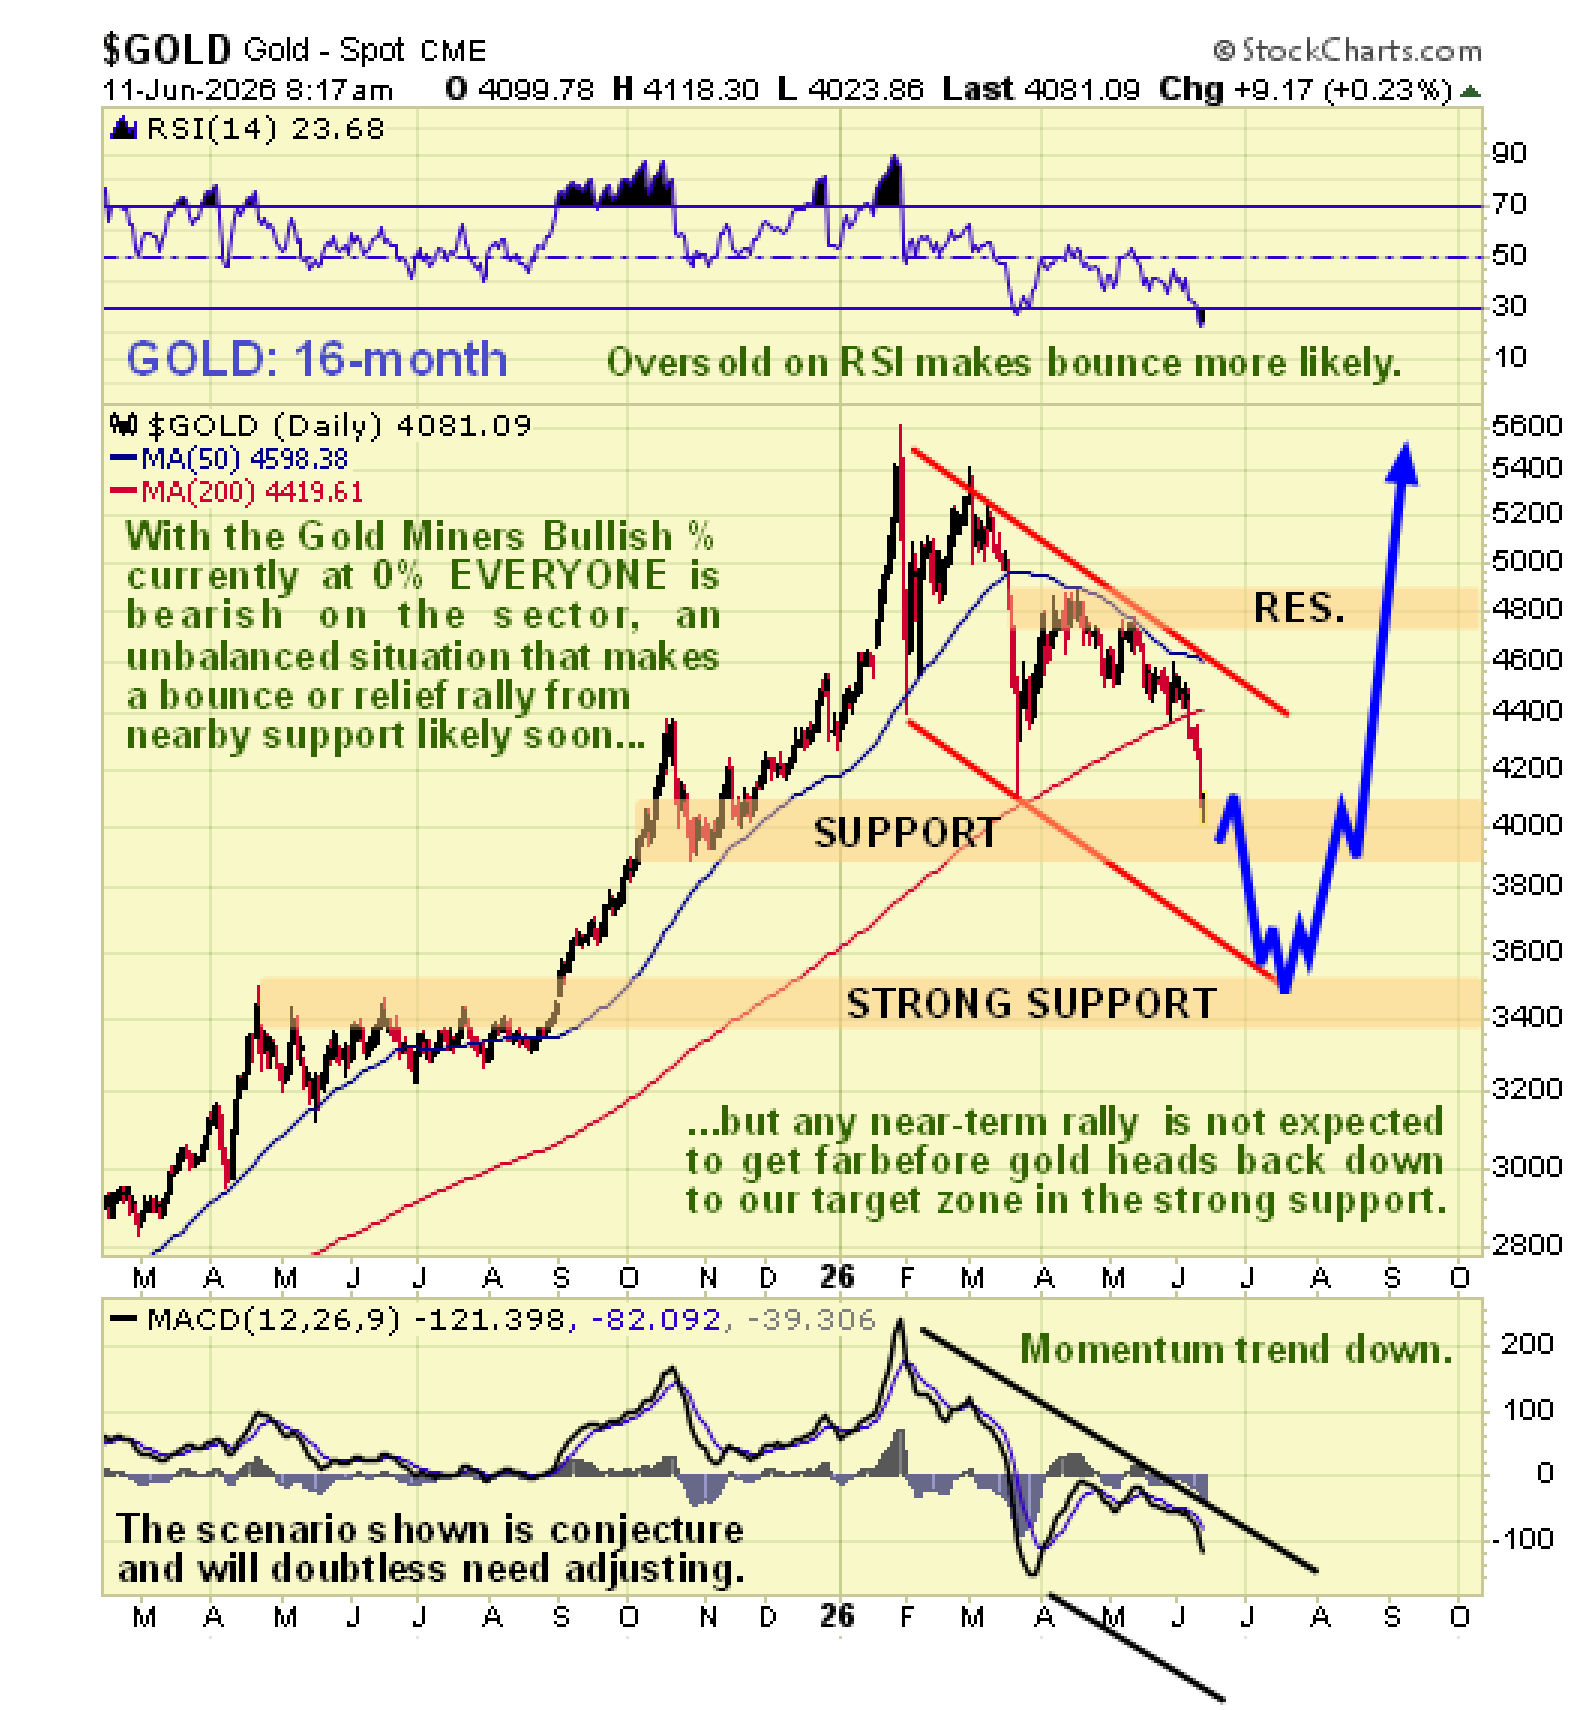
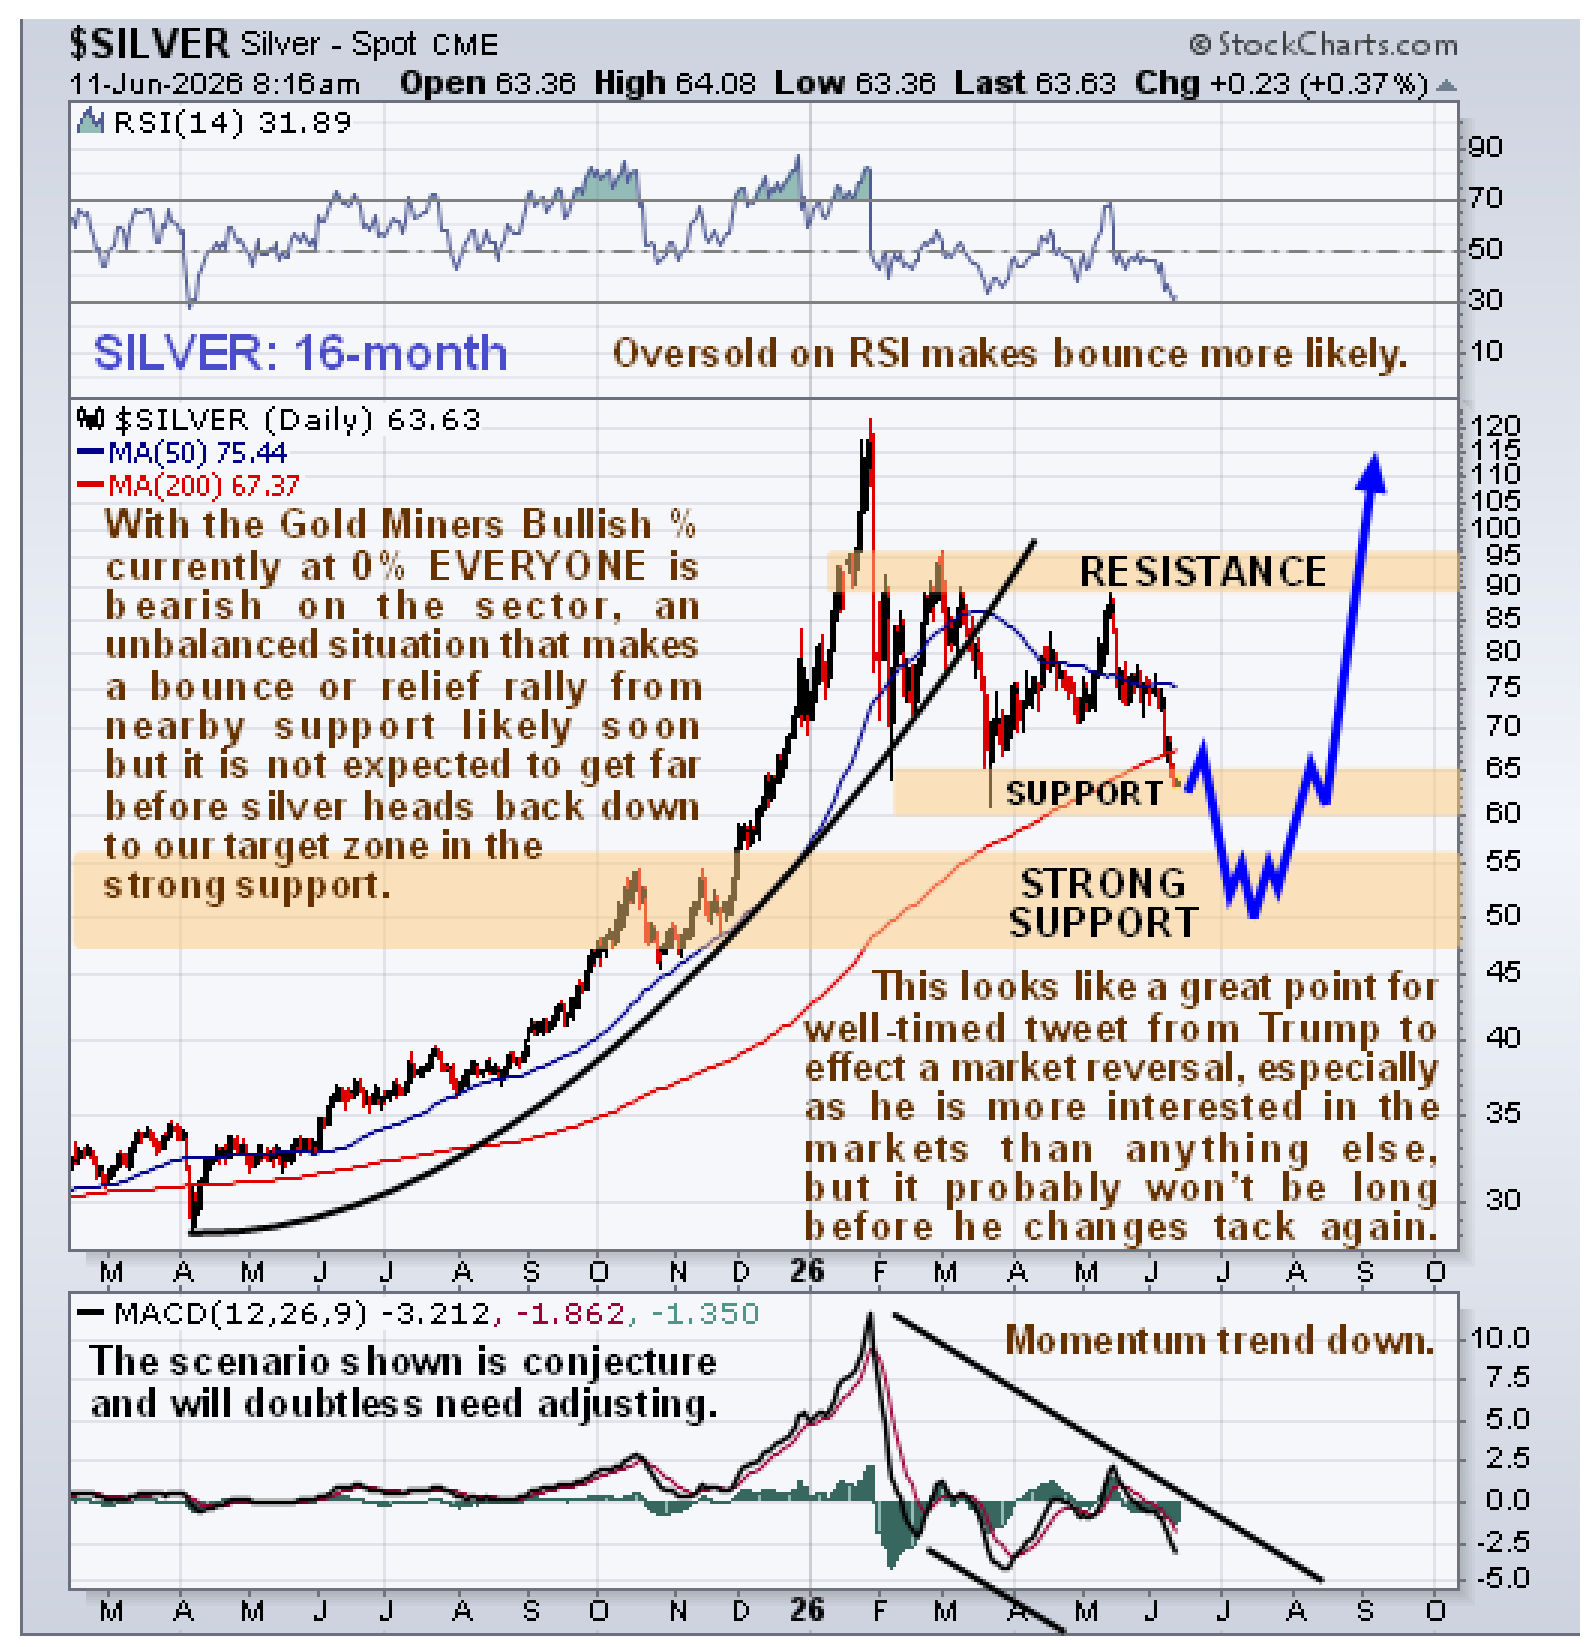
Of course, the reason that the sector – and markets generally – have been so weak in recent days has been the resurgence of hostilities between Iran and the US, but given that Trump and his cronies are more concerned about market moves than the fate of the Mid-East, the odds are considered high that he will work the levers in the opposite direction soon and generate a relief rally. However, that is unlikely to derail our scenario of a probable drop by gold to the $3500 area and silver to the $48 - $55 zone, as the levers could be pulled back in the opposite direction again before long.
So now we will quickly run through the charts to see what’s going on, and we’ll start with the Gold Miners’ Bullish % Index because of the implications of its current extreme reading. The current figure of 0% means that EVERYONE is bearish and that obviously makes a relief rally likely at the least. What is expected to happen is a relief rally to drive this back up before renewed decline takes gold and silver to our downside targets where we aim to buy across the board.
On gold’s 16-month chart we see that it is at a good point to bounce as it is short-term oversold (RSI) at an important support level…
Ditto silver where the support at this level is rather more pronounced….
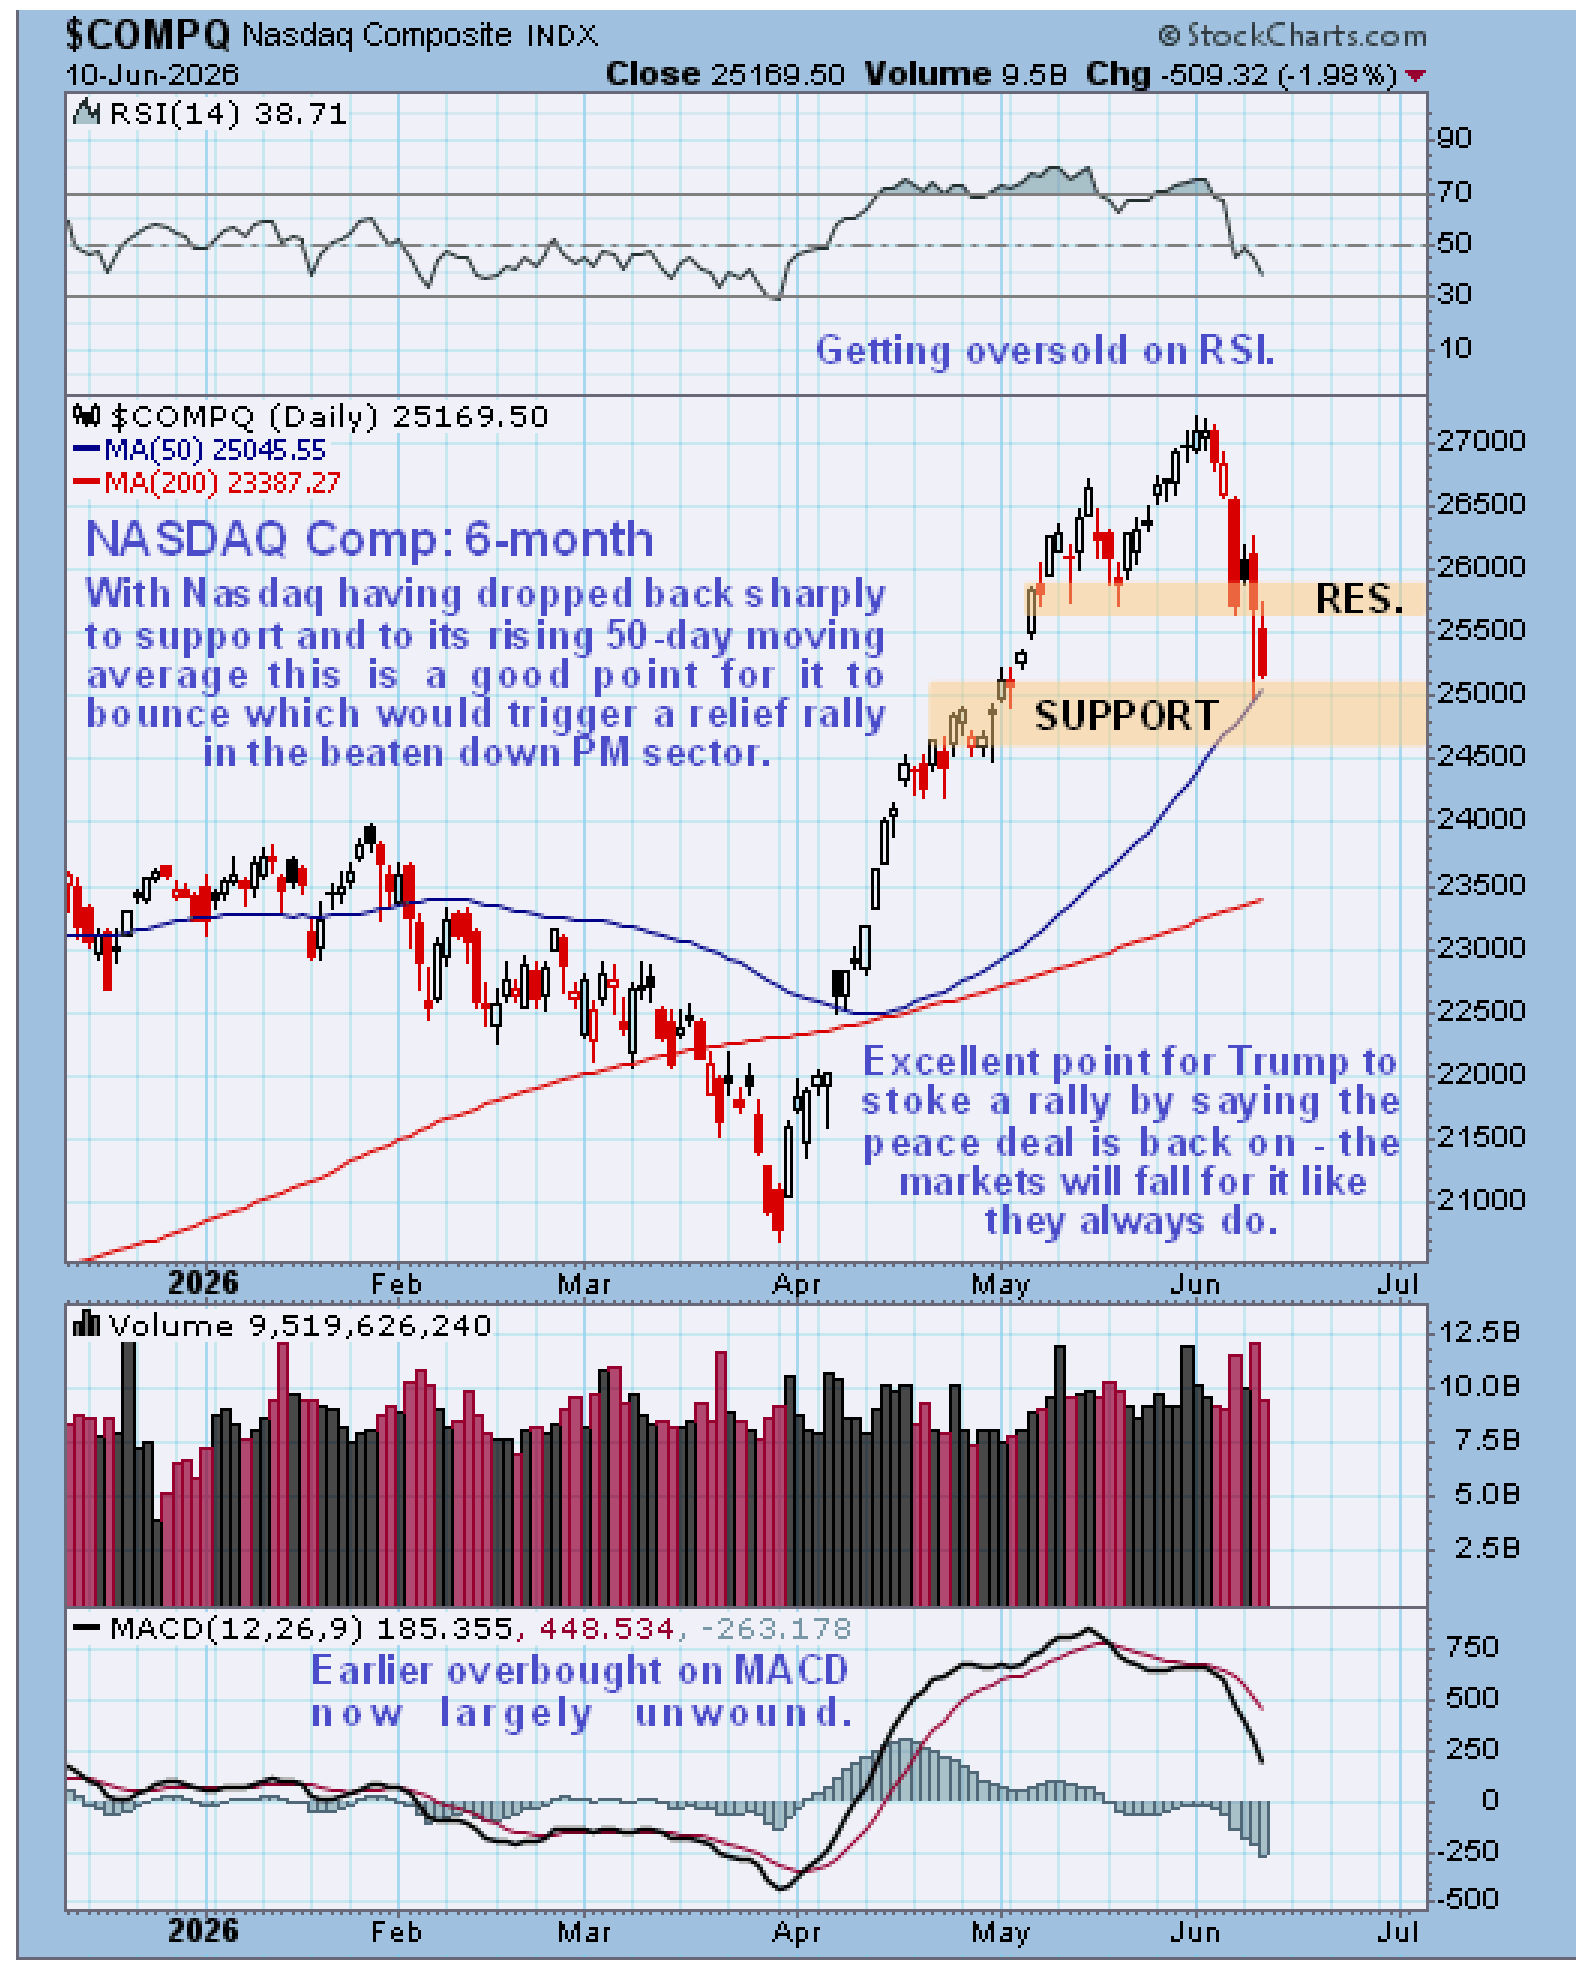
The broad market has been somewhat rattled too by recent developments and we can see that in recent days it has dropped back towards support and close to its rising 50-day moving average – a good point to cease hostilities temporarily and say that “The Deal” is back on – the market will fall for it of course as it always does and perhaps “jump for joy” temporarily, and that will get everything moving higher again including the beaten down PM sector…
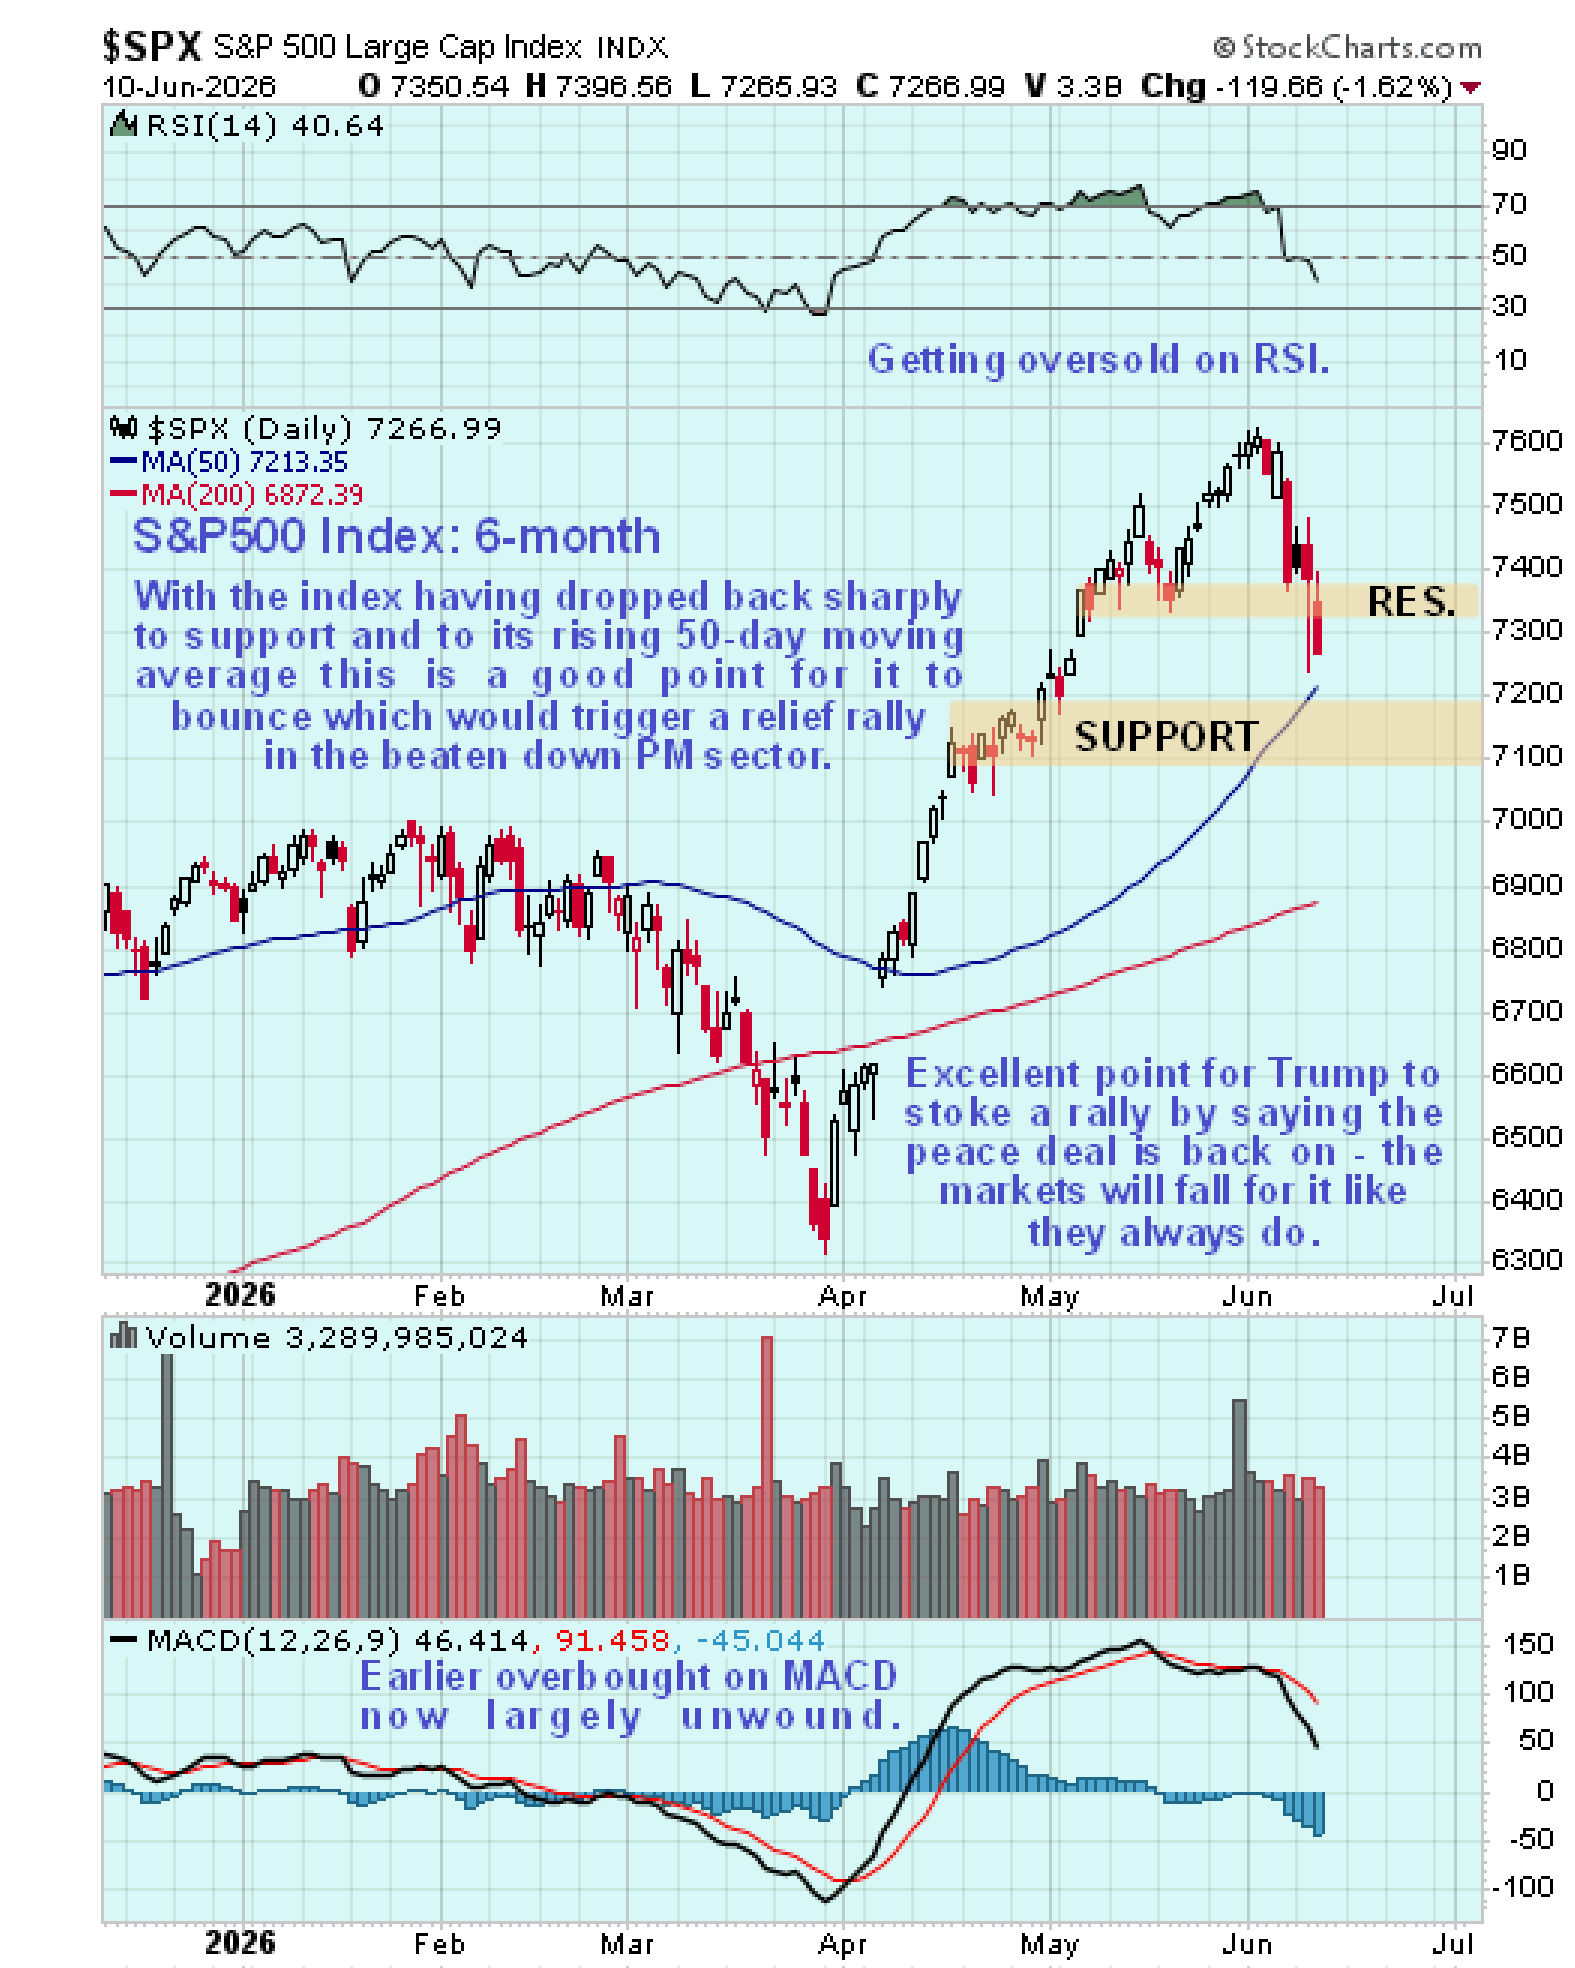
The chart for the Nasdaq Composite looks almost identical to the chart for the S&P500 index which is thought to be because the Tech sector is what’s holding up the entire market especially AI, and AI is now a bubble just waiting to be burst and things could get ugly fast when it does and due to time constraints we aren’t even looking at the threatening bond market meltdown…
 So the conclusion is that we may be about to see an across the board tradable relief rally that will include the PM sector, but it will probably be short-lived before the decline resumes.
End of update.
Posted at 10.00 am EDT on 11th June 26.