It’s not often you see so many technical indications converge to signal the end of a strong uptrend, as is currently the case with Reliq Health Technologies, and because the chart presents so many examples of different technical phenomena, it is regarded as a very useful one for students of Technical Analysis, and before going any further it should be made clear that this is not idle abstraction –
we sold this stock on Friday for a further 50% gain in just over a week on clivemaund.com
To the uninitiated it might well look like there is no stopping this stock because it has been accelerating to the upside in a parabolic ramp, right up to now, but as we will now see on the latest 4-month chart, the complete opposite is the case, because there are almost as many warning lights flashing on this chart as there are lights on the Rockefeller Center Christmas Tree.
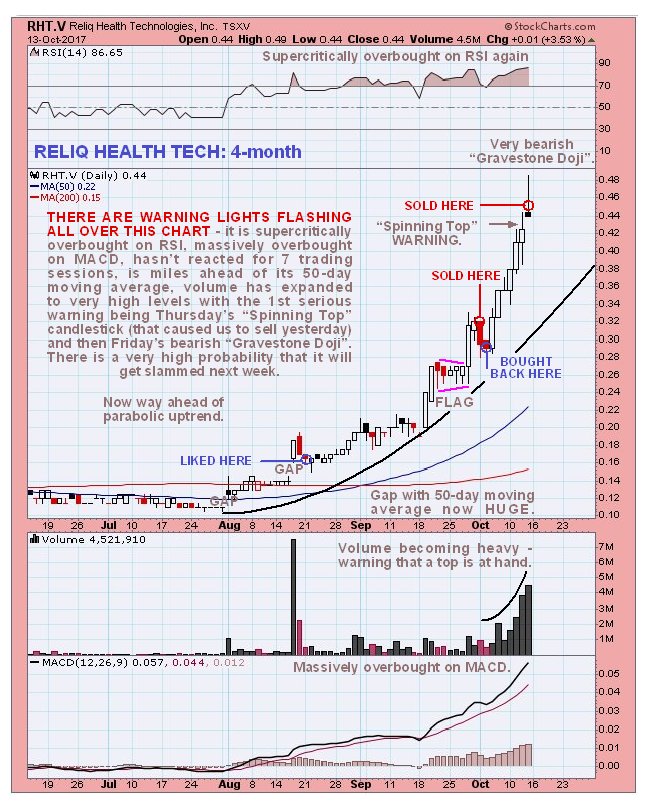
First off, it is supercritically overbought on its RSI indicator, yet again, which at the least calls for a pause to consolidate, but in addition it is massively overbought on its somewhat longer-term MACD indicator. Next it has opened up a huge gap with its 50-day moving average, and even a big gap with its accelerating parabolic uptrend. As if this wasn’t enough a couple of bearish candlesticks appeared late last week on very high volume. The first of these, on Thursday, was a “Spinning Top” which shows bulls struggling to maintain upward momentum in the face of increased selling. This was our warning to get out, which we did yesterday morning soon after the open. Incredibly, after we sold, the price continued to rise, so that we watched it mouths agape, but then, by the end of the day, it sunk back to near the opening price on very heavy volume, leaving behind a very bearish “Gravestone Doji” which vindicated our decision to sell. This and the “Spinning Top” the day before are regarded as the clearest possible signal of a reversal, especially given the other factors in play described above. Steve Nison, in his classic book “Japanese Candlestick Charting” has this to say about the Gravestone Doji – “The gravestone’s forte is in calling tops. The shape of the gravestone doji makes its name appropriate. As we have discussed, many of the Japanese technical terms are based on military analogies. In Japanese candlestick literature it is said that the gravestone doji represents the gravestone of the bulls that have died defending their territory.” When we factor in the appearance of this candlestick in this position on Friday with all of the factors we have observed above, it looks like the bulls are about to be slaughtered.
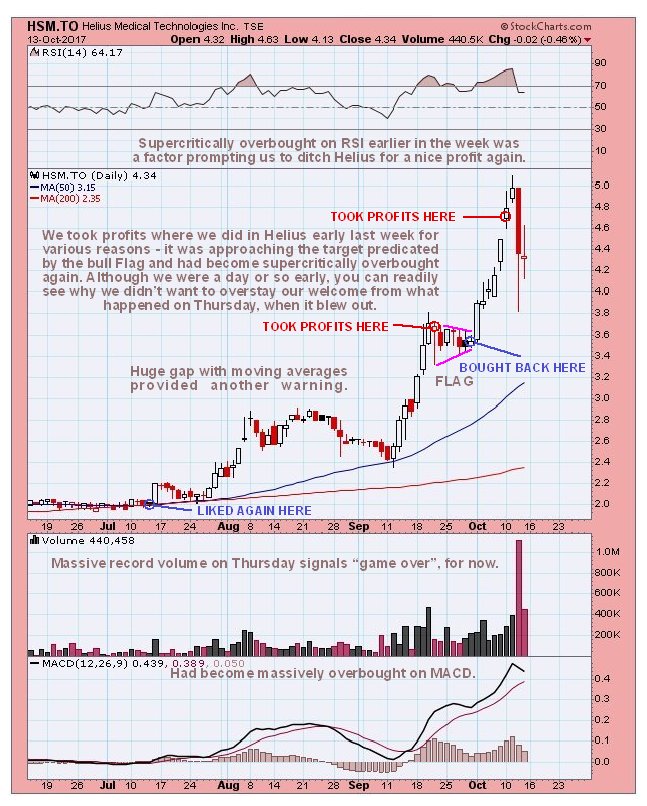
When you understand how to weigh up the various factors that converge to increase the chances of a reversal occurring, you know what to look out for and it gets easier with experience. Here’s another one that we sold for a significant gain a couple of days before it blew out on Thursday last week…
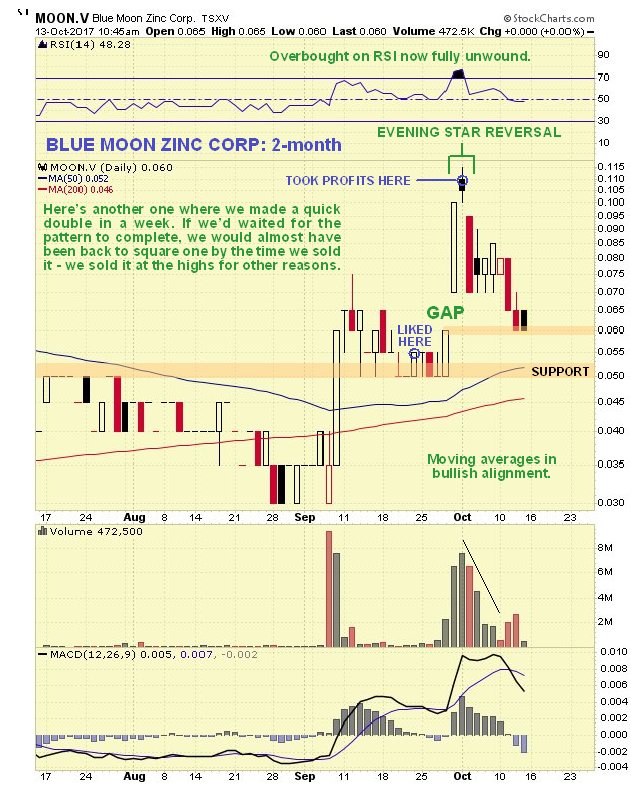
The following one worked out as a quick trade. It furnishes a good example of an “Evening Star” reversal. Had we waited for the 3-candle pattern to complete before selling, we would have lost most of our gains, instead we sold at the top for a 100% gain in a week (ex. costs and spread) for other reasons. This reversal pattern is not thought to have major significance…
So you see, these chart patterns do work, and understanding them can make a big difference to your performance. They don’t work all the time of course, because they indicate probabilities, since they depend on underlying fundamentals which can sometimes change dramatically, and applying them is a matter of interpretation and experience.
End of review.
Posted at 4.40 pm EDT on 15th October 17.