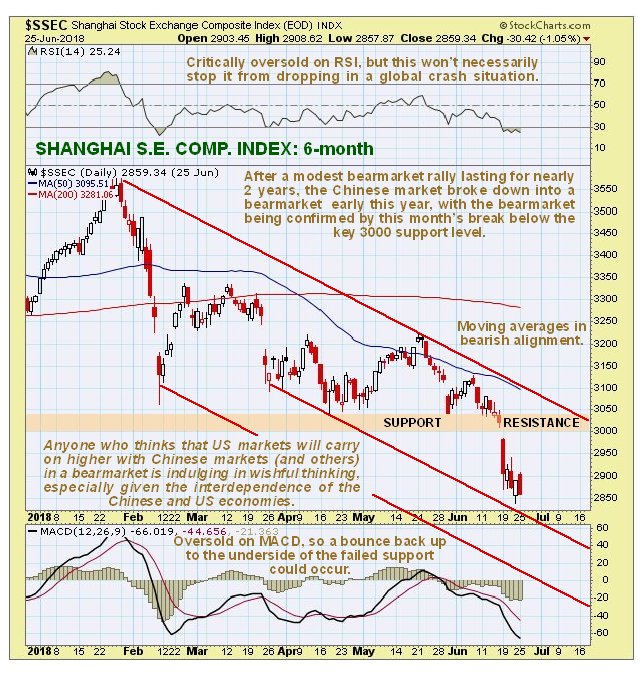
If there were any doubts that the Chinese stockmarket had entered a bearmarket, these were dispelled by the breach of key support at 3000 and plunge last week, which we can see to advantage on the 6-month chart for the Shanghai Composite index shown below. A tentative downtrend channel is drawn on this chart, but it is important to note that this drop could rapidly gather momentum and get a lot steeper now that the key 3000 level has been breached, making the channel shown obsolete, for reasons that become clear on the 5-year chart. For now, it is oversold on both its RSI and MACD indicators and close to trendline support, so we may see a bounce, although any such bounce is unlikely to get far before the decline resumes.
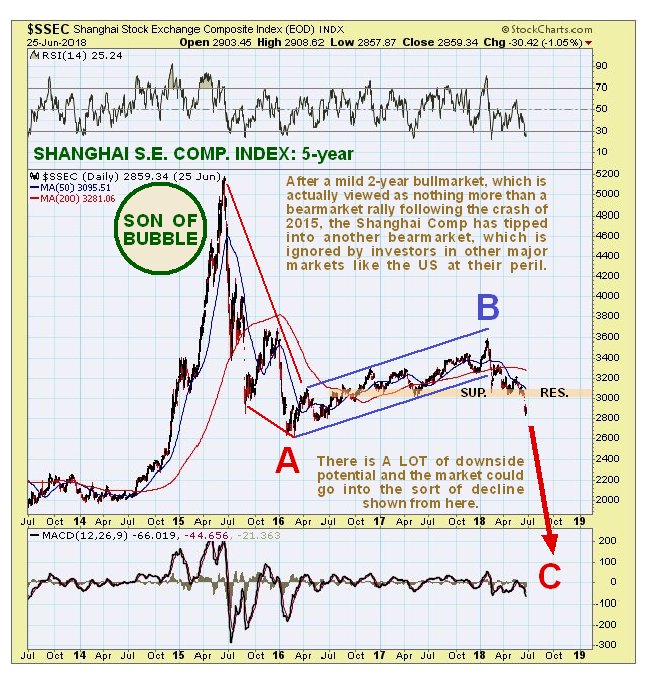
Just where the Chinese market is in its lifecycle becomes clear when we look at a 5-year chart, on which we can see the “Son of Bubble” rally of 2014 – 2015, which was largely caused by naïve investors hoping for a repeat of the monstrous spectacular bubble of 2006 and 2007, which will go down in the annals of Chinese investing history, and which we label “Big Daddy Bubble” on the 20-year chart further down the page. Full marks to them – they almost succeeded in creating a self-fulfilling prophecy, as Son nearly grew up to be as big as his Dad. After Son of Bubble burst a much weaker attempt to get it going again, which of course was partly an unwinding of an oversold condition, resulted in the relatively mild protracted bearmarket rally that unfolded from early 2016 through early this year. Then the rot set in again and a bearmarket downleg started, with it being fully confirmed by last week’s breakdown below key support at 3000. The entire pattern from mid-2015 is considered to be a larger order 3-wave bearmarket, with the 3rd C-wave just starting, that promises to be really severe, given collapsing markets elsewhere and the intensifying trade war. A potential path for this bearmarket is shown, although this is an approximation and shouldn’t be taken too literally.
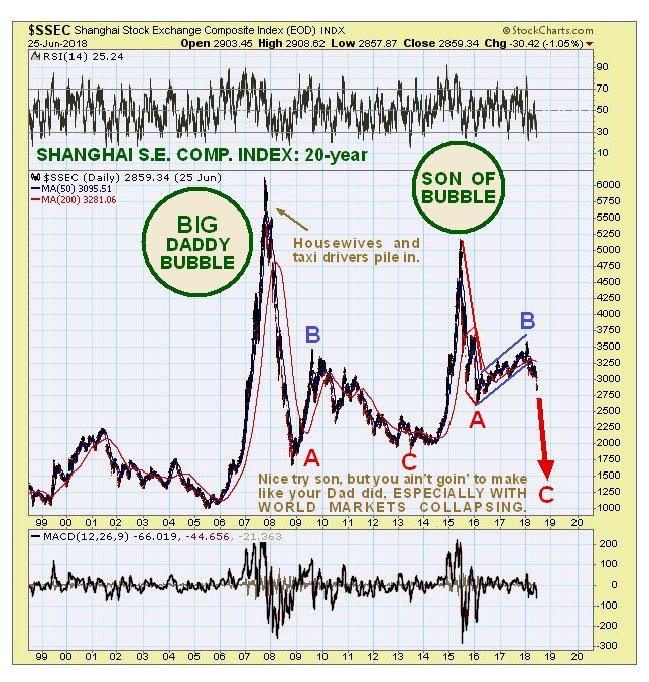
The long-term 20-year chart enables us to directly compare Son of Bubble to his Dad, Big Daddy Bubble, who was one big geezer and a helluva hard act to follow, but we must give credit where it is due for his valiant attempts to follow in his father’s footsteps – he very nearly made it to his stature, and it’s not often you see that. In the old days, especially in the US, you would often see shop fronts with names like Laurel & Son or Hardy & Son. The Dad did the work building up a business from scratch, and the easiest thing for the son to do was to carry on doing the same thing, rather than strike out on his own, but invariably the spark was gone, as in the sorry case of George W Bush following on from George H W Bush, but sometimes it worked and the son was a worthy successor, a notable example being Michael Douglas who followed his father Kirk Douglas into acting, and made a very good job of it, as in his 1992 film Falling Down. Back to the chart, there is considered to be a high probability that the Shanghai Comp will collapse back near to the sort of levels that it was at before the 2006 – 2007 ramp, especially given the background of imminent collapse of most world markets due to the intensifying debt crisis.
A big reason for the growing weakness of the Chinese market is of course the prospect of a worsening trade war, but trade wars are not a one-way street, there are no winners – everybody loses, and that will certainly include the instigators of the trade wars, the US. They are the product of desperation, and while they may please a few coal miners and steel workers in the rust belt of the US, their minimal beneficial effect will be much more than offset by their negative impact. US investors had therefore better take heed of the worsening Chinese markets as another indication of what lies in store for US markets, which are expected to follow suit.
End of update.
Posted at 1.00 pm EDT on 26th June 18.