The purpose of this update is to provide perspective with respect to where we stand in the crash phase of the market cycle, which can be achieved using a 3-year chart for the S&P500 index. As ever this is not idle academic musing but valuable intelligence that should assist us in staying on the right side of the trade and to know where this crash phase is most likely to end.
First, let’s take a quick look at the chart from the 26th February Crash Update, where it was made plain what would be likely to happen if the S&P500 index breached the support in the 3000 area…
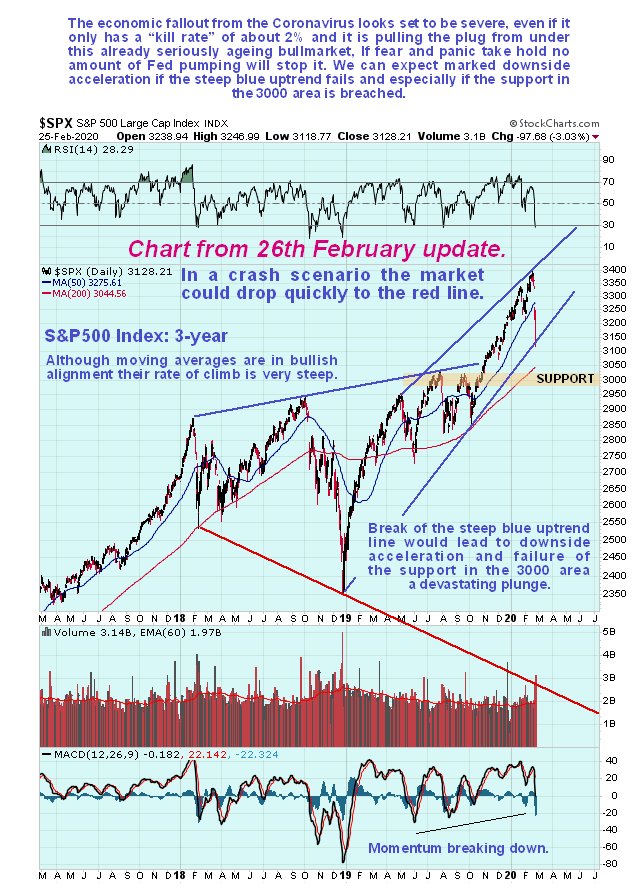
That interpretation turned out to be prescient, for when we look at the latest 3-year chart we see that the market has indeed plunged following failure of the 3000 level, with the Saudi despot stepping up to the plate at the weekend to fulfill his destined role as the guy who caused the oil market to implode.
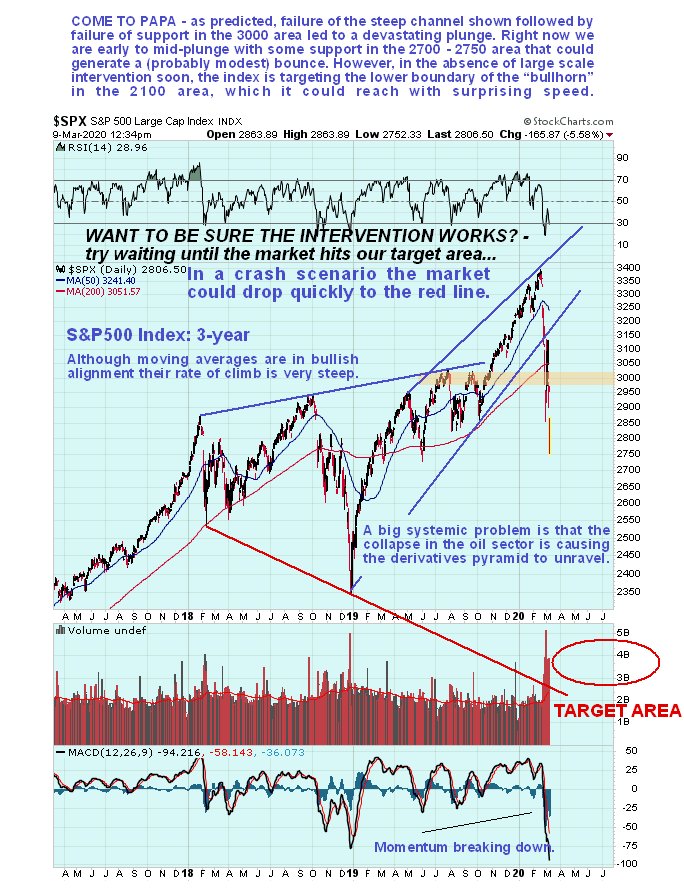
Although there is some support in the 2700 – 2750 area that could trigger some sort of bounce, this chart suggests that the market is still early to mid-crash, with a strong possibility that it will continue to crater until it reaches our target zone at the lower boundary of the bearish Bullhorn formation in the 2100 area. These Broadening Formations are bearish, and the only reason that the market staged a false break out of the top of it was the Fed shenanigans propping up the repo market. The giant pattern shown on this chart demonstrates that the current crash and mayhem was already “baked in” a long time ago and that the whole thing was a monstrous bubble in search of a pin which duly appeared in the form of the coronavirus crisis. Now we are in the retreat phase which is likely to be extraordinarily severe given the magnitude of the everything bubble that was pumped up using debt, derivatives and leverage on an unprecedented scale. This is why it is thought that emergency measures intended to stop this broad based collapse are doomed to failure, which are rather like turning up at the 3 Gorges Dam after it has been severely breached with a bunch of cement mixers trying to piece it together gain – good luck with that!
End of update.
Posted at 12.30 pm EST on 9th March 20.