I want to draw your attention to your silver at this time because, after its latest drop, it looks ridiculously cheap. Both gold and silver have been artificially suppressed for years on Western markets, but more eastern powers like China and Russia, who instinctively understand the intrinsic value of Precious Metals especially as the latest fiat experiment approaches its nemesis, have steadily built up their reserves and they have been taking advantage of recent low prices to mop up remaining supplies. The result of this has been a shift in the balance of power from West to East to the extent that the BRICS are now creating a new reserve currency and Russia is proposing a new international standard for trading PMs. The corruption of Western metals markets has invalidated their legitimacy, a recent scandalous example being the LME bailing out a huge Chinese short trader of nickel, to the disadvantage of the longs who without this intervention would have made the correct call. Many metals traders have had enough of this sort of thing and will be upping sticks and moving east as soon as China and Russia make it possible to do so. Already, vast amounts of gold and silver have been withdrawn off the London Metals Exchange. The point is that when these Eastern metals markets become fully effective, the attempts to suppress the prices of gold and silver by Western governments and interests, which are believed to be to prevent investors from being able to preserve their wealth, will no longer be effective, and so gold and silver will find their fair value, which already happens to be at much higher prices than they are at now. Given all the developments now in train this could be months away rather years. So let’s now take a look at some charts to see why silver in particular looks like such great value here.
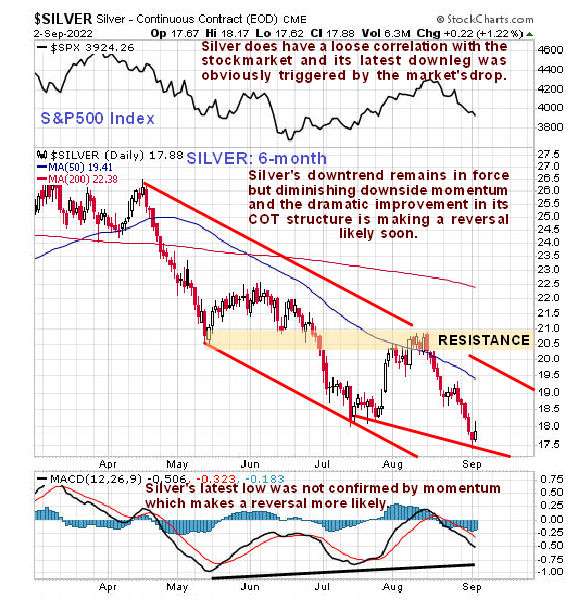
On the 6-month chart we can see the downtrend in force in silver from mid-April. In a Silver Market update posted in the middle of July the opinion was expressed that silver would turn up following a severe decline. It did, but after rallying to resistance in the vicinity of its May low it turned down and dropped again and last week it made a new low for this downtrend, although not by much. One important point that we can observe on this chart, because the S&P500 index is at the top of it, is that this latest decline was in lockstep with the decline in the broad stockmarket, which of course means that if the broad stockmarket really does tank it will probably take silver down with it. On the positive side this downtrend is looking like it may have run its course for several reasons. One is the decrease in downside momentum – the new low was confirmed by a new low in the MACD indicator, and the now much more positive COT chart, which we will look at after examining the 13-year chart. Lastly a somewhat bullish looking inverted hammer candle formed on Friday on good volume, which may lead to a rally.
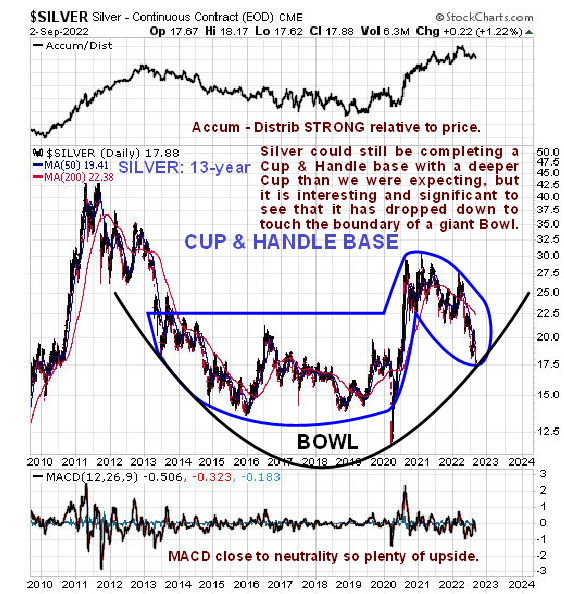
Some of you may recall that we had earlier thought that silver would hold the support in the $21.00 - $22.00 zone near to the lower boundary of the trading range that formed from mid-2020 through the end of last year, the reason being that this trading range looked like the “Handle” of a Cup & Handle base, but the support failed leading to this year’s downtrend, as we can see on the 13-year chart below. The Cup & Handle theory may yet be correct if we change the shape of the Handle of the pattern so that it becomes droopy, as drawn on the chart, but what is perhaps more interesting here from a symmetry and timing point of view is that the price has now dropped to touch exactly the giant Bowl pattern added to the chart. You may also recall that we had earlier dismissed the March 2020 spike lower as a freak Covid move, but what is a little uncanny is that the parabolic Bowl pattern drawn exactly under this low when produced also goes exactly below where the price is now. This gives us further grounds to believe that silver may have hit bottom last week, and if it turns up here we may never see such low prices again.
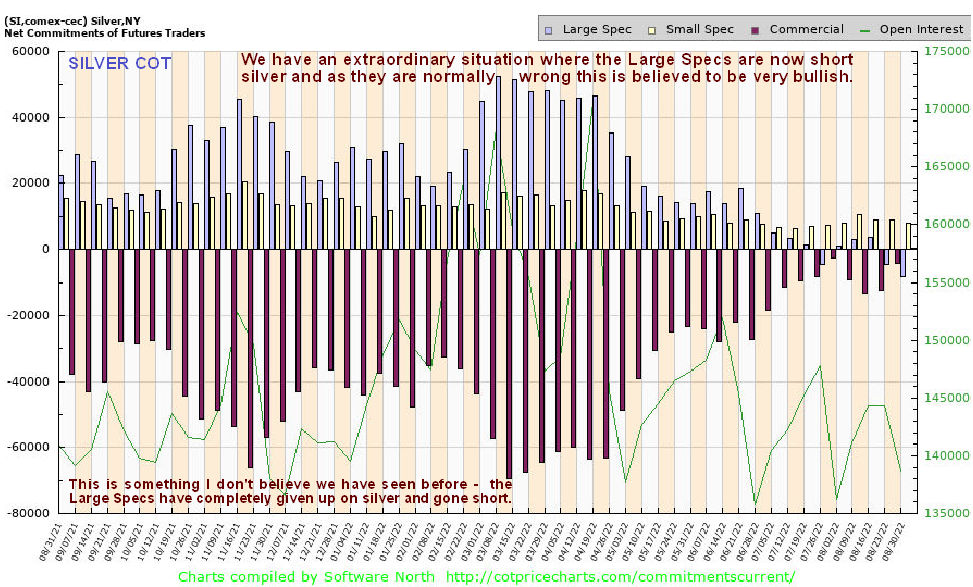
Now we come to some rather compelling evidence that silver is at or very close to an important low now. The latest COT chart shows that the normally wrong Large Specs have not only completely given up on silver, which is almost unheard of, but have actually started shorting it. Meanwhile the net Commercial hedgers’ short positions have all but vanished. This is viewed as a very bullish circumstance and as the hallmark of a bottom.
Now we will take a quick look at gold because it follows that if silver is set to turn up then gold should too, even if its setup does not look so positive as silver’s, as is believed to be the case.
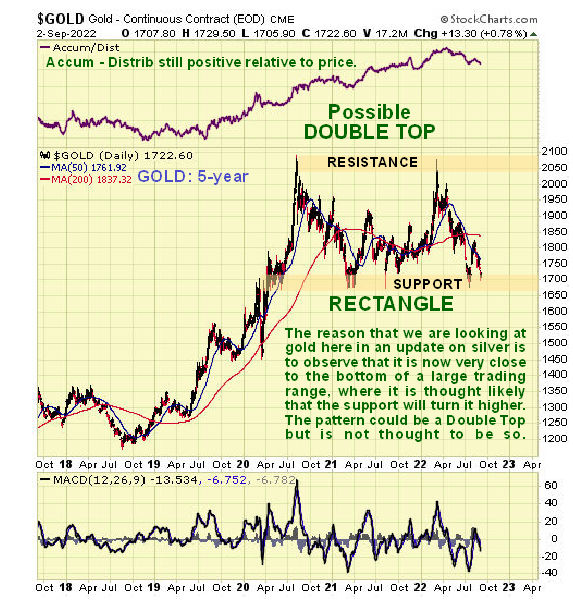
Gold’s 5-year chart enables us to see that it is now close to the bottom of a very large rectangular trading range, which is obviously a good point for it to turn higher, and it may be making a small Double Bottom with its July lows. Whilst acknowledging that its high of March this year could have been it forming a Double Top with its 2020 highs, this is not thought to be the case, in part because of the strength of its Accumulation line relative to the price.
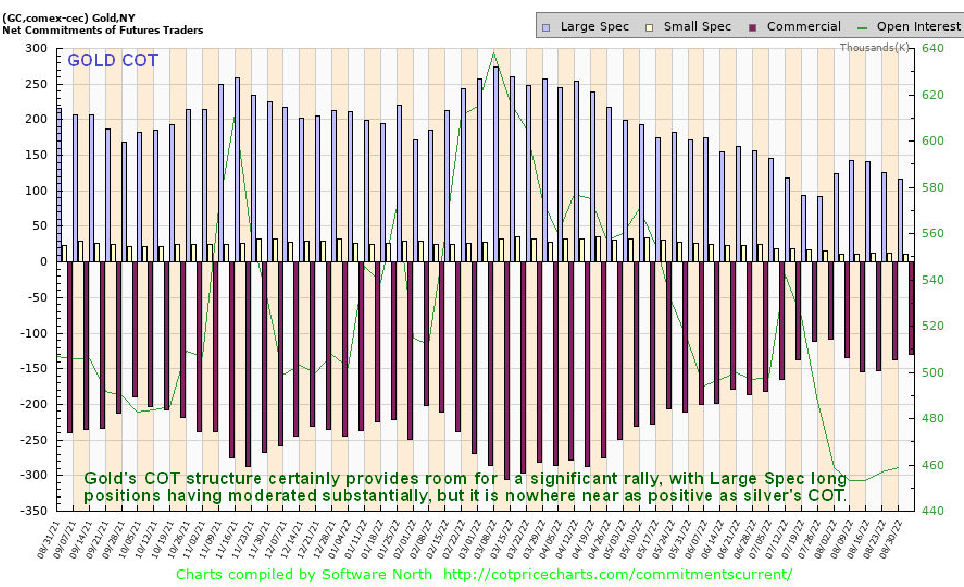
In the interest of completeness and to enable comparison with the silver COT chart above, gold’s COT chart is shown below. As we can see it is not as bullish as silver’s COT, but it shows that there is certainly room for a significant rally with the Large Specs having substantially reduced their long positions.
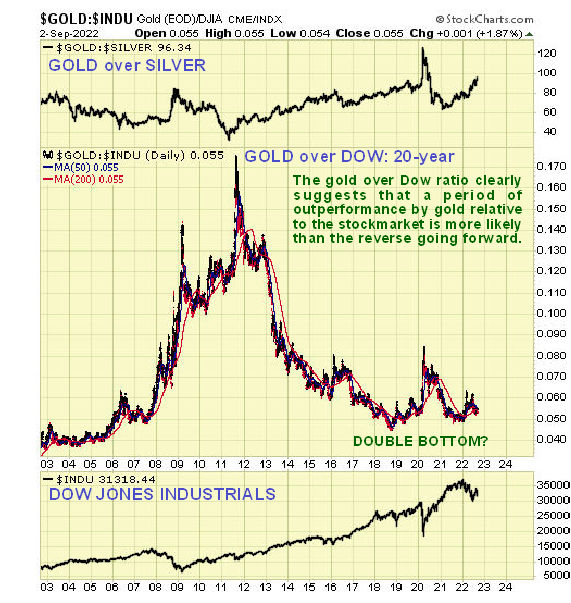
Here it is worth reminding ourselves that gold remains very cheap relative to the general stockmarket, which we can easily do by looking at the 20-year chart of gold divided by the Dow Jones index. Just by itself this chart suggests that gold and gold and silver investments generally make more sense for investors going forward, especially those taking a longer-term view.
A key point to end on is that we should aim to take advantage of the artifically low price of silver and silver investments at this time which is due to the market being rigged by the likes of J P Morgan. When the debt market eventually blows up – and this is a question of when not if – a tidal wave of money is going to flood into this market and you don’t want to be trying to buy on limit up days that may well come one after the other. Much better to buy now when you can browse in peace before the mob shows up like on a Black Friday sale, and it cannot be overstated how important it is to have some physical silver in your possession for use in the event of the banks slamming their doors and ATMs no longer working, which can be in the form of either coins or small bars. When bartering for everyday items silver is a lot more practical than gold.
End of update.
Posted at 9.40 pm EDT on 4th September 22.