X-Terra was on a brief list of interesting stocks sent out in an email earlier this morning. In this article we will see why it looks well placed to start advancing again.
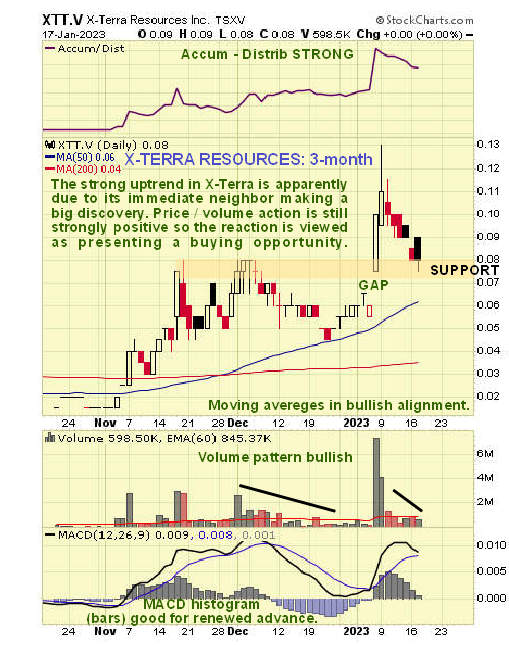
On the latest 3-month chart we can see that X-Terra has been in a strong uptrend since early November, with 2 impulse wave or uplegs so far, the latter one believed to be due to the announcement of a big discovery by its immediate neighbor Winsome Resources, with the likelihood that the mineralization extends into X-Terra’s property. The last upleg earlier this month was short and sharp and included a big up day on very strong volumen with a gap, which in this position is normally very bullish. The reaction back on lighter volume over the past couple of weeks towards strong support and the rising 50-day moving average is therefore viewed as presenting us with a good “buy spot”.
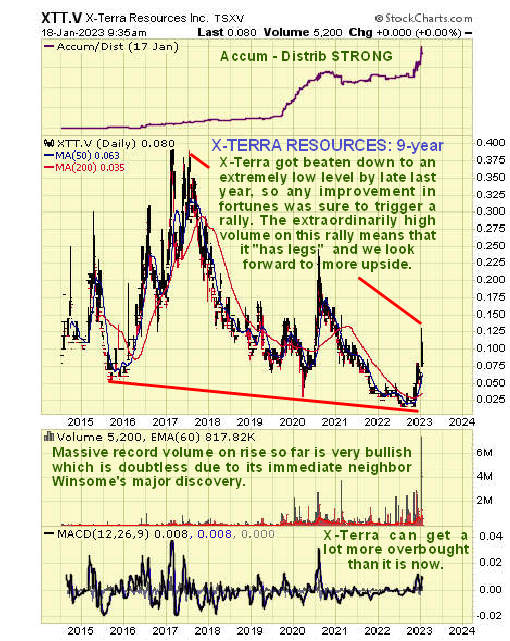
The following 9-year chart, added later during the trading day, provides us with a Big Picture perspective on what is going on. On it the first thing we see it that X-Terra is advancing off a very low low that it dropped to late last year, so there is certainly plenty of room for recovery. The next and most important point to observe is that the current advance is being driven by strong volume that hhas been on record volume by far that has driven its Accumulation line steeply higher. This is very positive and implies that the advance “has legs” and probably has much further to go. The upper trendline shown may restrain the advance for a while, but probably only sufficient to allow an overbought condition to unwind.
X-Terra is therefore regarded as a strong speculative buy here for renewed advance.
X-Terra Resources website
X-Terra Resources Inc., XTT.V, XTRRF on OTC, closed at C$0.08, $0.07 on 17th January 23.
Posted at 9.30 am EST on 18th January 23. 9-year chart and associated text added at 11.00 am.