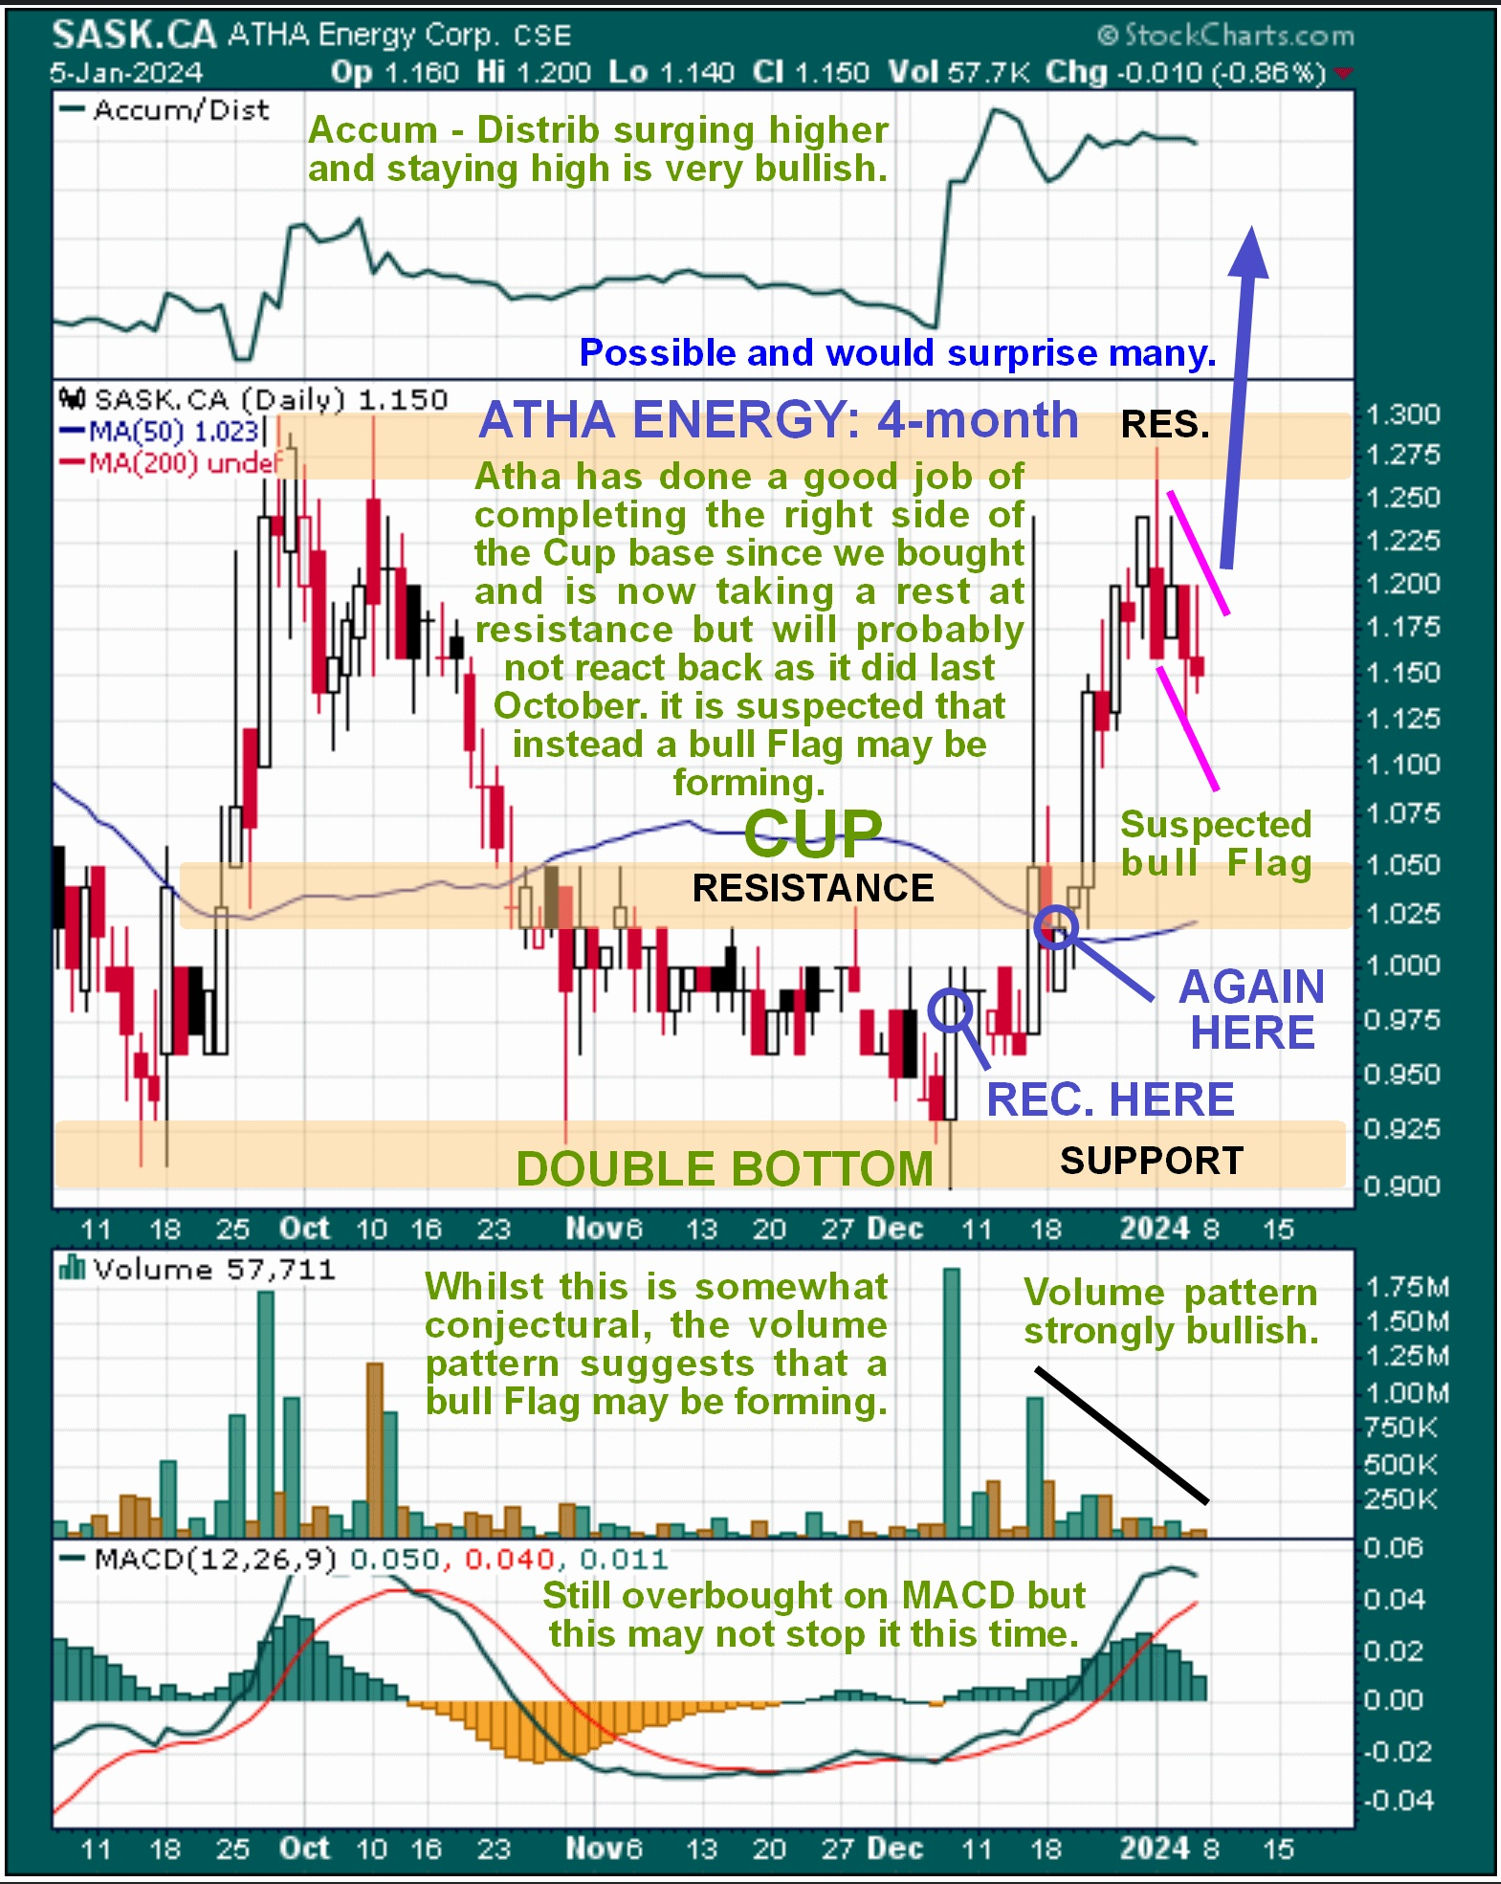
Uranium stock Atha Energy has done well since we bought it in early and mid-December, as it has since broken out and risen steeply to form the right side of a Cup pattern, as we can see on its latest 4-month chart below. This rally brought it up swiftly up to resistance at the September – October highs where it has stalled out partly due to the big uranium stocks like Cameco (CCJ) correcting back following strong runs. So the question for us now is whether “that’s it” and it will now react back much further as it did following the September runup, or whether it will marshall itself to bust through the resistance at the September – October highs. Although not the easiest call to make at this juncture, I believe it will do the latter for the following reasons.

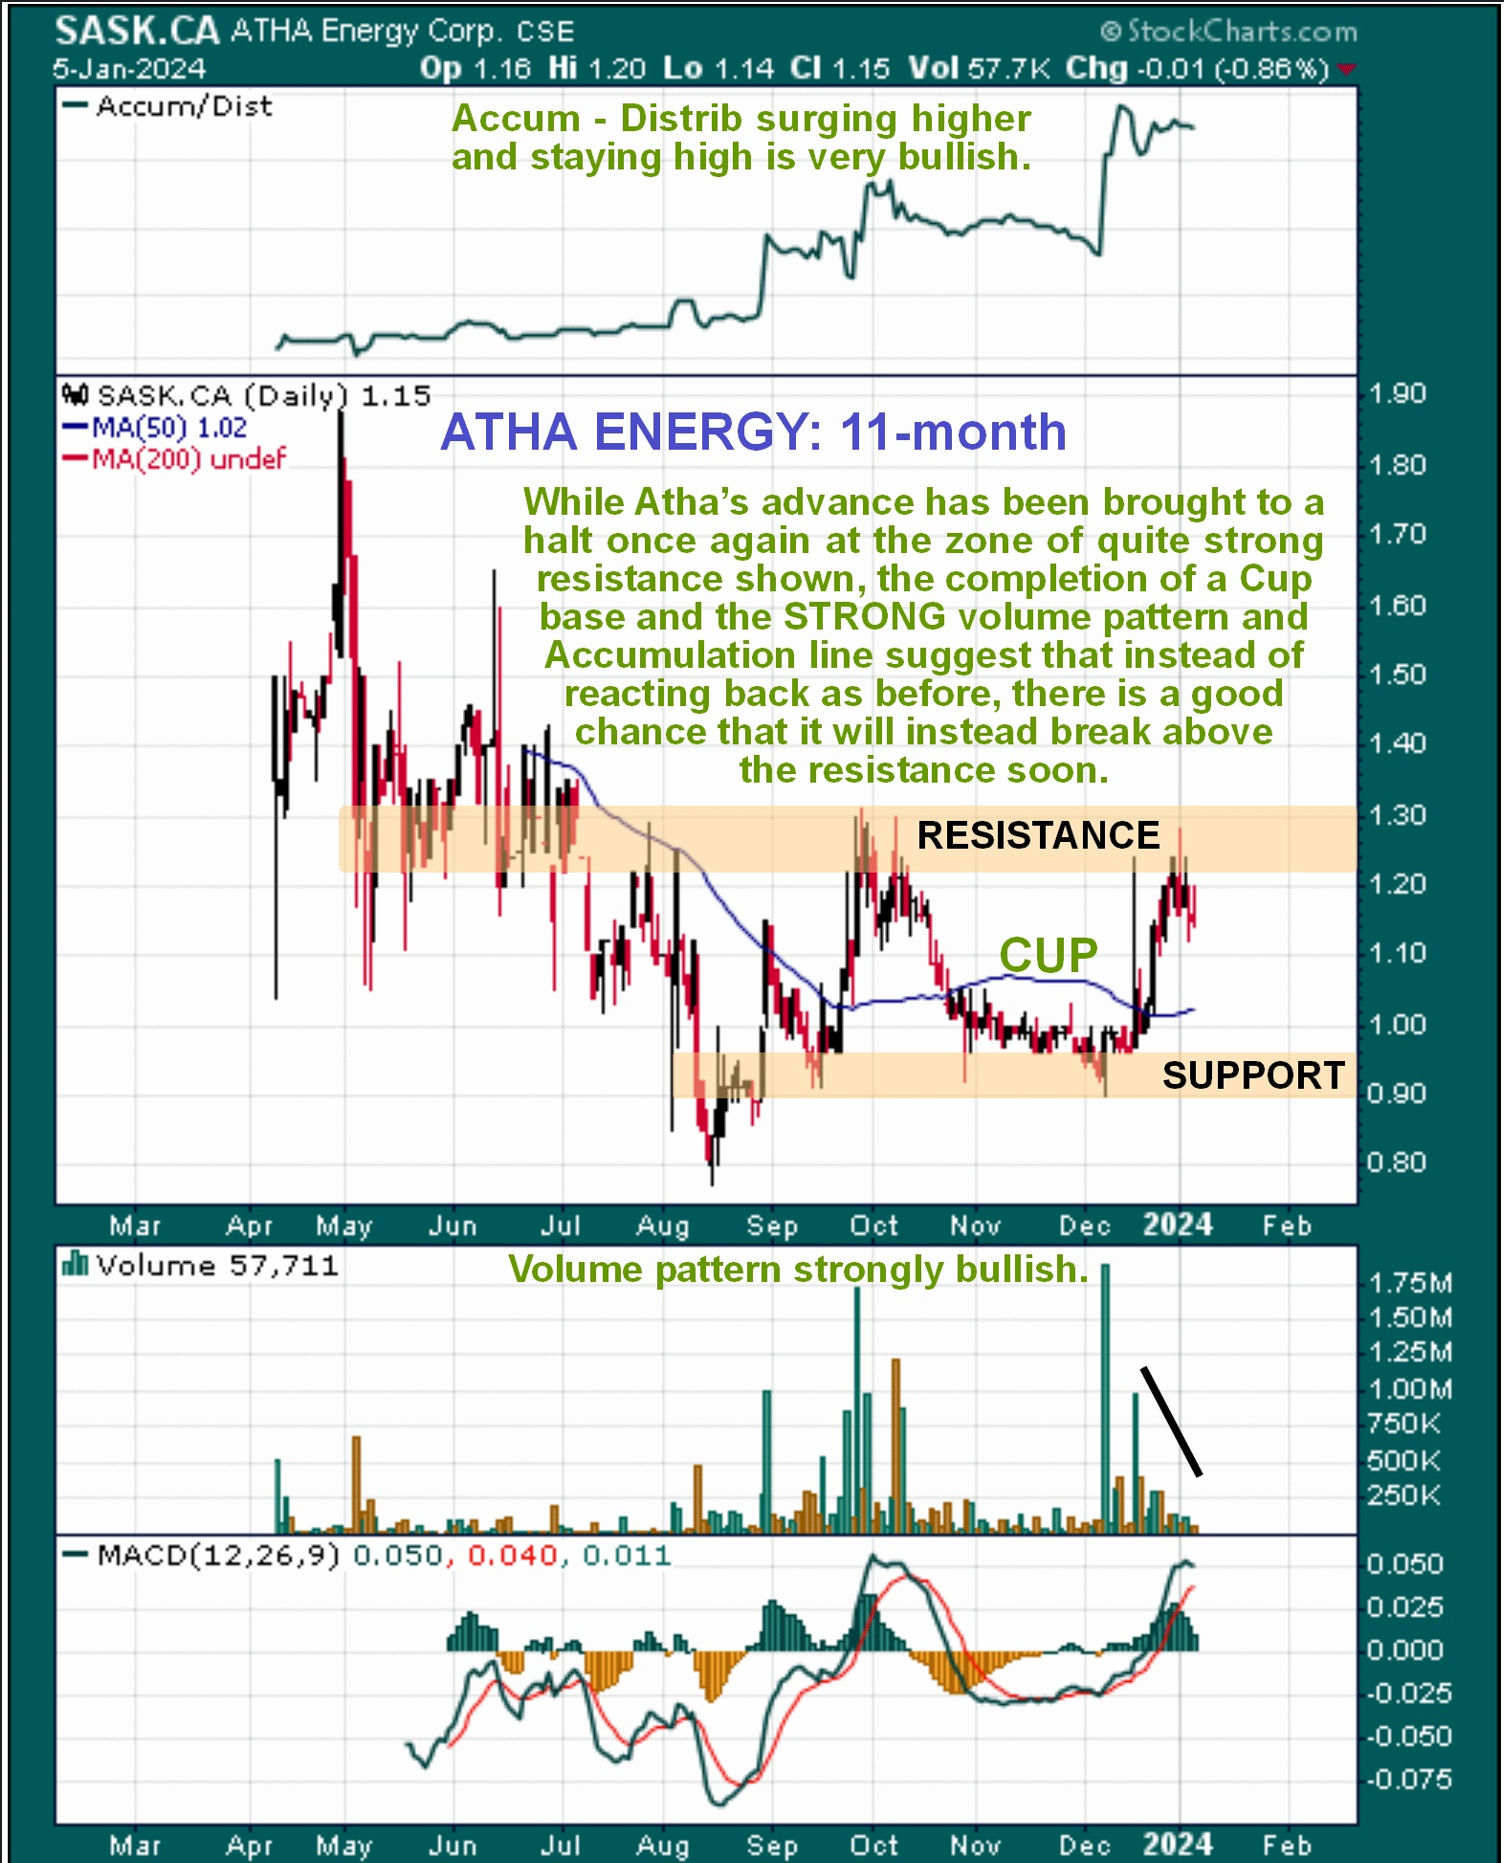
In the first place it looks like the larger uranium stocks will soon embark on another strong upleg following a normal correction within an ongoing strong bullmarket. Fundamentally, the uranium price bottomed in November 2016 and it has been trending strongly higher ever since with many countries planning to ramp up electricity production from nuclear. The problem for North America and the US in particular is that almost all uranium has to be sourced from countries in Asia with which it is not exactly on friendly terms, to put it mildly. Enter Atha, which holds the largest cumulative exploration package in the Athabasca Basin, the world's most prominent basin for uranium discoveries, with 3.4 million acres which it plans to drill for the 1st time this year. So fundamentally the outlook for the company is bright. Technically, if we look at the 11-month chart below, we see that the price is now better positioned to break above the key resistance in the C$1.22 – C$1.30 zone than it was in September – October. Even though the attack on this resistance back then failed to break above it, what it definitely did do is drain off a considerable amount of the overhanging supply at this level dating back to the extensive trading in this area from April to early July of last year. In addition, the price has just completed marking out a bullish Cup pattern. So with the larger stocks in the sector looking set to advance anew after a period of correction, this is a good time for Atha to “go for it” and break above this resistance which would mark the start of a bullmarket in the stock.

So if we now refer back to the 4-month chart again we see that there has been a very marked dropoff in volume as the price has reacted back over the past week. This is bullish and implies that rather than the price forming another intermediate top as in September - October, it is instead completing a bull Flag whose prospective boundaries have been drawn on the chart. If this interpretation is correct then it should take off higher again very soon and break above the key resistance.
We therefore stay long and this is regarded as another good point to buy or add to positions.
Atha Energy Corp website
Atha Energy Corp., SASK.CSX, SASKF on OTC, closed at C$1.15, $0.85 on 5th January 24.
Posted at 3.50 am EST on 8th January 24.

