Because it has such massive implications for just about everything, today we are going to review the charts for the dollar index.
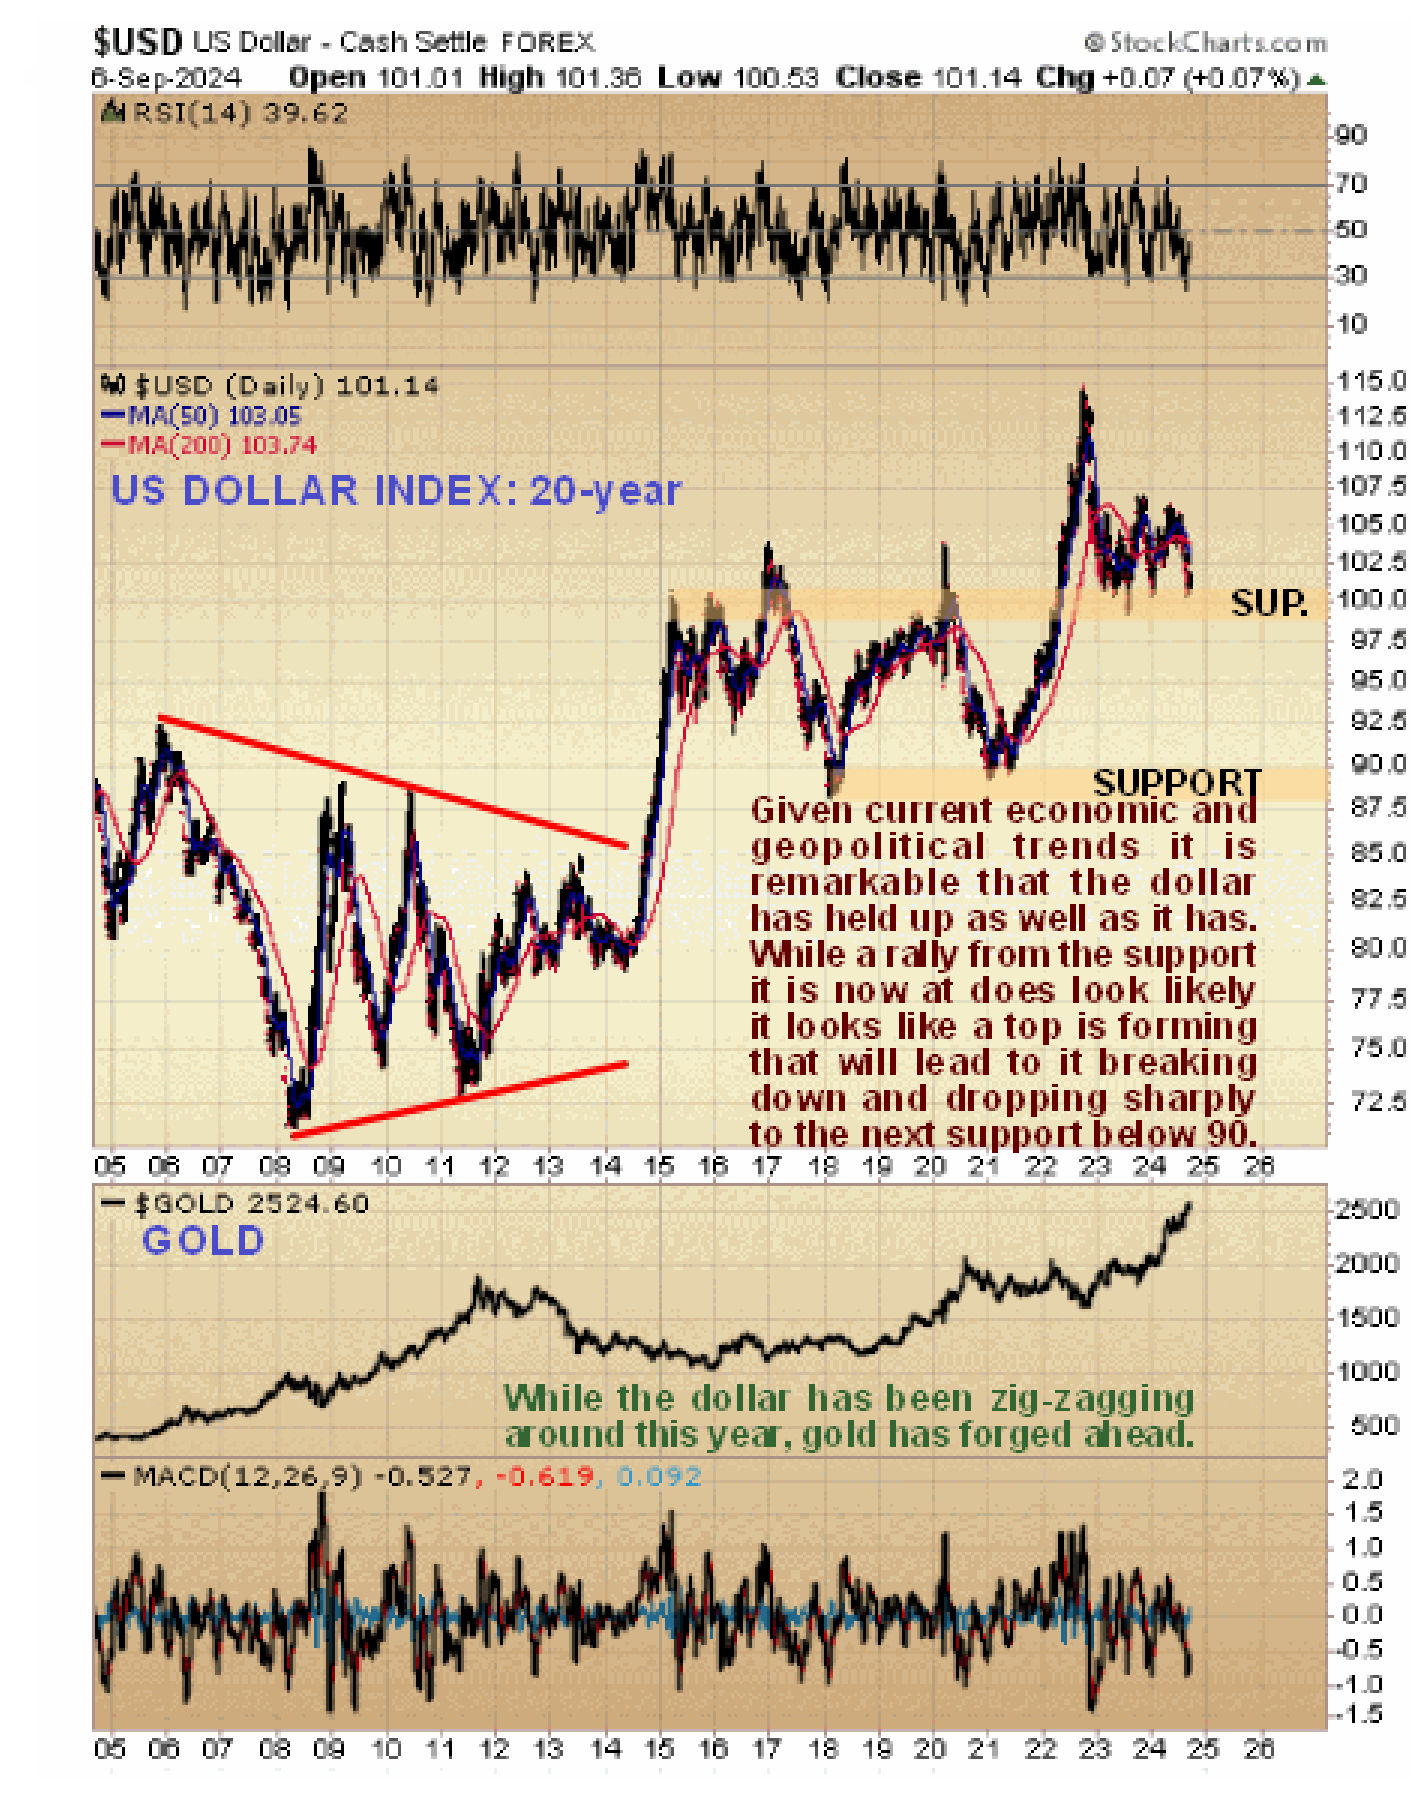
Starting with the long-term 20-year chart the first point to make is that, given the rampant money creation by the Fed and the grim economic and geopolitical outlook for the US, it is remarkable that it has held up as well as it has, which is believed to be largely due to debt servicing by horribly indebted foreign countries saddled with massive dollar debts. However, the BRICS and the Global South are moving away from the dollar at an increasing pace, which is partly due to the US’ unbridled use of sanctions against any country incurring its disfavor, its complicity in Israel’s genocide of the Palestinians and the willingness of the US to go to war to enforce the dollar reserve currency system on the world. This of course is what the proxy war against Russia is all about, using the Ukraine as an expendable “battering ram” against leading BRICS country Russia. The cover story about “defending democracy in the Ukraine” is nonsense intended for consumption by the ignorant masses. If they can take down Russia they will move on to China. However, this war is not going well at all – they have underestimated Russia which is pulverising the Ukraine military and looking set to dictate the terms of surrender. The danger here is that the West will not accept this outcome and will double down by sending missiles to Ukraine that may be able to attacks targets deep within Russia, which could well lead to the conflict going nuclear but as things stand Ukraine is beaten, NATO has been humiliated and the US is viewed by the larger world as heading for irrelevancy and relative obscurity. What this implies is that the US’ huge debts coupled with the Fed’s manic money creation will completely destroy the dollar which will end up like the currencies of Venezuela and Zimbabwe. So, returning to our chart, what is expected to happen is that the dollar breaks down below the support at 100 and plummets with the first downside target being the support in the 88 – 90 area. However, there may be a near-term rally first, before this happens, for reasons that we will see when we look at the dollar’s shorter-term charts.

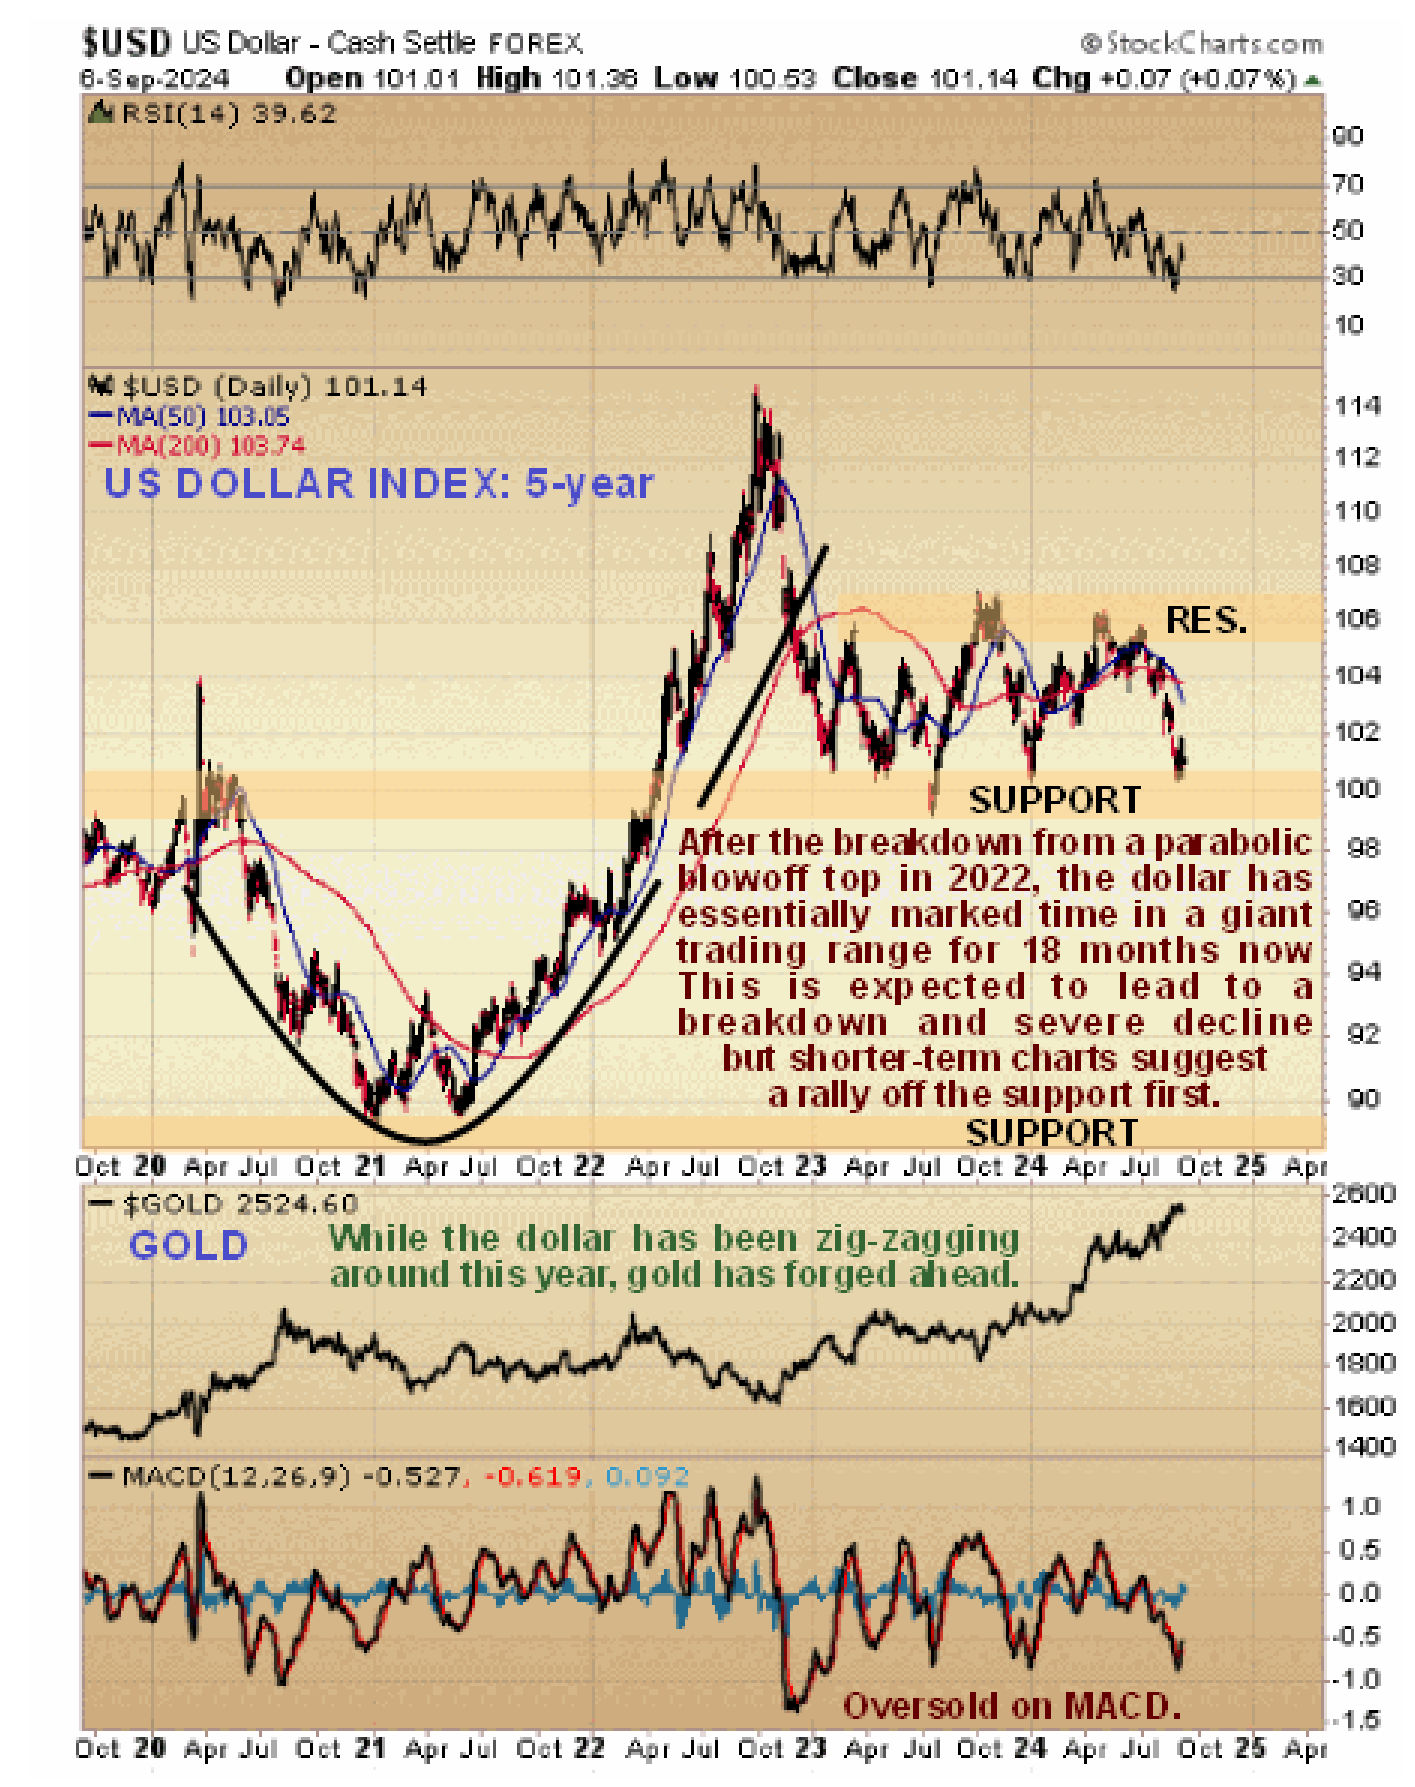
On its 5-year chart we can see that the dollar accelerated into a parabolic blowoff top in 2022 that is thought to mark the final high, the breakdown from which led to a large trading range forming which has been going on for about 18 months now. Normally, following a breakdown from such a parabolic blowoff top, a trading range of the type that has just formed is a consolidation that leads to renewed decline, and we can certainly see for fundamental reasons why this would be. Over the past couple of months the dollar has dropped back to quite strong support at the lower boundary of the range which it arrived at in an oversold state with the 6-month chart that we will look at shortly suggesting some sort of rally soon off this support. However, over the longer-term it looks set to break below this support and drop hard. If this scenario eventuates then it will present a golden opportunity to add to PM sector positions on a dip ahead of renewed advance that is expected to be powerful.

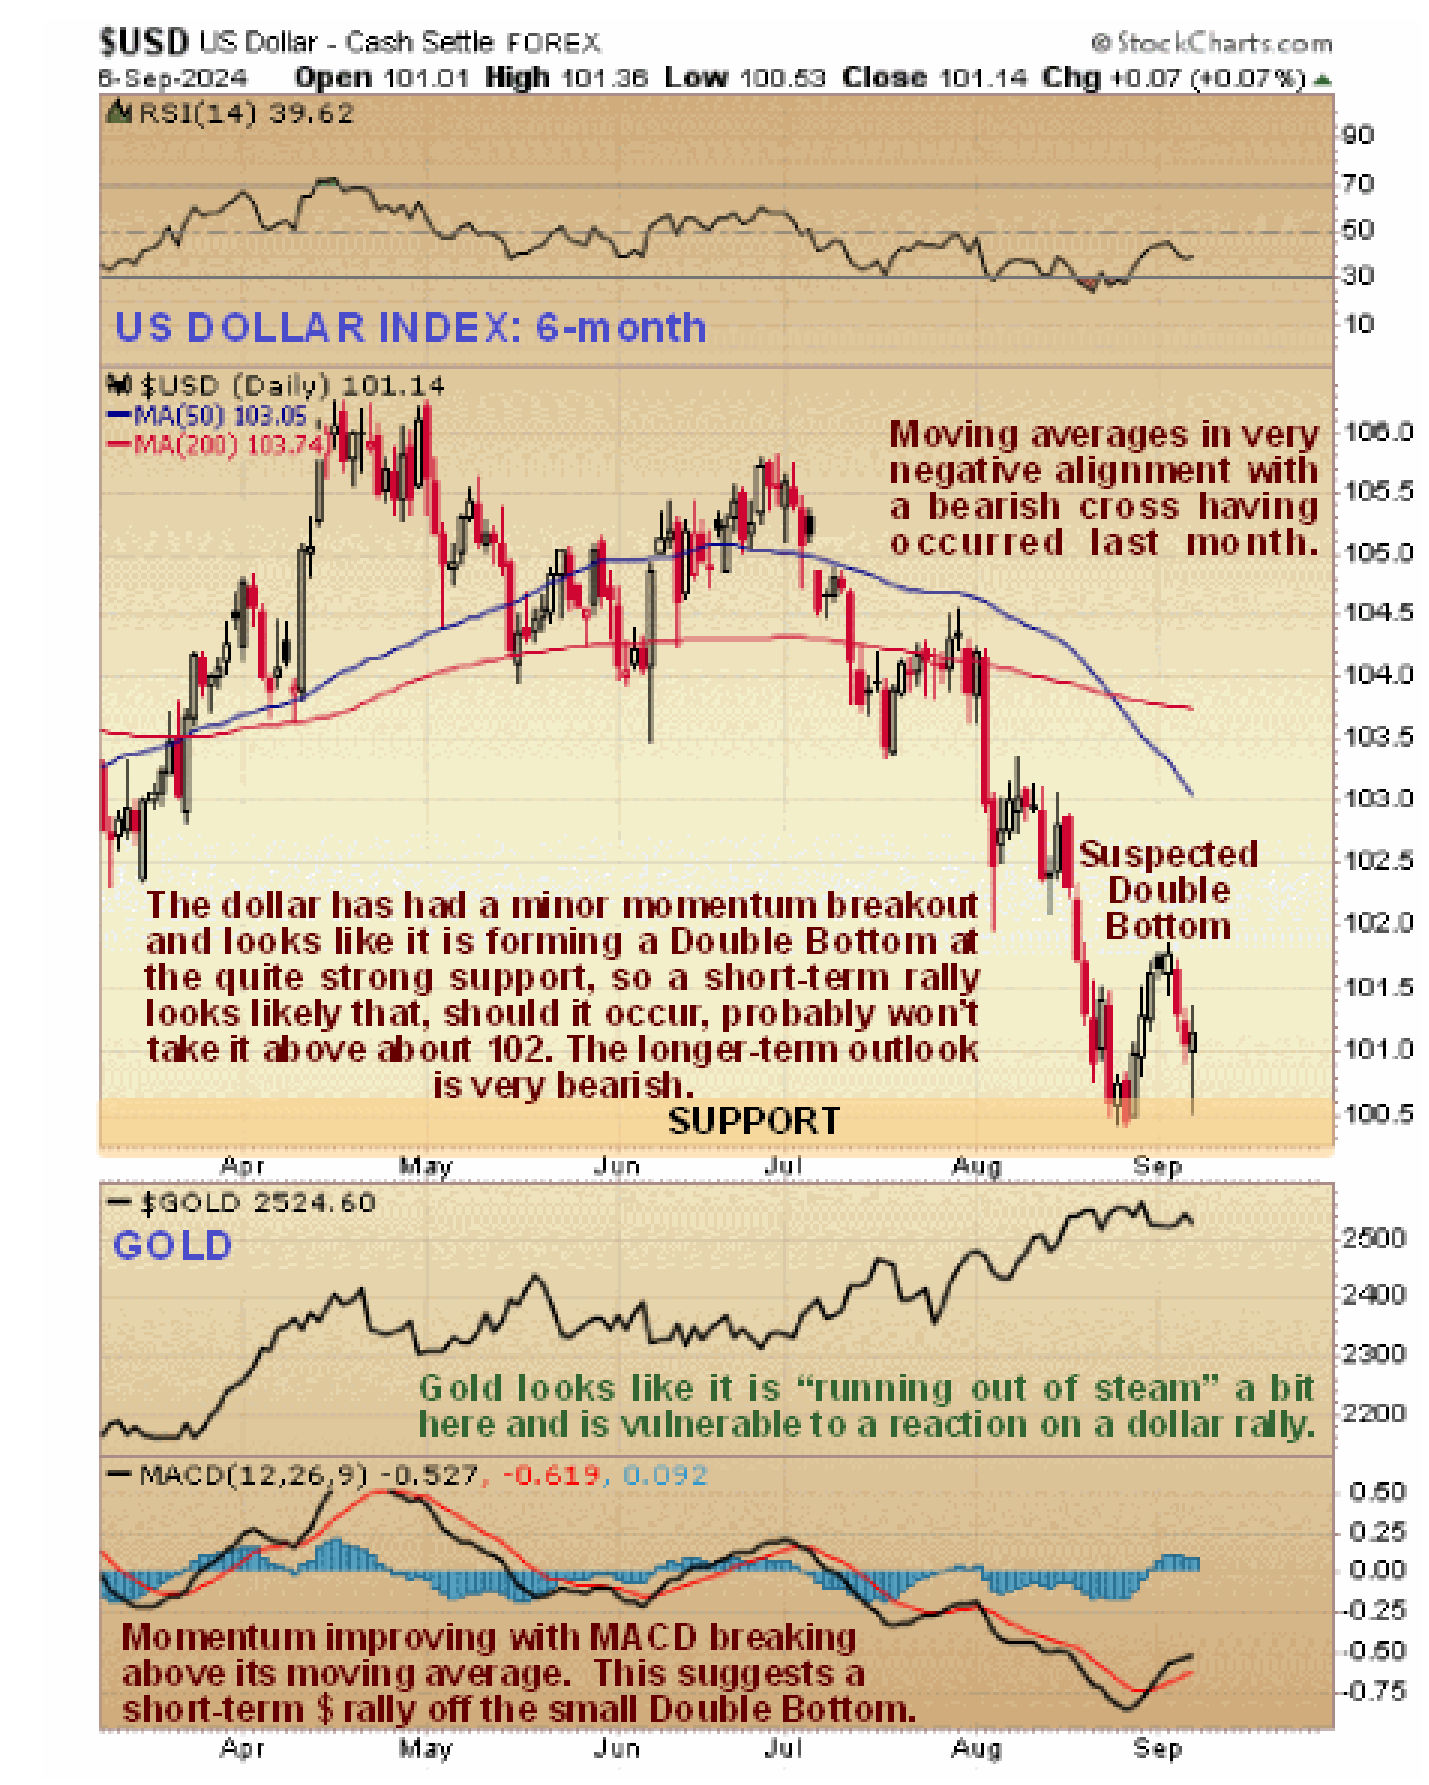
On the 6-month chart we can see how the dollar has accelerated into a low at the support where it bounced with its MACD breaking clear above its moving average in a manner which indicates that it has probably bottomed for now. It retreated back towards this support last week with Friday’s candle suggesting that it is making a small Double Bottom. It therefore looks likely that it will rally from here, although any such rally is not expected to get very far - probably no further than about 102 - before the dollar reverses to the downside again and goes on to breach the support and drop hard to the next significant support in the 88 – 90 zone. Gold has been added to this chart (and the others) and you can that it is looking a bit frail here after its recent runup. If a short-term rally in the dollar does occur and the PMs get knocked back more it will be regarded as a very good opportunity to buy or add to positions accross the sector.

You may recall that a near-term top was called for the broad market in the BROAD US MARKETS update of 30th August and so it proved to be and the example PM stock included in that update, Coeur Mining, has dropped back towards its 200-day moving average as predicted. If we do see a short-term dollar rally it may of course synchronize with temporary risk-off conditions, meaning that the broad market is likely to drop further and as a result PM stocks could drop further too, bringing Coeur down to a buy zone near to its rising 200-day moving average and of course other PM stocks too. At this juncture we can expect the Fed to indulge in another binge of money creation that reverses the stockmarket back to the upside.
End of update.
Posted at 4.10 pm EDT on 8th September 24.


