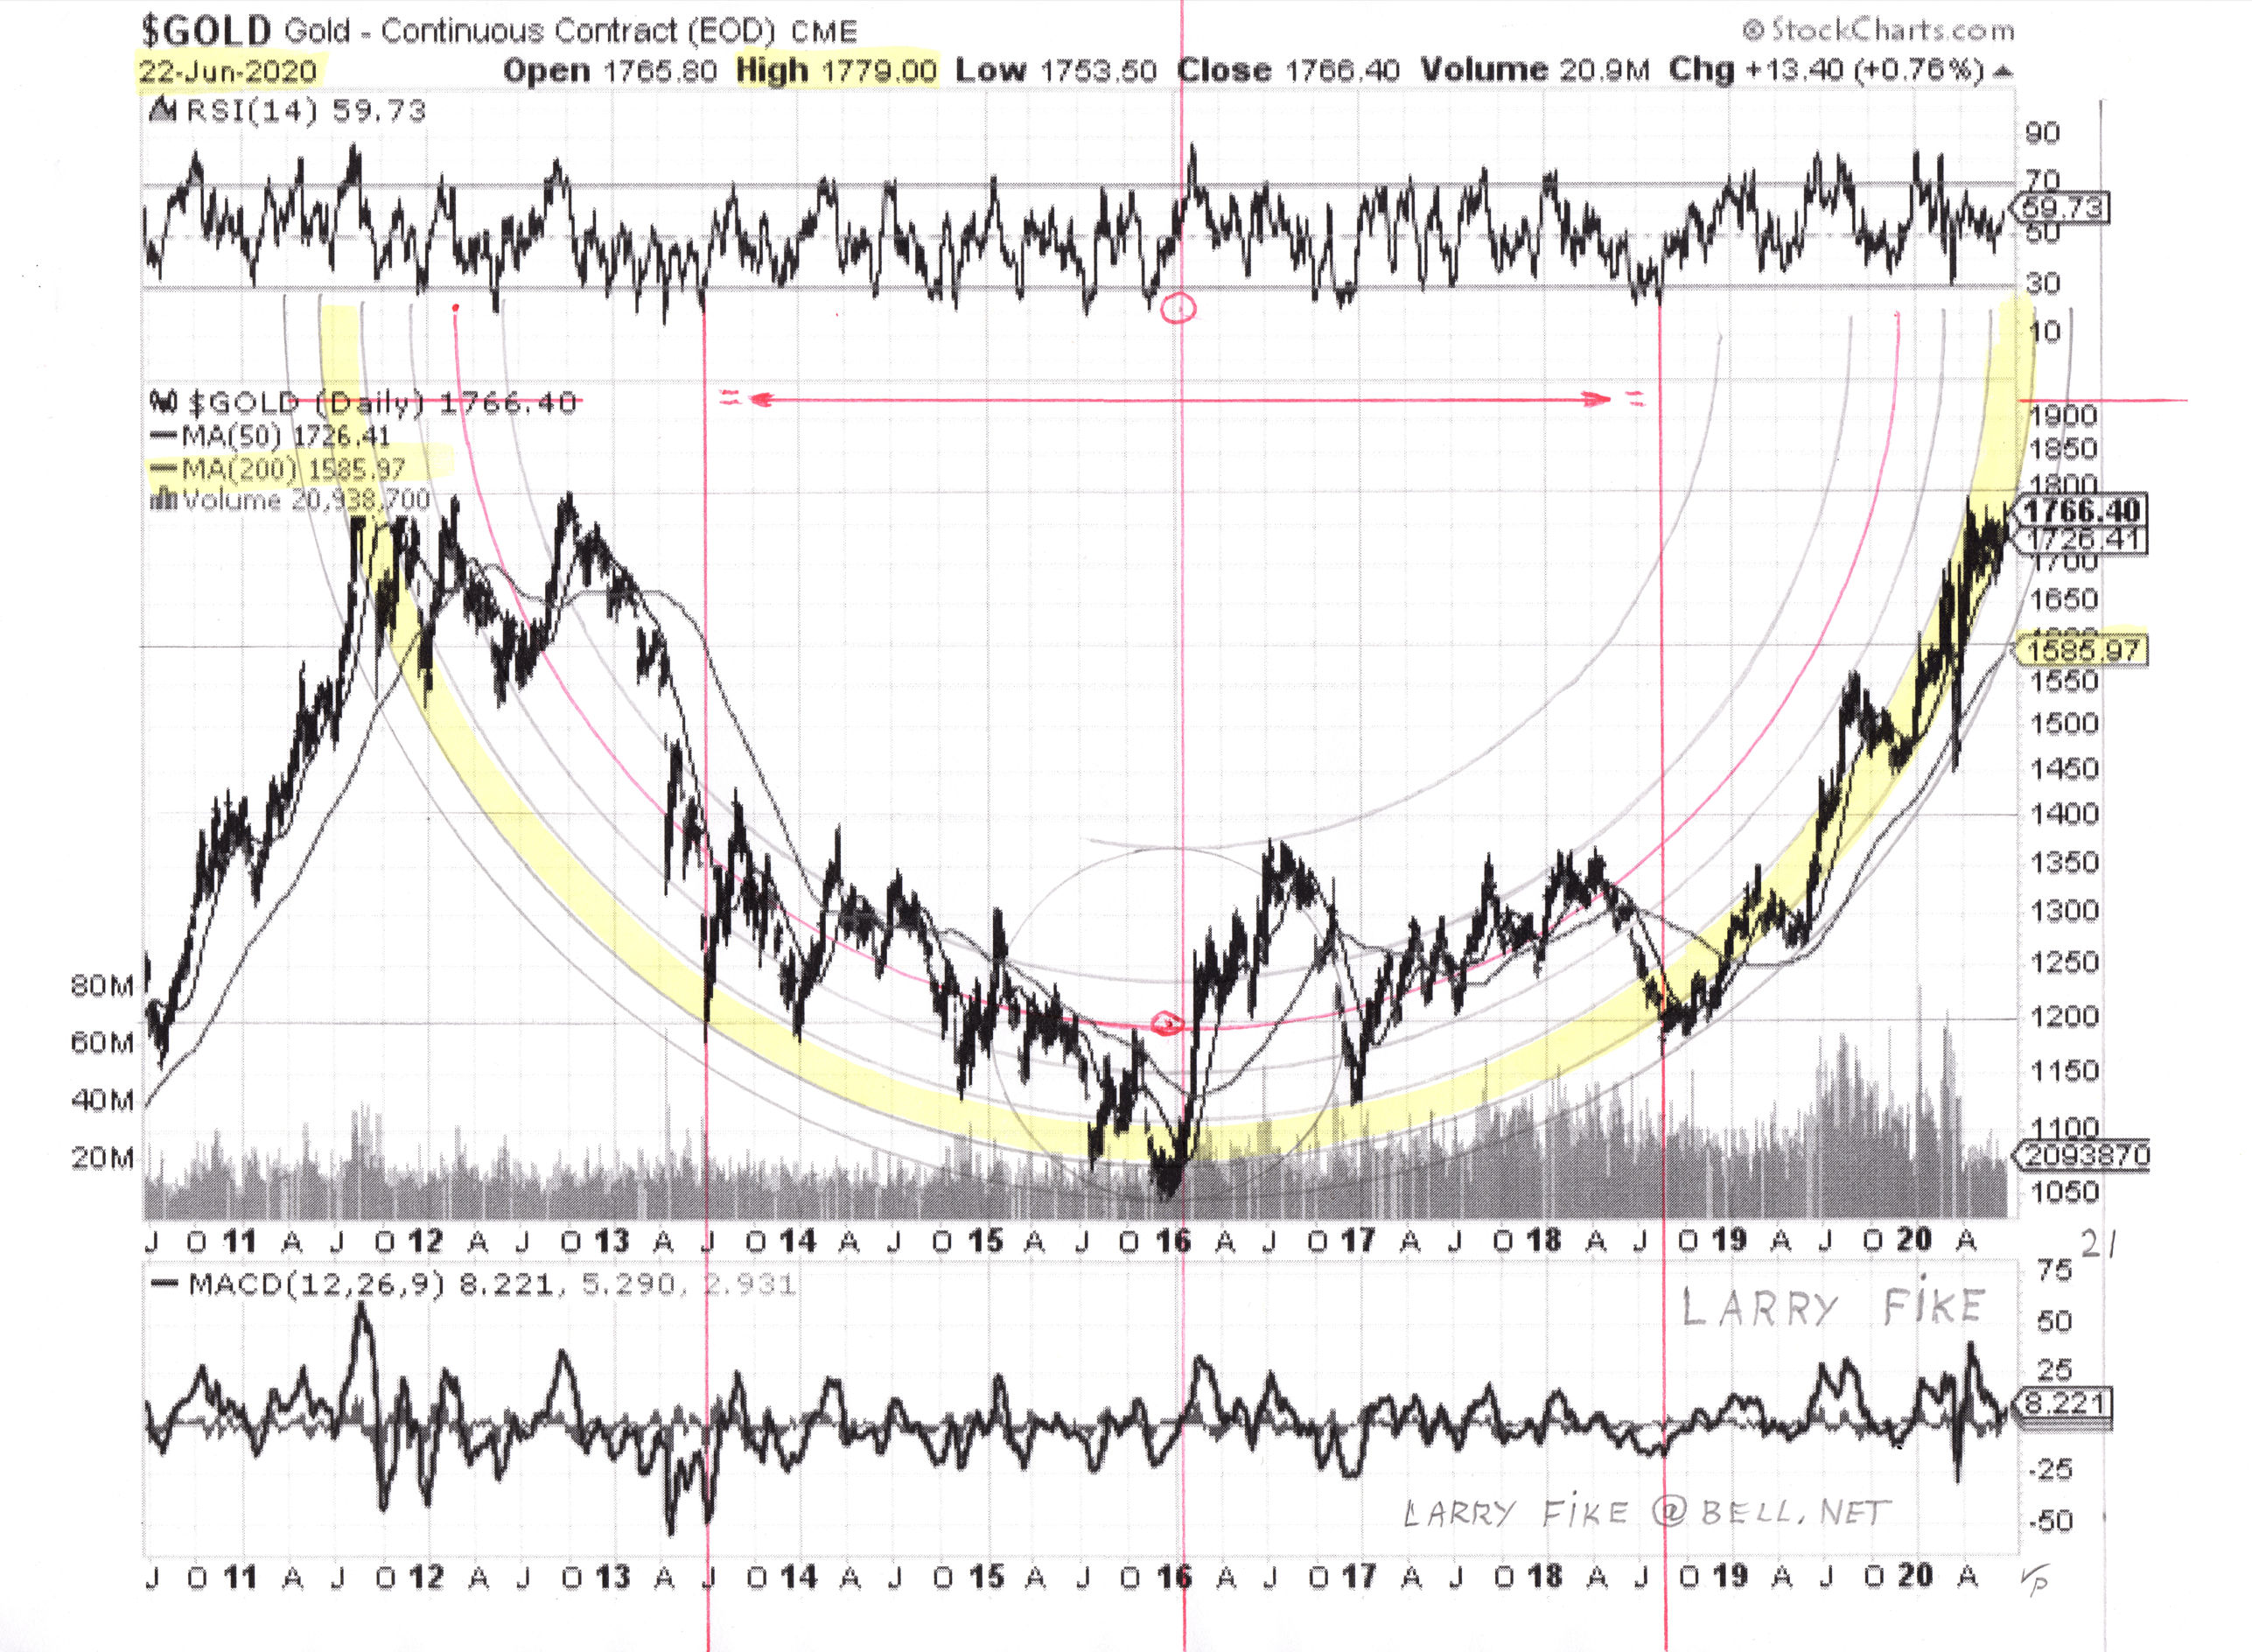
I am in receipt of an annotated long-term gold chart from Larry Fike. Long-time subscribers may remember seeing Larry’s very long-term gold chart some years back that portended a massive gold bull market – which is what we are seeing get underway right now. The last of these charts that I received was dated 22nd June 2020 and as a refresher it is shown below. The chart shows the gigantic Cup that formed from the 2011 highs which at the time of this chart was not quite completed, although just a couple of months later it was after gold rose sharply during the last half of July and the early part of August to hit a peak at $2089.20 on the 7th August 2020. After that gold settled into a long and vexing Handle consolidation that continued for more than 3 and a half years, with it finally breaking out to start the current major bull market phase in March of this year.
Having reviewed Larry’s older gold chart showing the giant Cup pattern in detail we will now proceed to look at his latest 25-year chart which shows the completed Cup & Handle pattern…
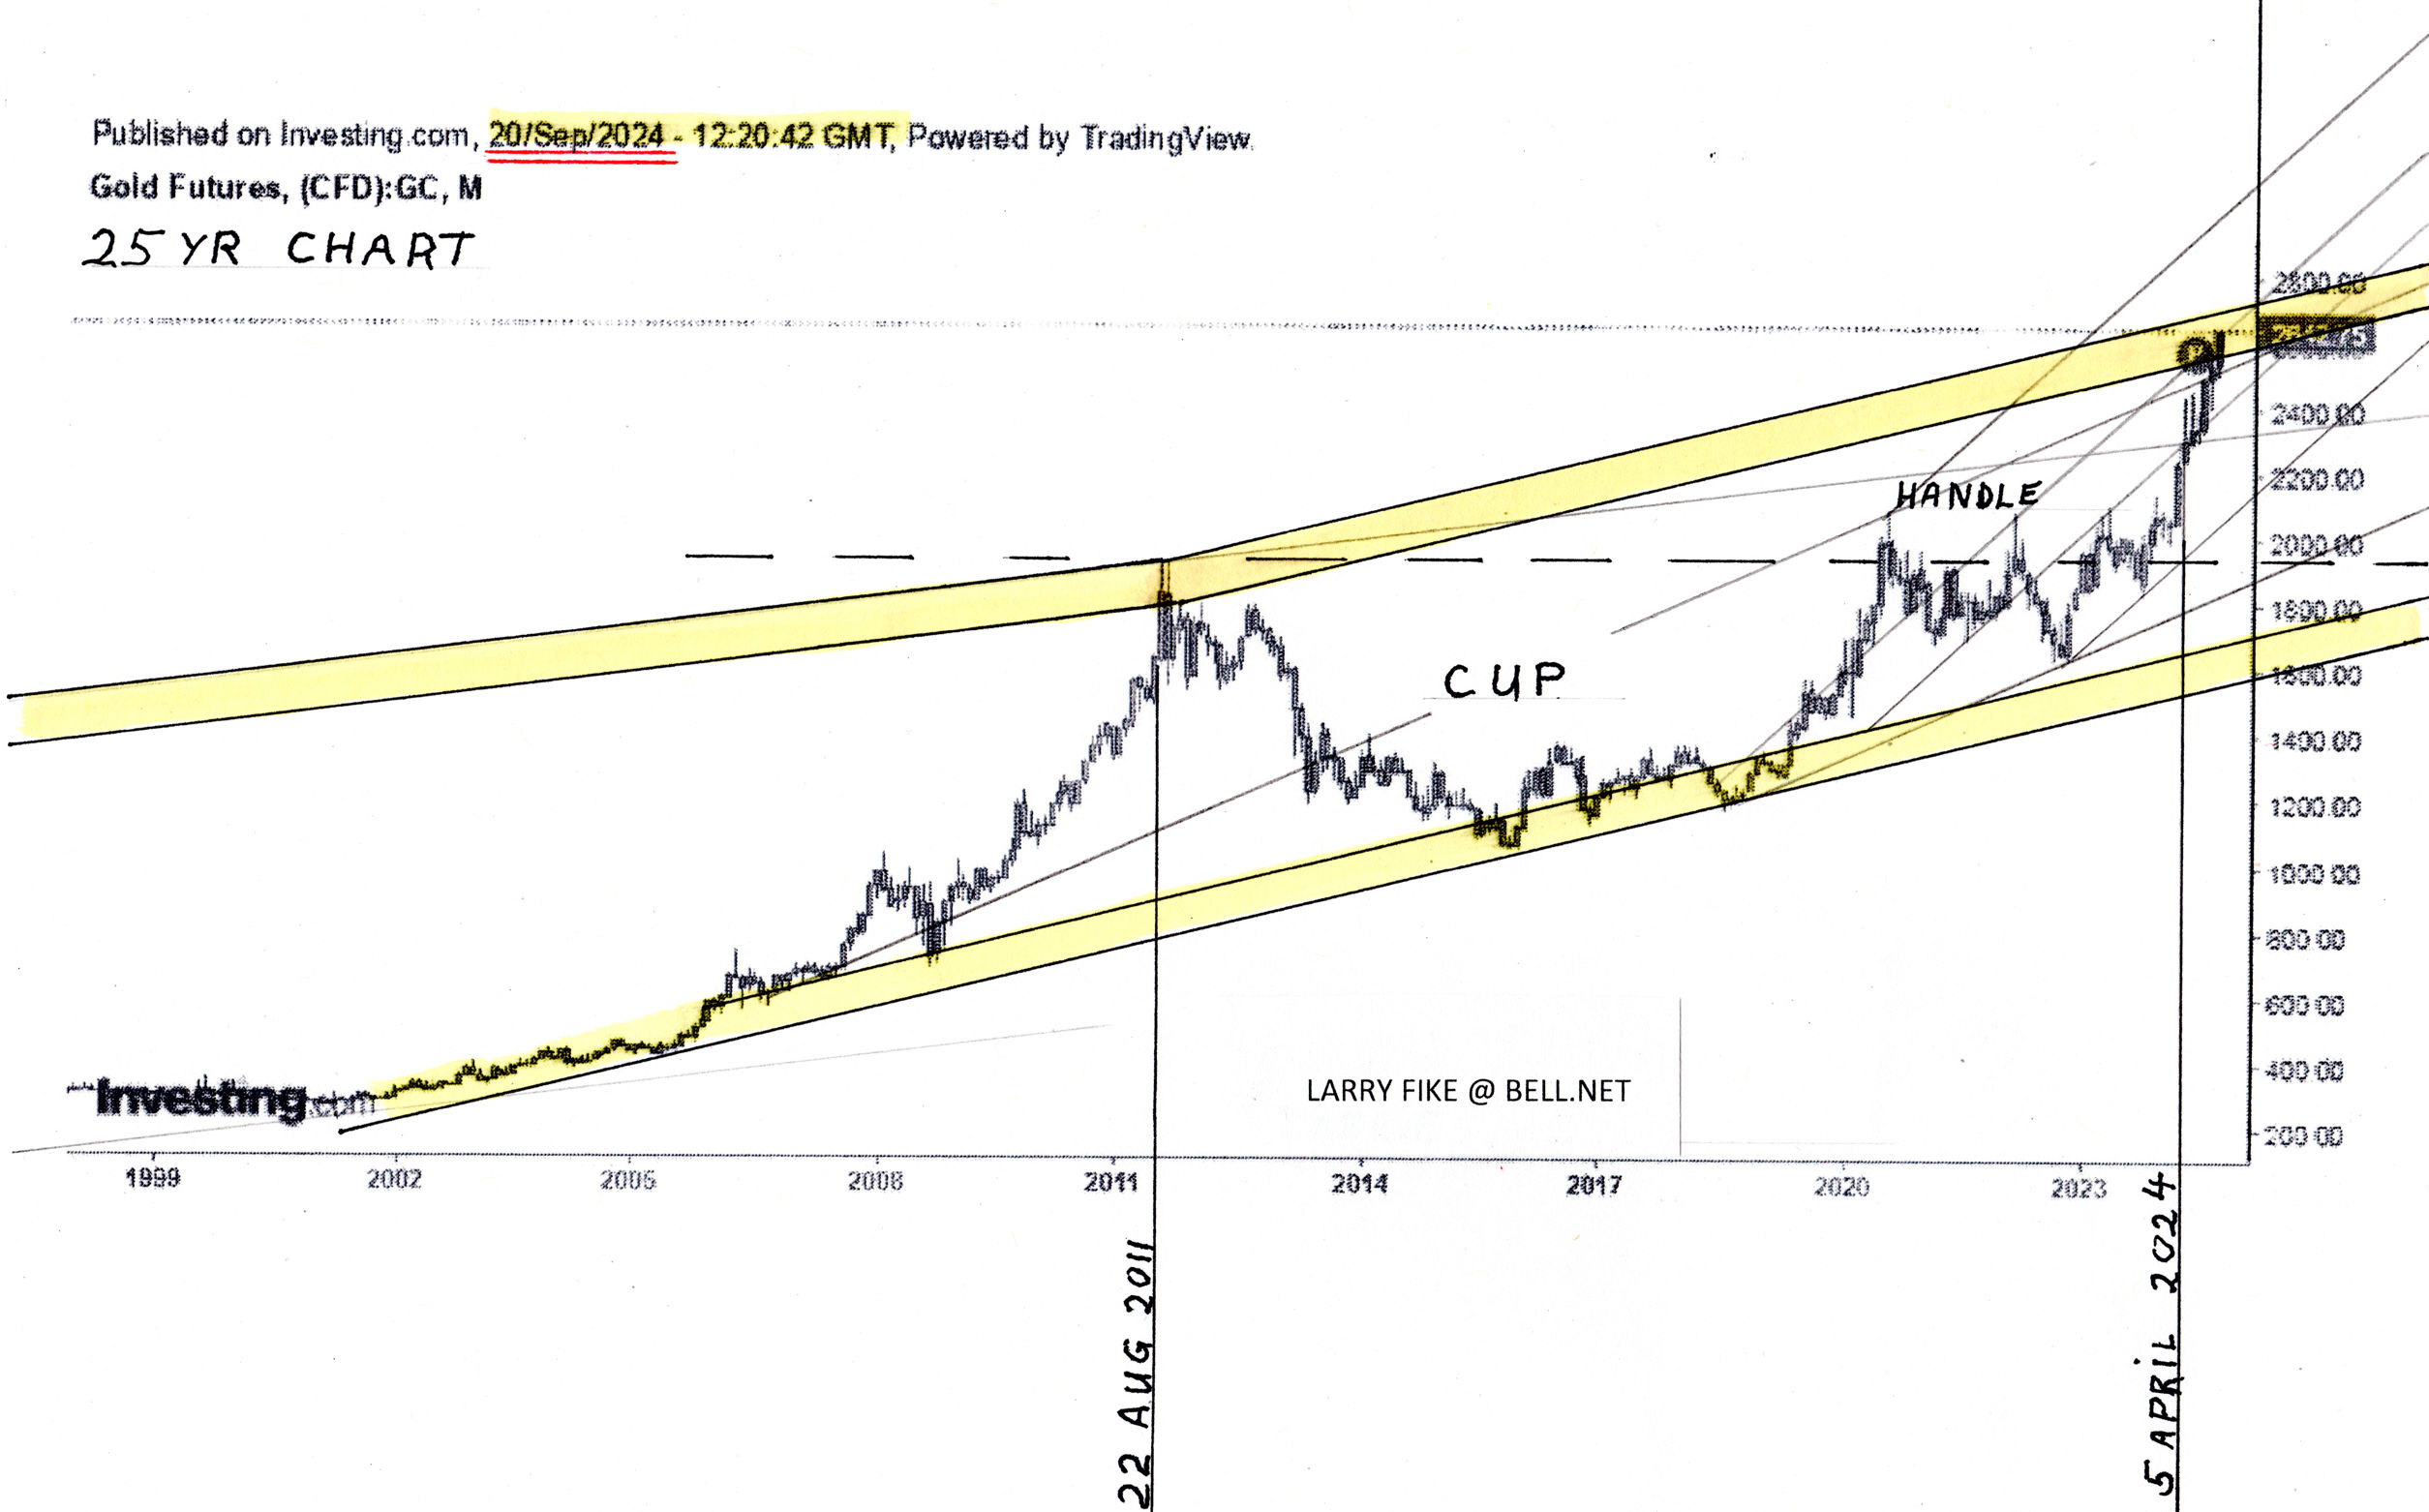
Larry is currently of the view that once gold breaks above the long-term yellow-colored upper channel rail shown on his latest 25-year chart above, it is likely to go into vertical meltup mode, which is in my view a very likely scenario given what is in store for most currencies.
Here is what Larry himself had to say about this chart…
“What I am seeing… and thinking what I am about to see… is very exciting.
According to chart history… a breakout from a rounding cup and handle usually results in a dramatic parabolic upward move.
As you very carefully examine the attached 25-year chart of Gold that I have been working on for weeks… please notice what it is screaming at us.
It seems (to me ) that it could explode upwards before the end of the 2024 year.”
Maund additional comments: I concur with Larry’s observations and would add that once gold succeeds in breaking above the steeper upper rail of the channel in force from the 2011 highs, it should indeed go into vertical meltup mode but this is likely to start as a steep but fairly orderly uptrend that accelerates in stages over time until it ends up in a wild speculative melee with the price going “limit up” successively or equivalent as much as market conditions and rules at the time permit. Needless to say, the gains in all gold-related investments at this time should be spectacular.
With thanks to Larry for permission to use his charts.
Posted at 4.45 pm EDT on 26th September 24.