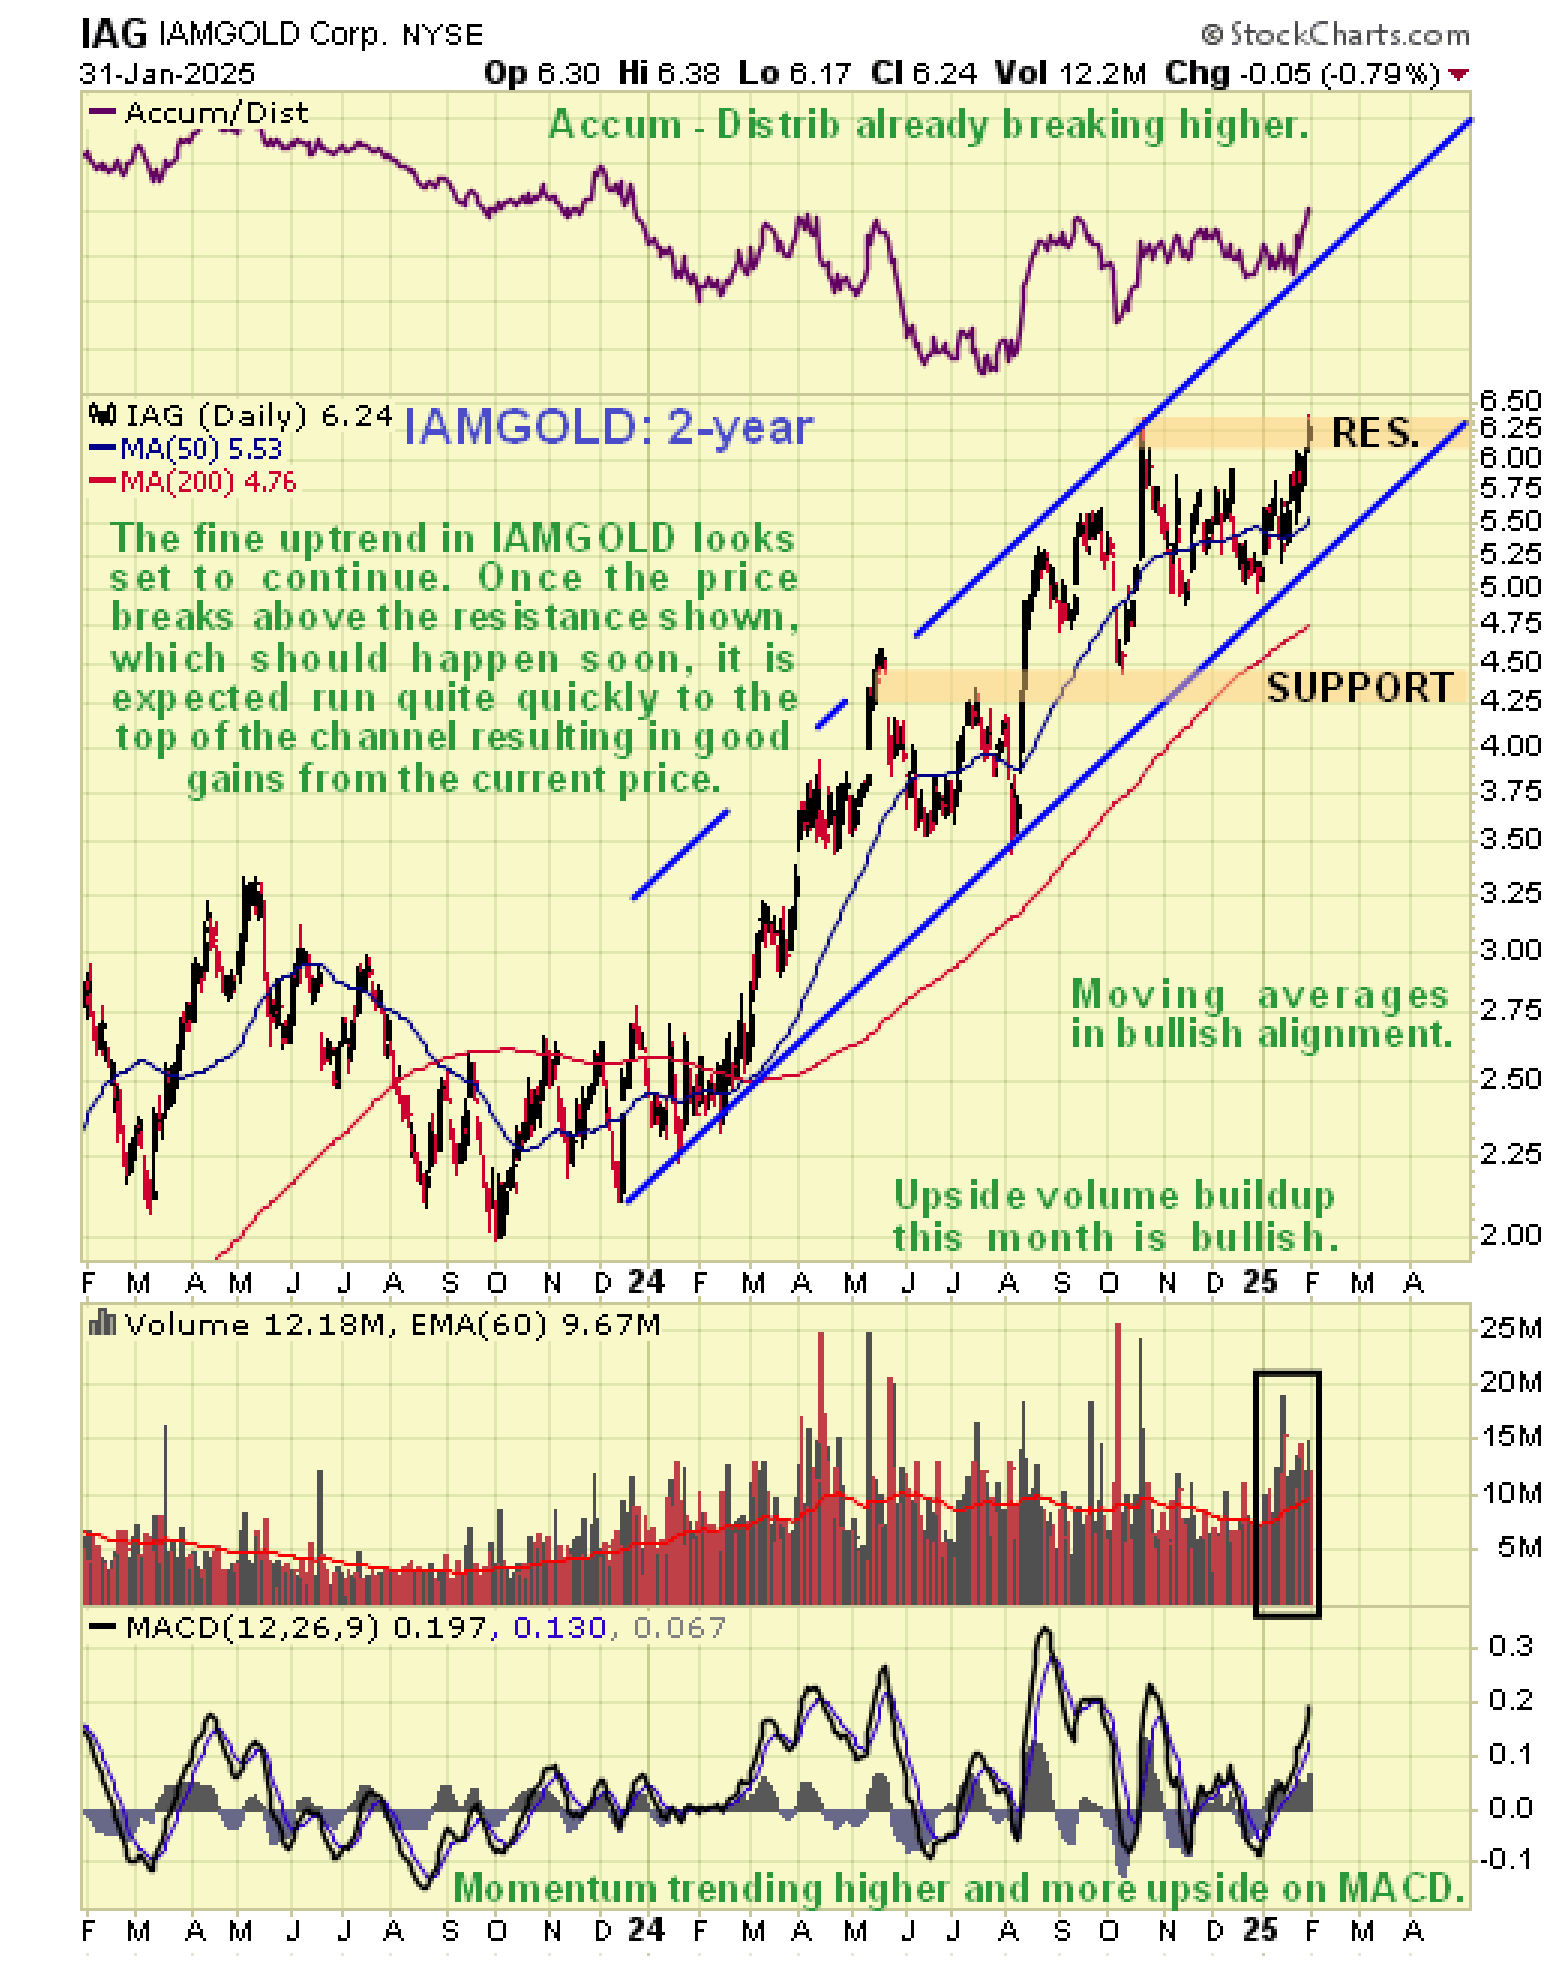
The charts for IAMGOLD present a resolutely bullish picture. On a 2-year chart we can see that it is in a strong uptrend with a new upleg looking set to develop soon. The origins of this uptrend can be traced back to late 2023 – early 2024. It has been in a consolidation pattern with an upward bias since last August which has restored upside potential and if it should break to new highs soon as expected then it should run at the upper rail of the channel which will result in significant gains from here.
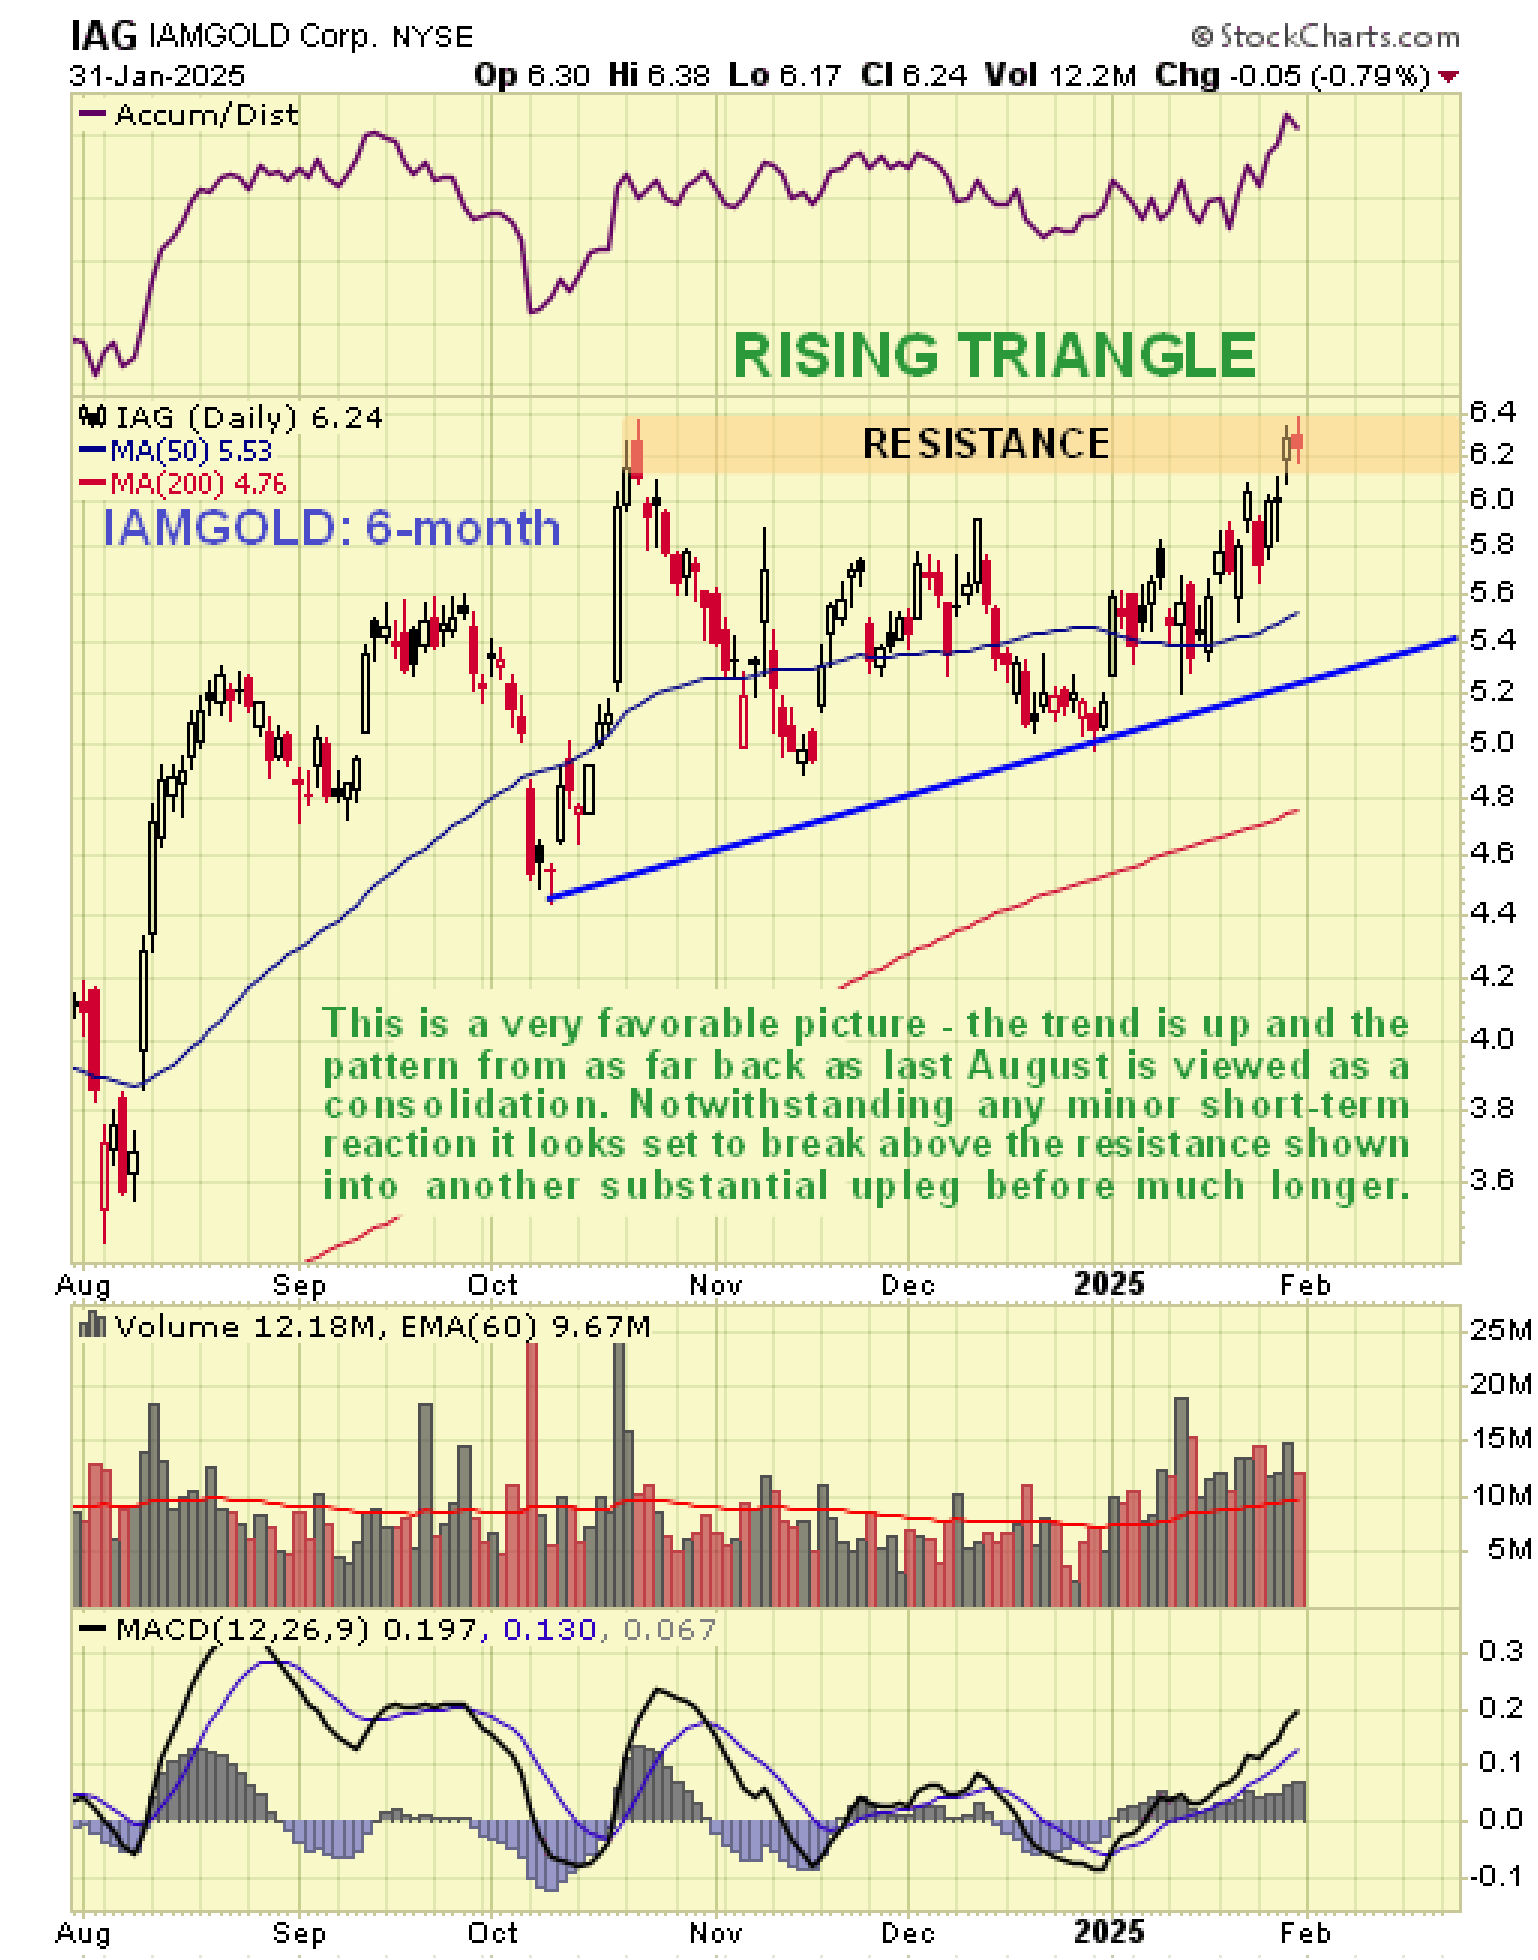
On the 6-month chart we can view the consolidation pattern of recent months in more detail and we can clearly see that it has taken the form of a bullish Rising Triangle that has allowed time for the 200-day moving average to partially catch up to the price. The marked buildup in upside volume in January that has driven the Accumulation line higher suggests that the advance of recent weeks is probably the start of a breakout drive that will see it break above the resistance shown and advance towards the upper boundary of the channel that we looked at on the 2-year chart.
This therefore looks like a good time to buy IAMGOLD which is viewed as a solid mid-cap gold stock investment. Note that there may be a "knee jerk" drop this morning if the sector dips in sympathy with a broad market selloff in response to the Tariff debacle, which would enable purchase at a better price. A comment will be made on these Tariffs later.
IAMGOLD website
IAMGOLD Corp., IAG, IMG.TSX, closed at $6.24, C$9.04 on 31st January 25.
Posted at 7.20 am EST on 3rd February 25.