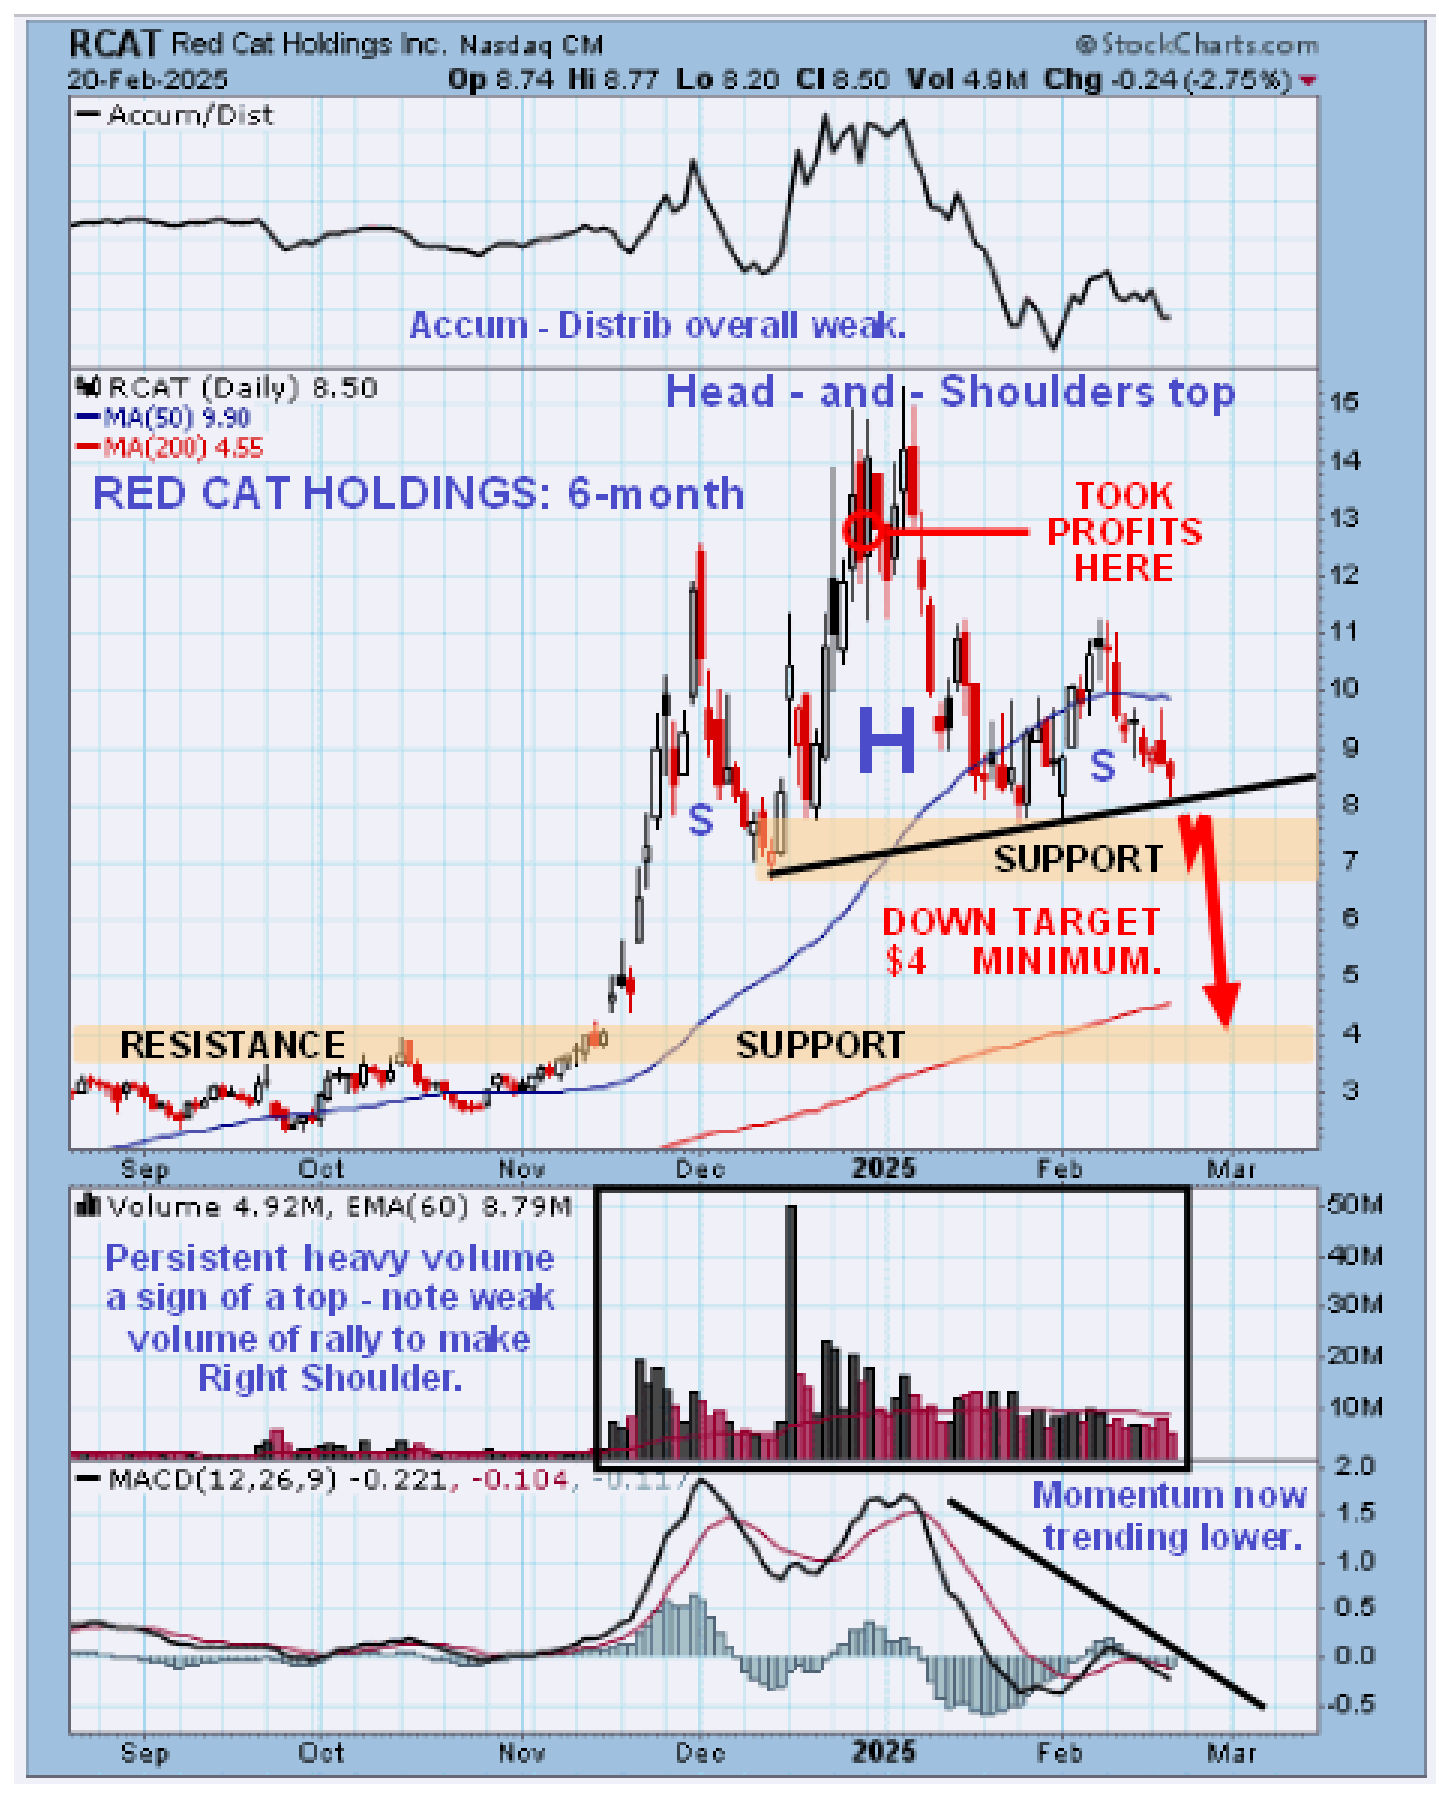
The reason for us looking at the chart of Red Cat here is that it presents what is considered to a be a fine example of a classic Head-and-Shoulders top. The volume pattern is consistent with it being a valid Head-and-Shoulders top, in particular the weak volume on the rally to form the Right Shoulder and the plunging Accumulation line on the drop to complete the right side of the Head of the pattern is viewed as ominous too. A breach of the “neckline” of the pattern, which occurred on Friday after this chart was made and of the support shown is expected to lead to a steep drop that will result in Red Cat’s stock price being quickly cut in half and it’s possible that this will occur against the background of a broad market selloff. So the Red Cat chart may be providing some circumstantial evidence supporting a general market selloff that may be immient after what happened on Friday.
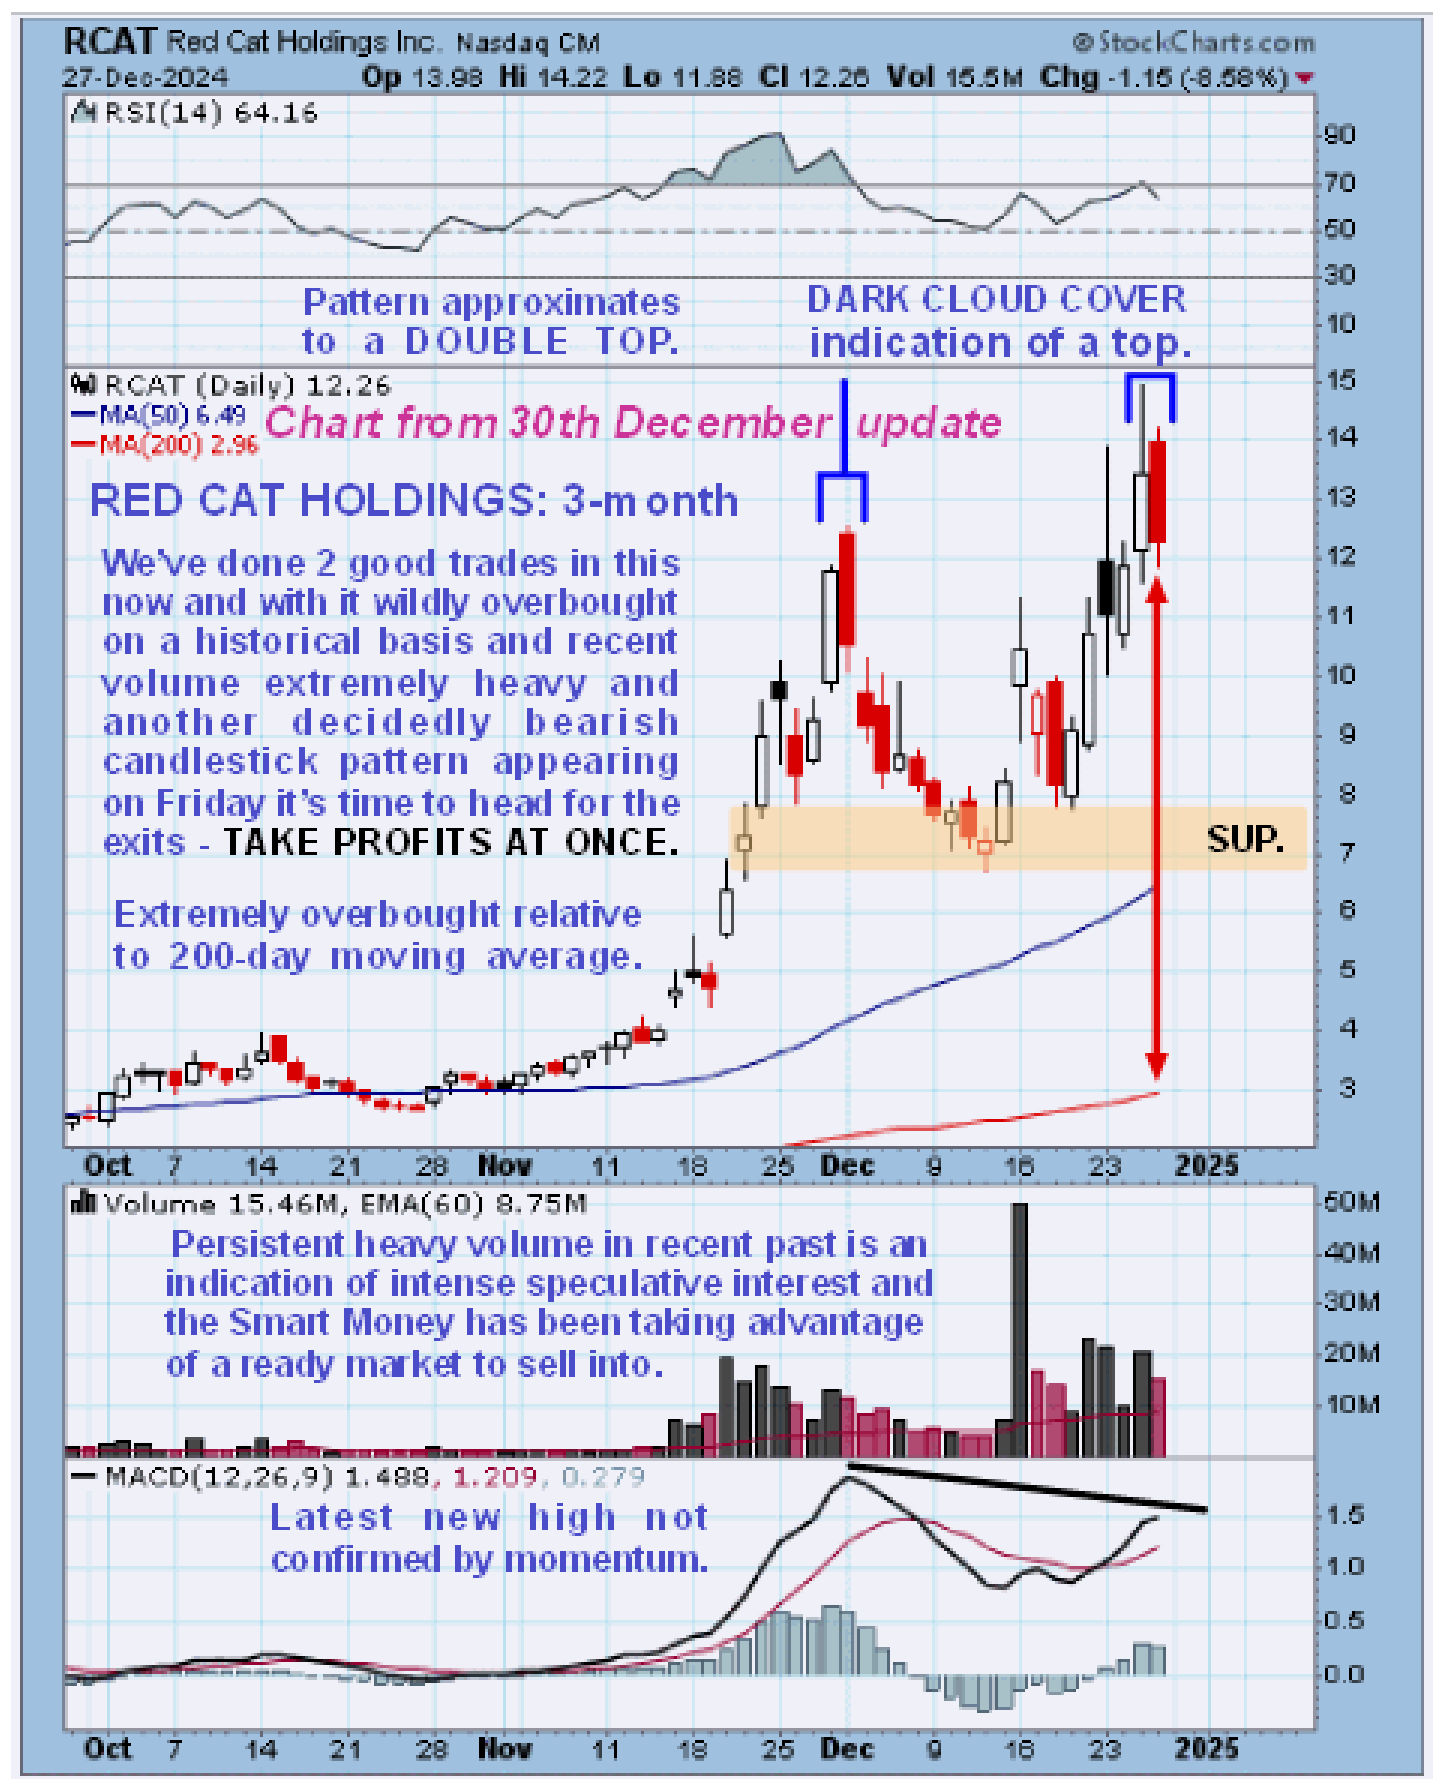
You may recall that we took profits in Red Cat
at the end of December very near to the top of the Head of the Head-and-Shoulders top…
There probably isn’t much you can do with the information presented here, although you could short Red Cat. The reason for this article is for us to look at this fine example of a Head-and-Shoulders top and then see if it plays out as expected.
Red Cat Holdings, RCAT, closed at $7.76 on 21st February 25.
Posted at 6.00 am EST on 23rd February 25.