The purpose of this article is to bring home to the reader that the Precious Metals sector is probably on the verge of a massive epochal advance that will dwarf anything seen before – if my calculations are correct we are on the verge of a “crack-up boom” in the PM sector. So far, what we have seen may be described as a “stealth” bull market with big gold stocks “only” doubling in price since early last year and the rest of the sector dragging along relectantly behind – this looks set to change, and fast.
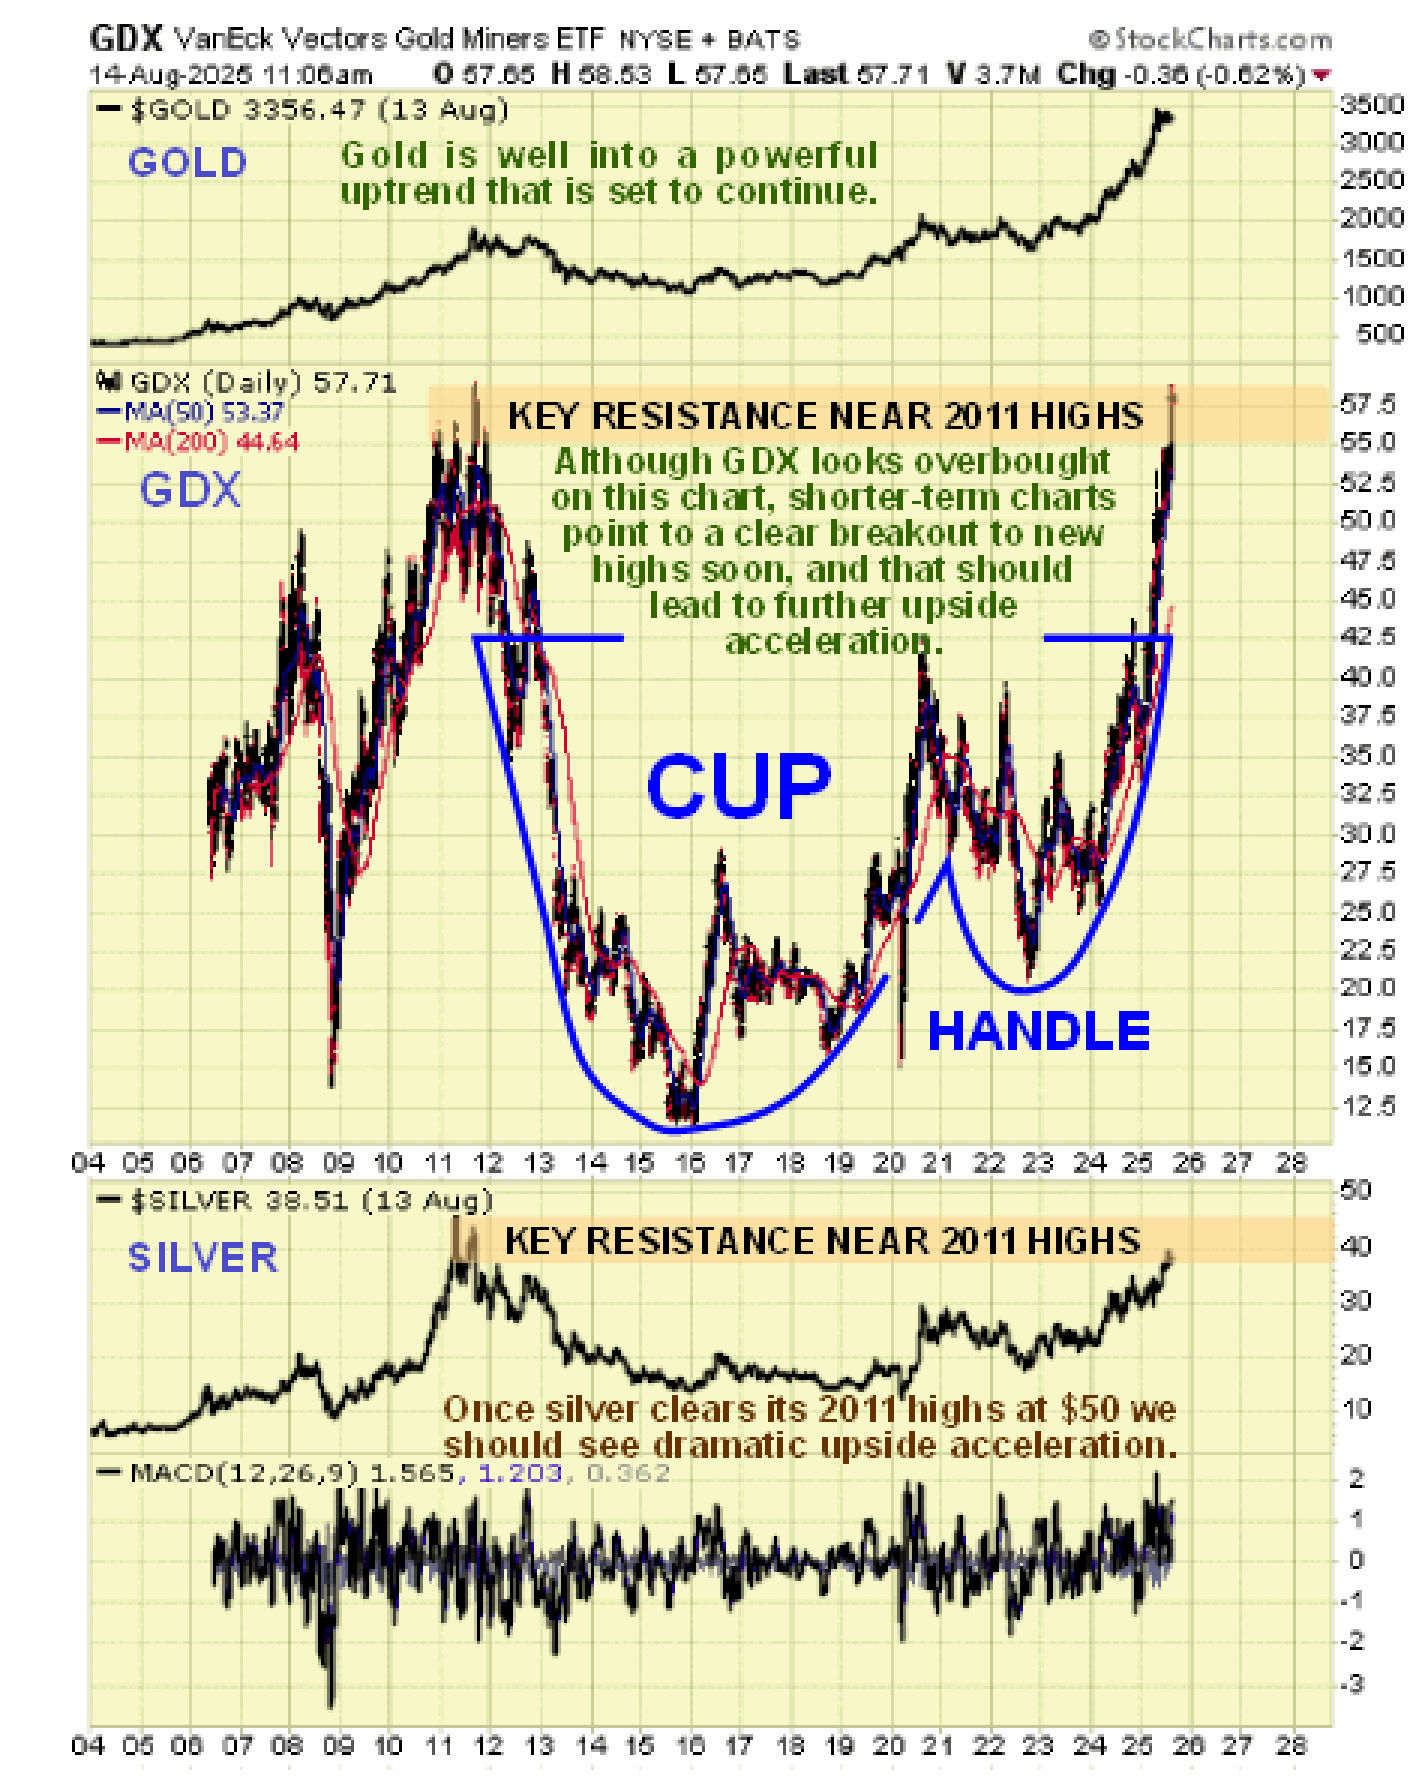
To this end we will start by looking at the long-term chart for the VanEck Vectors Gold Miners ETF, code GDX that dates back to before it started trading in 2006 which for comparison has the gold and silver charts for the same period appended at the top and bottom. A key point to note is that GDX has just arrived at its highs attained at the peak of the great 2000’s PM sector bull market which topped out in 2011 following the breakout early this year from the giant Cup & Handle base pattern shown. What this means is that PM stocks as represented by GDX are at the same value now as they were in 2011 so they have gone nowhere for 14 years even as gold has risen by about 75% during the same period. But aren’t PM stocks supposed to amplify the gains made by the Precious Metals, especially gold? – they are, and this means that they have got some serious catching up to do. On this chart GDX does look overbought following its gains from early last year, but not when we factor in gold’s huge rise during the same period. Before leaving this chart there are a couple of other important points to note. One is that GDX has had to cope with some residual resistance in this area associated with the old highs, especially as this is also true with the large stock XAU gold and silver index, but the HUI index has not yet arrived at its 2011 highs which reflects the fact that the large cap stocks have been the star performers so far, which is normal during the early stages of a major bull market – many smaller stocks have yet to really join in this bull market. The other point is that silver (shown at the bottom of this chart) is limbering up to break out to new highs and its breakout may be coincident with or follow soon after the breakout to new highs by GDX and the XAU index.
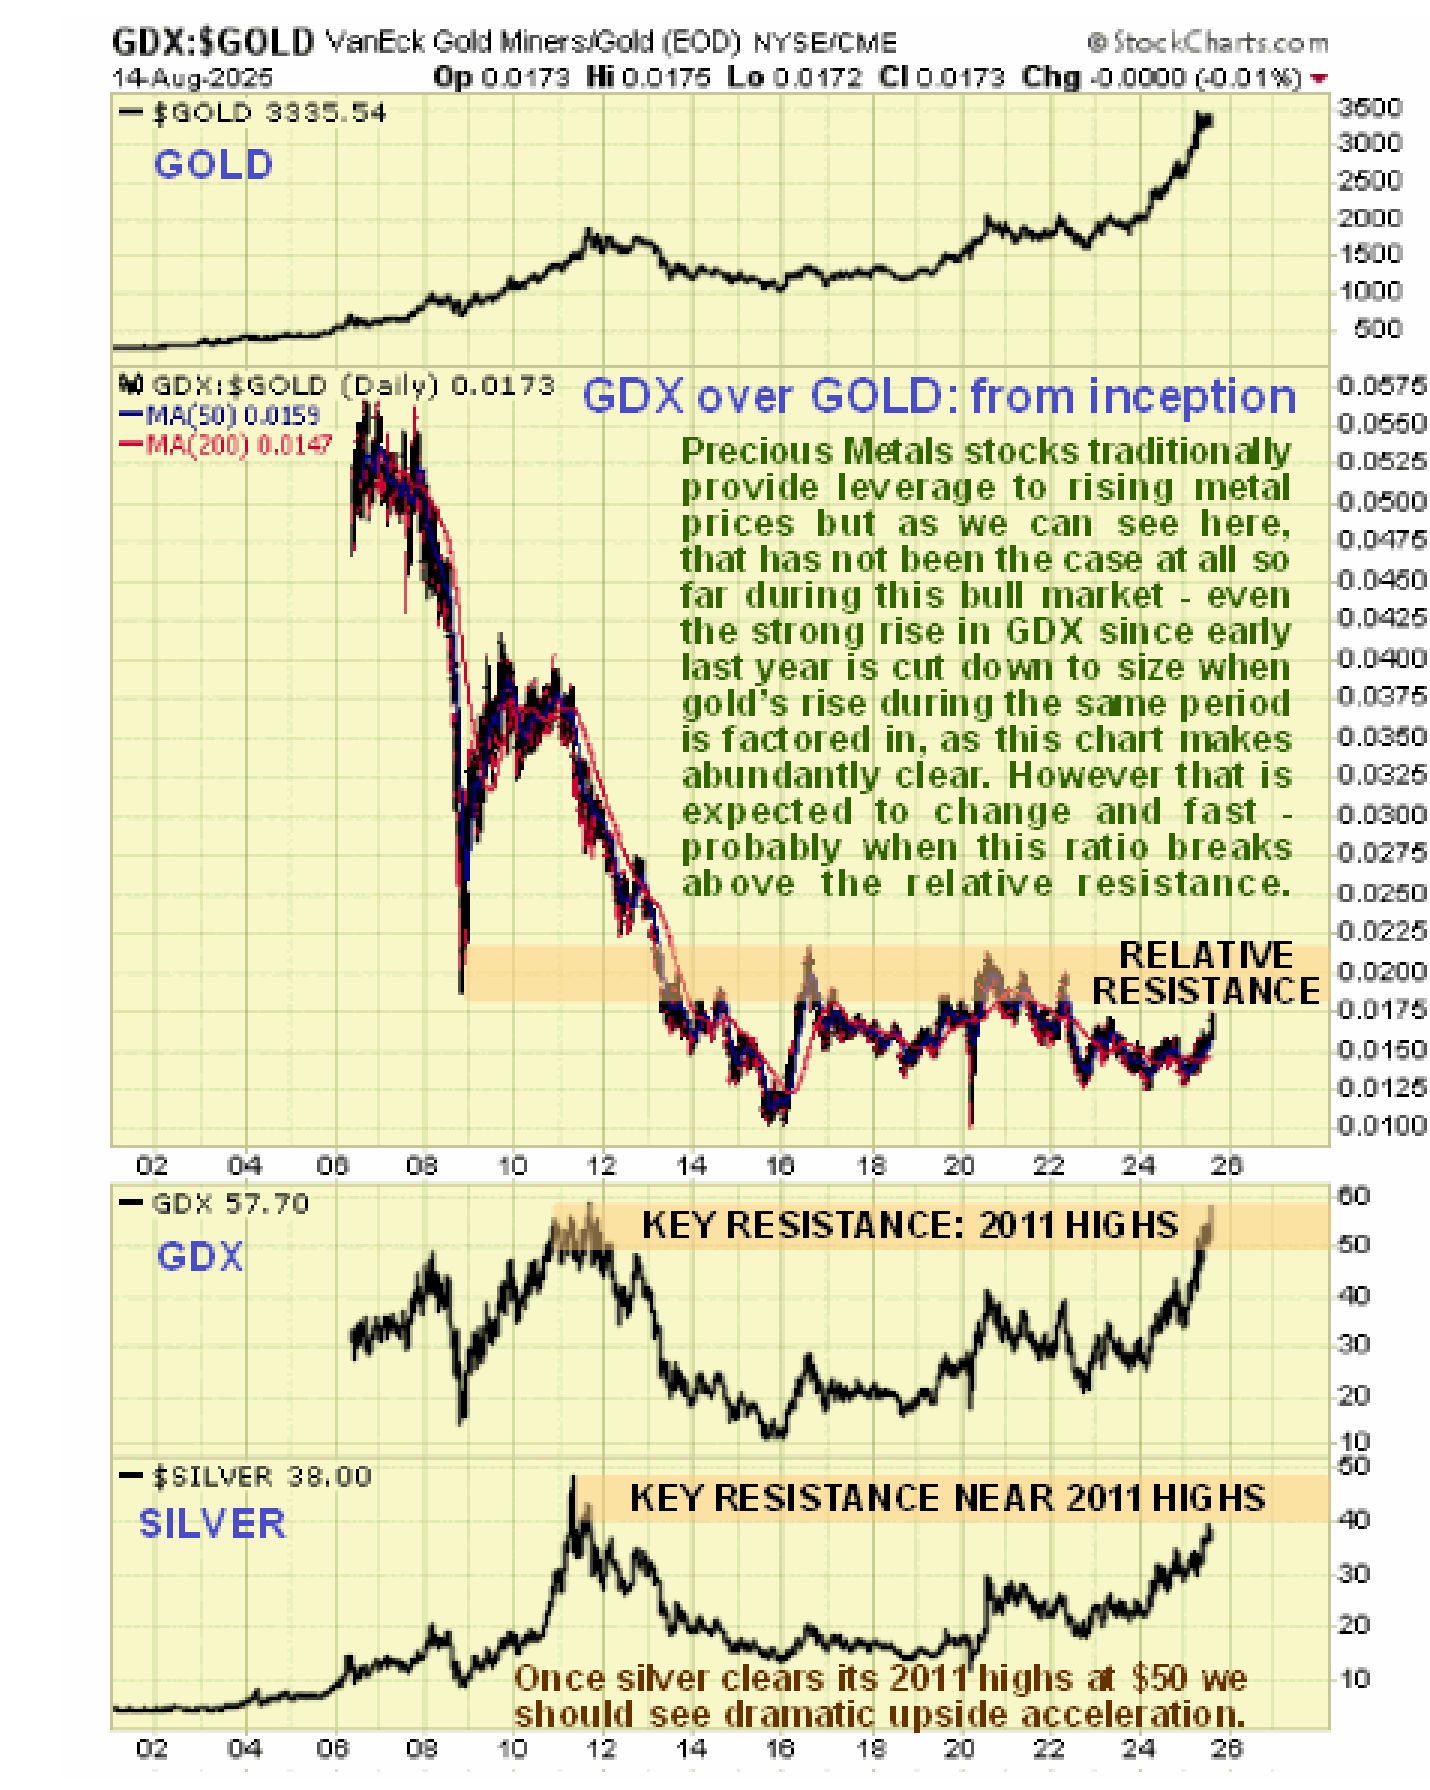
The notion that PM stocks are overbought here and vulnerable to a downturn, understandable when you look at the GDX chart alone without reference to the gold price or other factors, is very quickly dispelled by our next chart, which shows the performance of GDX relative to gold going back again to 2006. We see here that GDX – and thus PM stocks – are still at very low valuations relative to gold itself, with their advance so far this year “barely moving the needle” which is because gold has risen so strongly this year. Given that PM stocks are supposed to substantially outperform the metals during a sector bull market, it is clear that the sector still has a long, long way to go on the upside, a point that is doubly emphasized by the still very low silver to gold ratio as highlighted in the last Silver Market update. In other words this unprecedented sector bull market is still in its early stages.
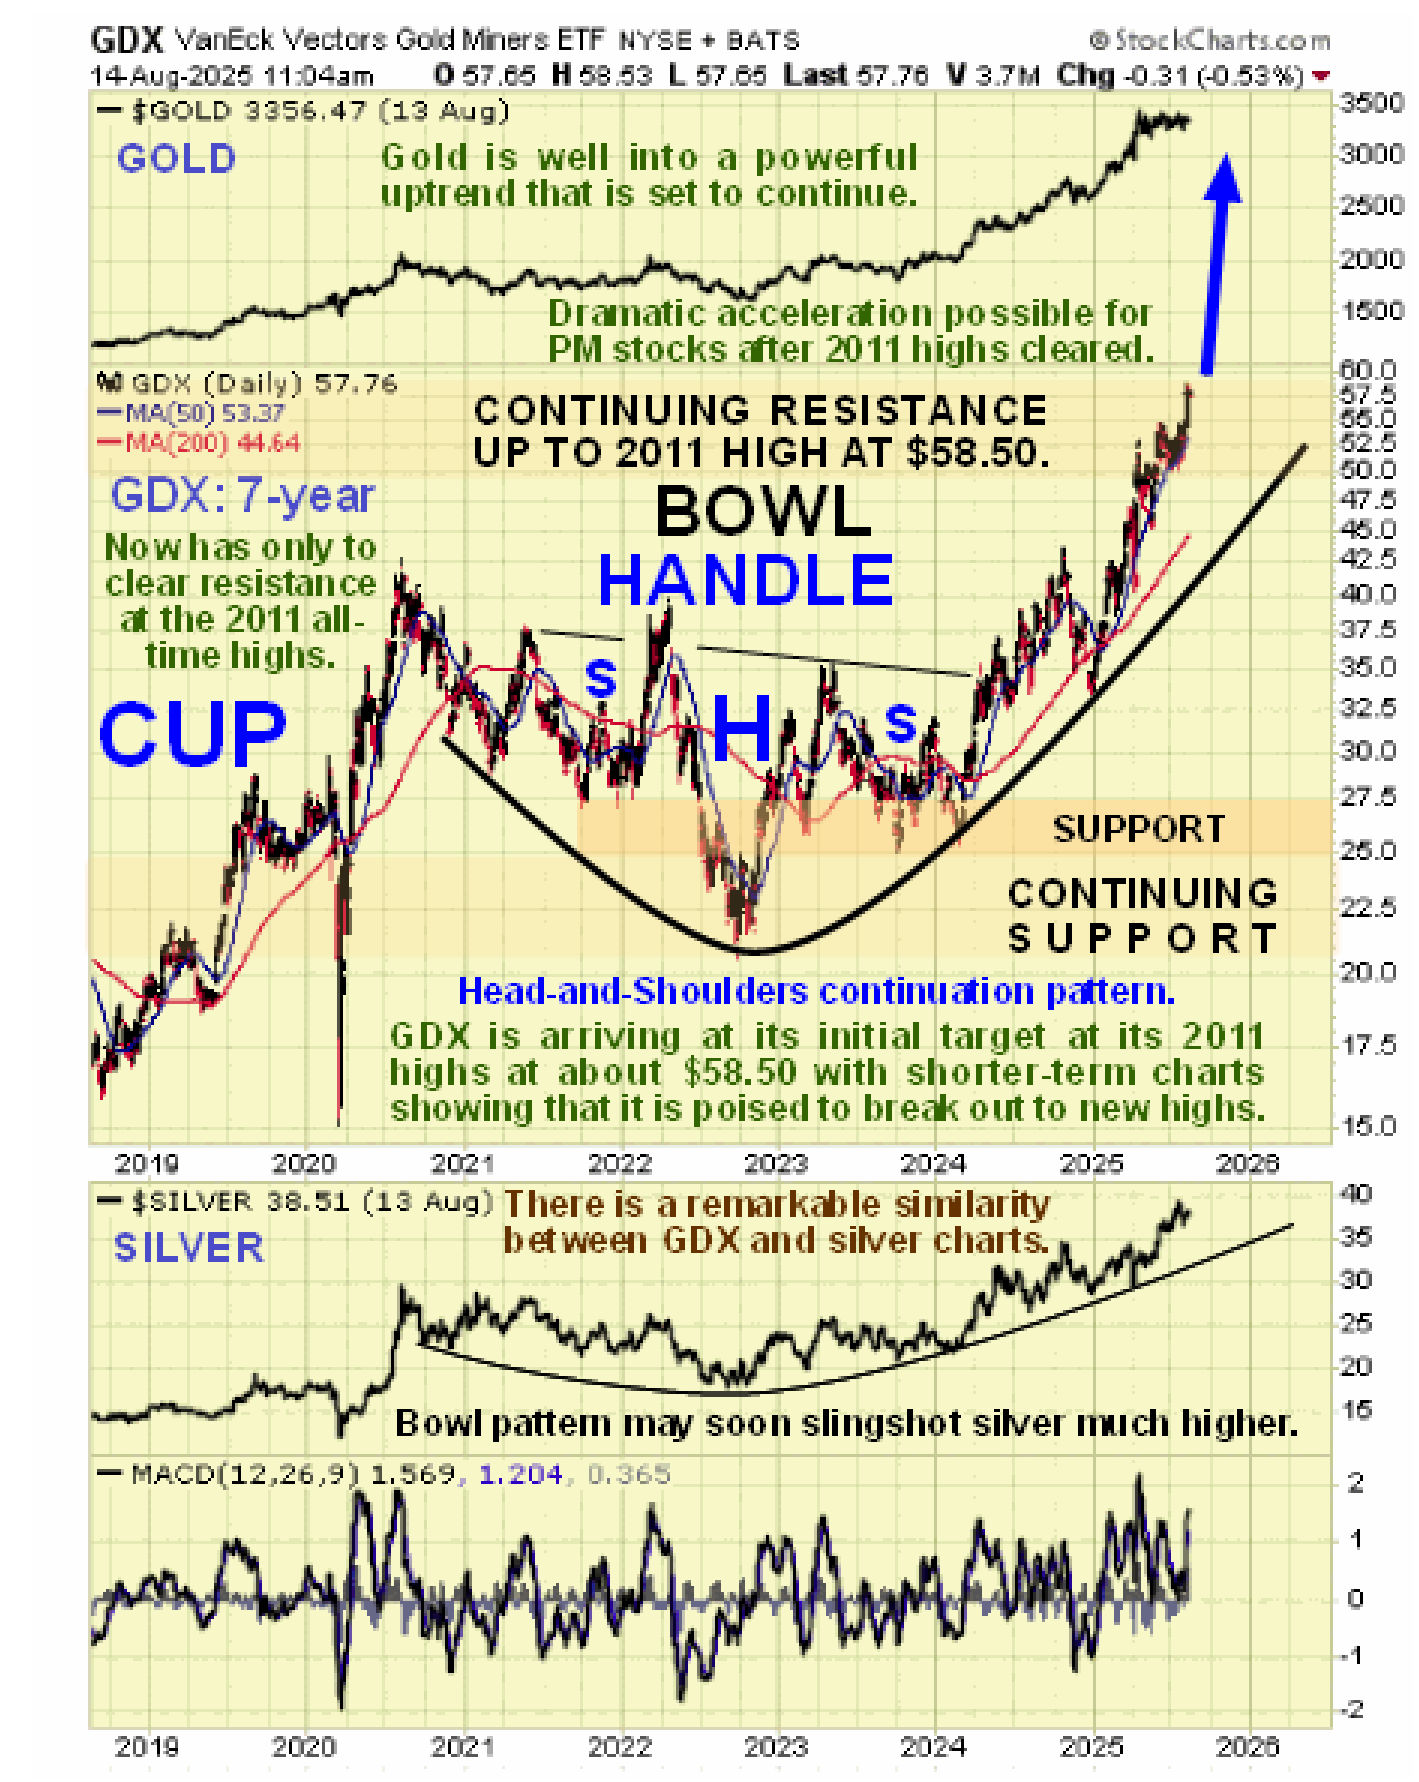
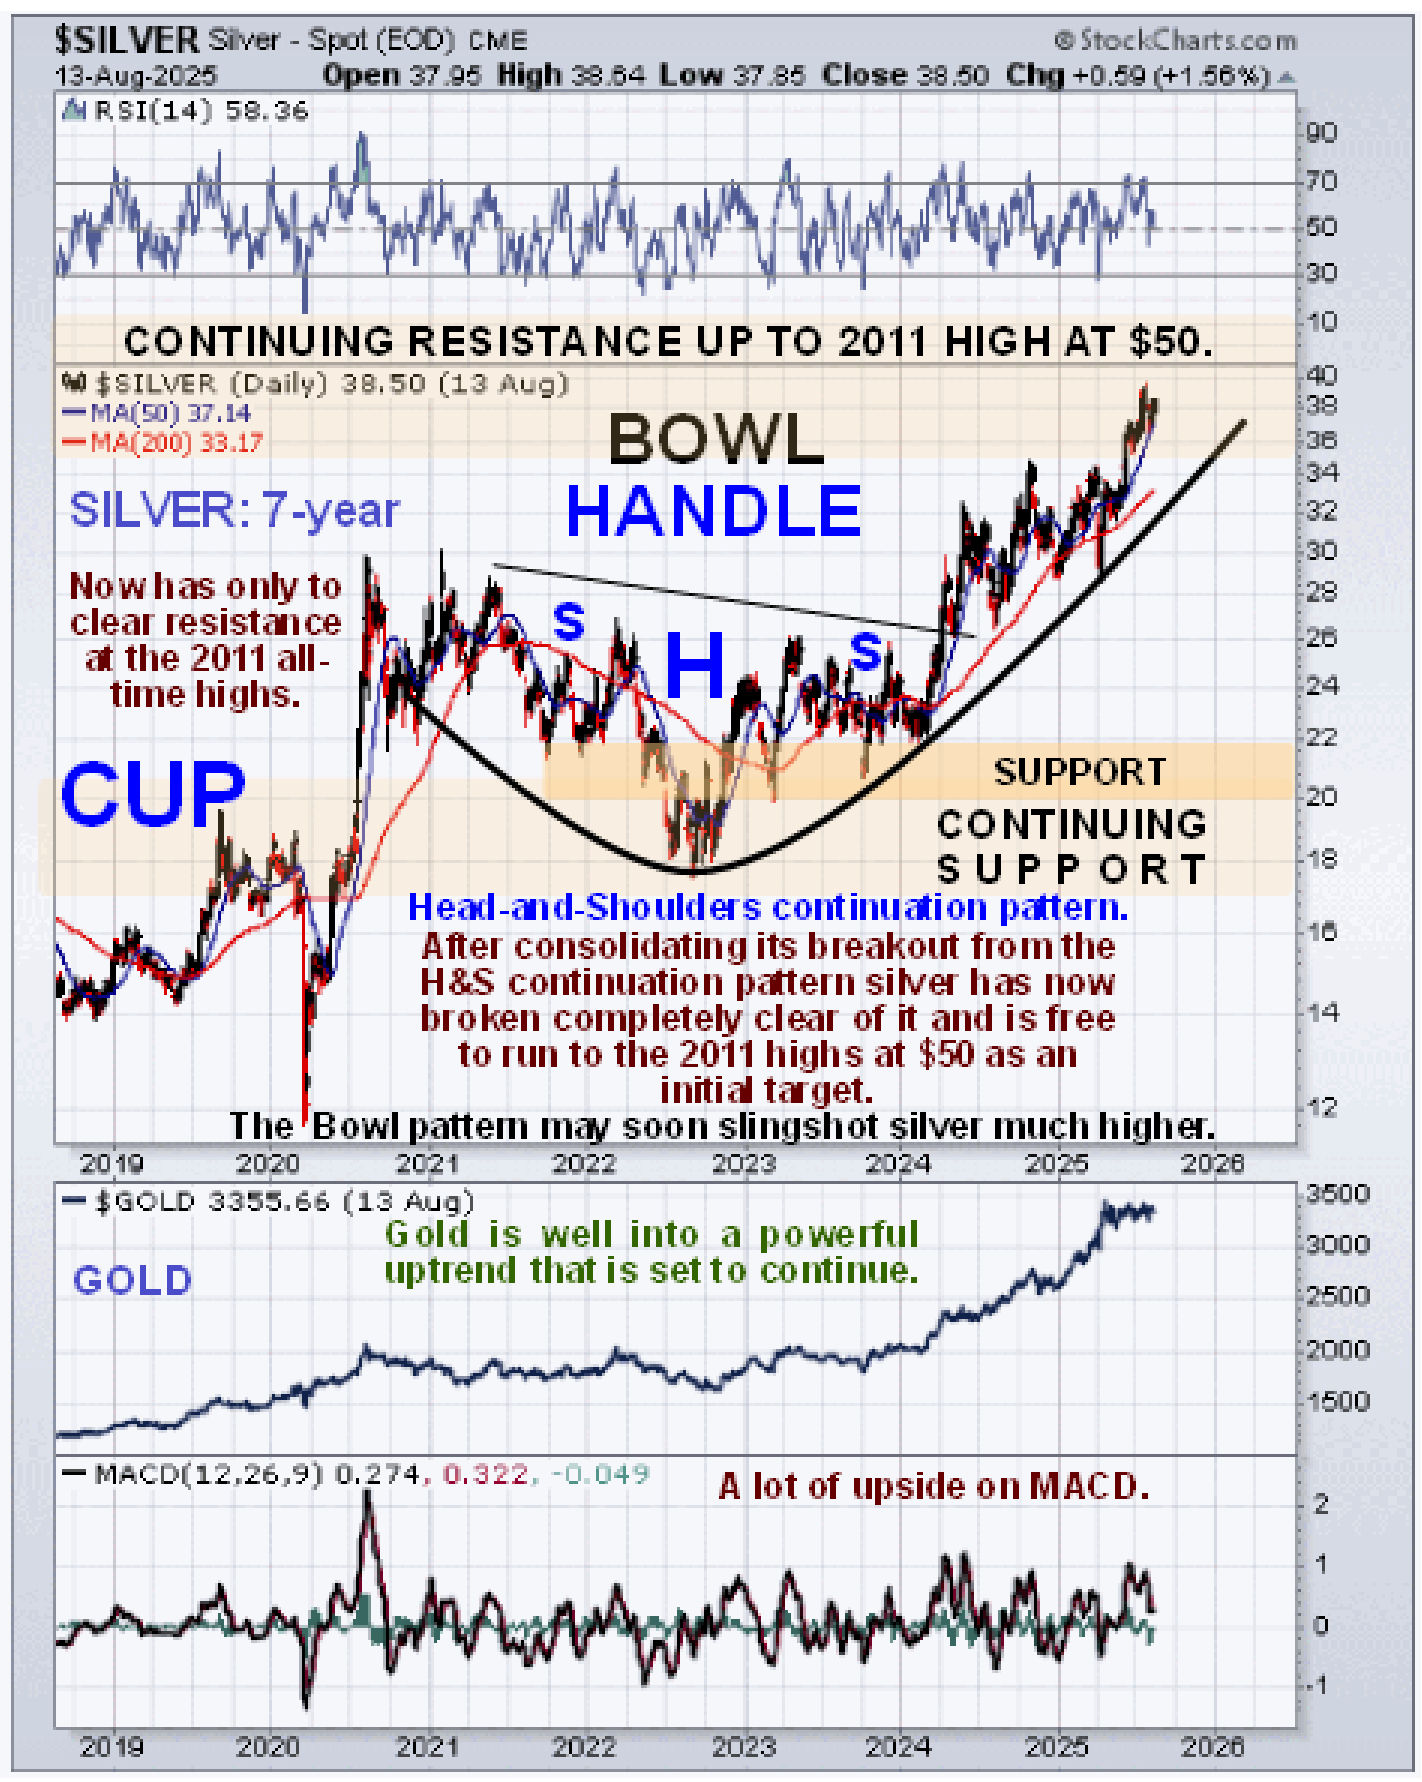
The 7-year chart for GDX reveals that the “”Handle” part of the giant Cup & Handle base pattern shown on the long-term chart is comprised of a large Head-and-Shoulders continuation pattern. Furthermore, we can see that this pattern is contained by a large Bowl structure that is now shepherding the price at an increasingly rapid rate towards a breakout to new highs, and it is no coincidence that a similar Bowl pattern is driving the silver price towards a breakout to new highs above $50 at the same time, as we can see on the silver chart for the same timeframe stacked below…
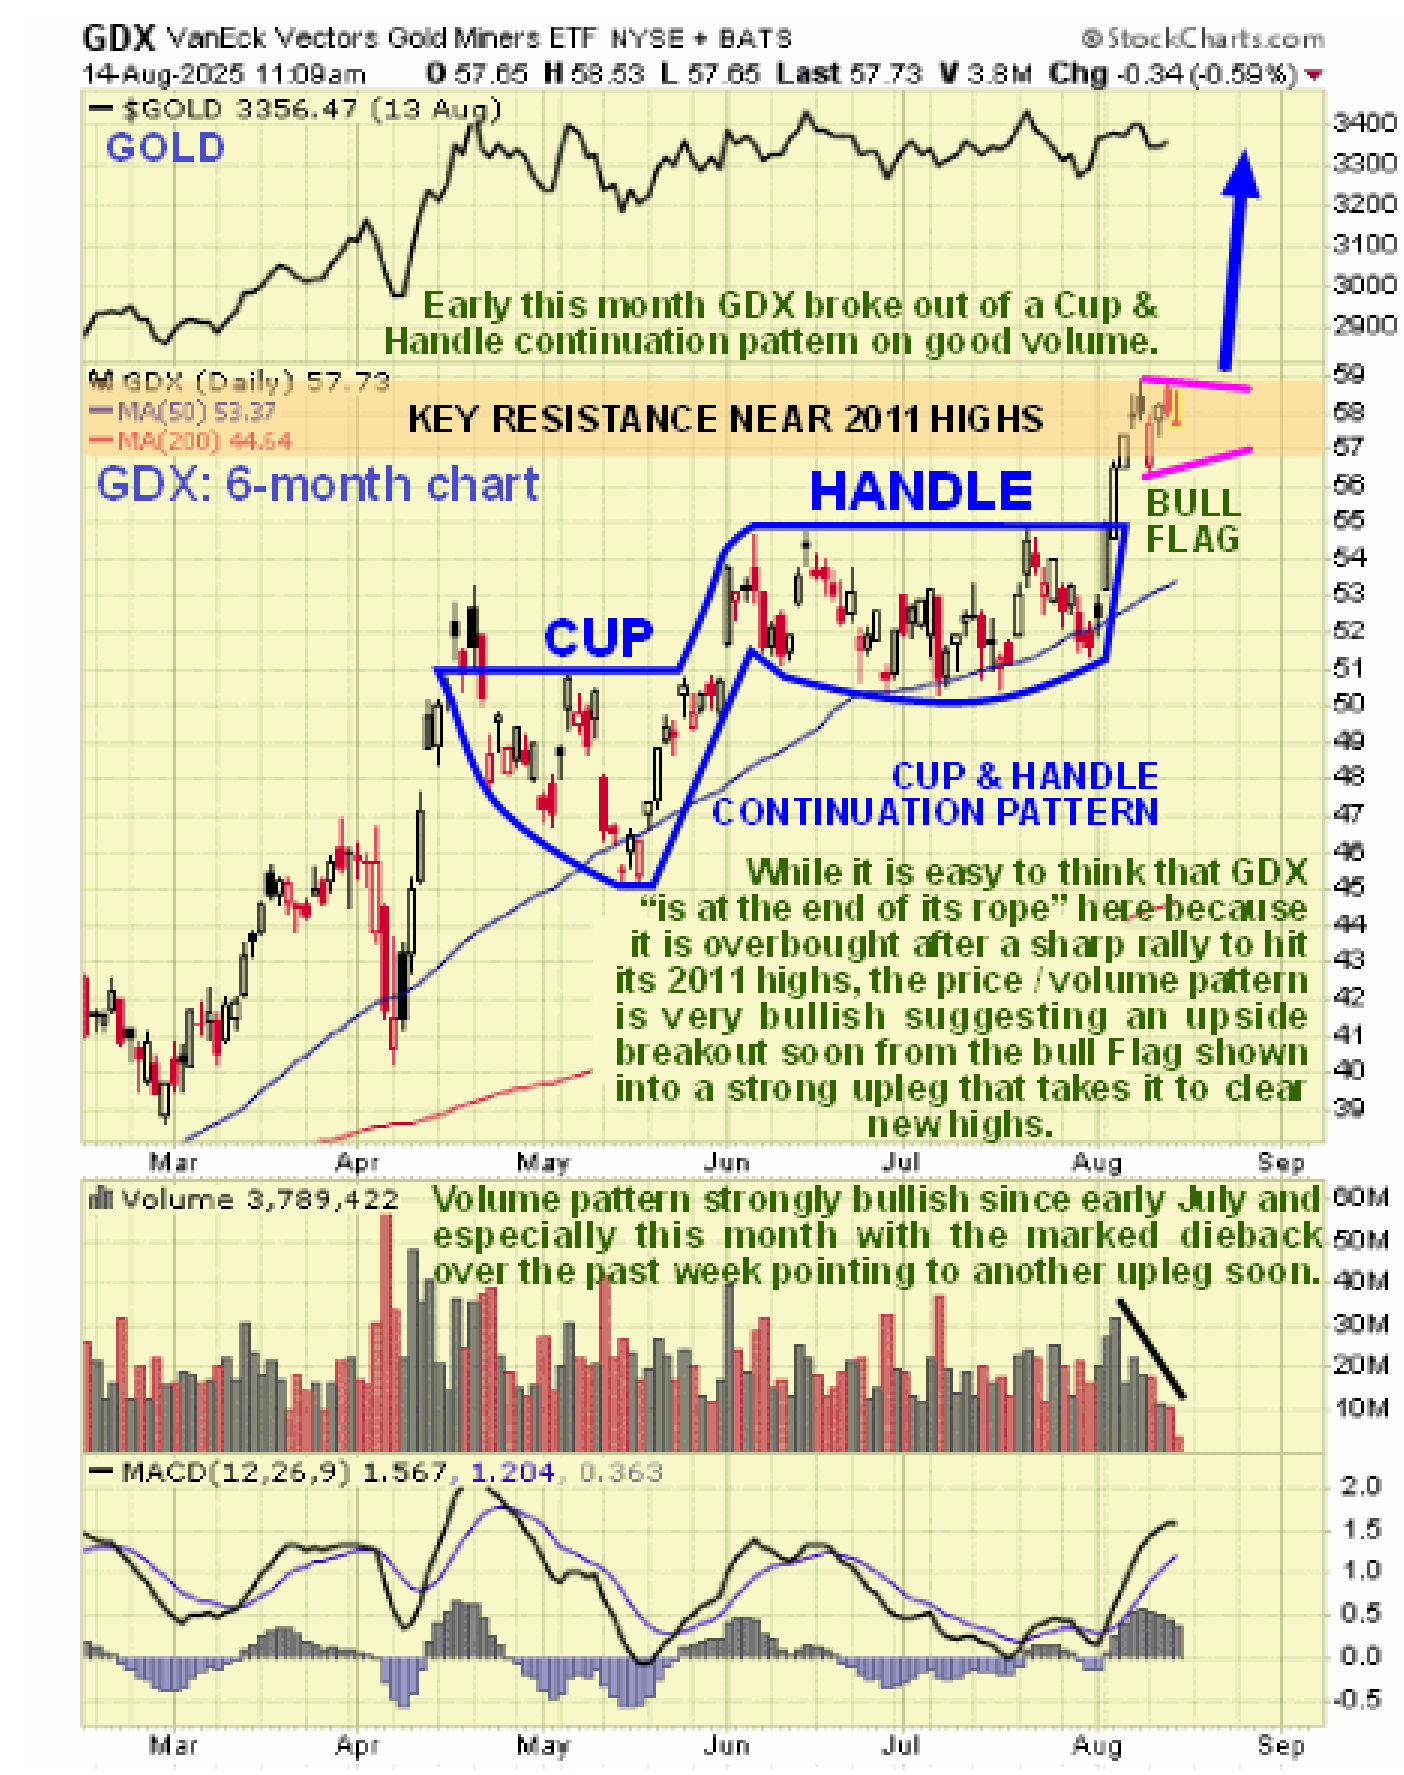
On this occasion the 6-month chart for GDX provides valuable guidance regarding the chances of it breaking out decisively to new highs soon. On this chart we can see how, early this month, GDX broke out of a Cup & Handle continuation pattern that formed within the uptend and rose sharply on strong volume, a development that was presaged by the increasing upside volume since early July and the uptrending Accumulation line (not shown) resulting from this. Over the past few days the price has been consolidating this rally up to the last resistance associated with the 2011 highs within a tight range and the marked volume dieback as this has happened is a strong sign that a small bull Flag / Pennant is forming that will soon lead to another sharp upleg, similar to the one leading into this pattern and probably greater given that it will result in GDX achieving new highs, with a probable price track shown on the chart.
In conclusion, it looks like GDX, the XAU gold and silver stocks index and silver will all break out to new highs soon, and this development should spark upside acceleration in gains across the sector that could be dramatic. What about the possibility of a stock market crash triggering a broad selloff that causes collateral damage to the sector as in 2008? This is viewed as much less likely than it was back then, regardless of the state of the economy, the reason being that the vast percentage of stocks are concentrated in the hands of the super-wealthy and the likes of Blackrock and Vanguard and any amount of money will be spirited into existence to keep it propped up with the severe inflation or even hyperinflation resulting only being a problem for the little people. This is said with an awareness that at some point they may “pull the plug” and allow a credit lockup or freeze to occur when they are ready to push the population into the CBDC system which looks set to be privatized via such products as Stablecoin, in order that they can evade accountability. However, this appears to be some way off yet.
End of article.
Posted at 5.45 am EDT on 15th August 25.