Fundamentally, CleanTech Vanadium Mining Corp is attractive here because it is a critical minerals exploration and development company which has two projects located in the US and one in Bolivia. Vanadium prices are up 150% since Jan 2024. Fluorspar (aka Fluorite) in Kentucky is a key metal used to enrich uranium and interestingly, Honeywell is planning to reopen a uranium conversion plant just 52 miles away. No producing vanadium or fluorspar mines currently exist in USA. In addition the gold –silver - zinc project in Bolivia has reported some good grades.
Technically, its stock is attractive here because it is at a very low price with evidence of persistent aggressive accumulation in the recent past which we will now proceed to look at.
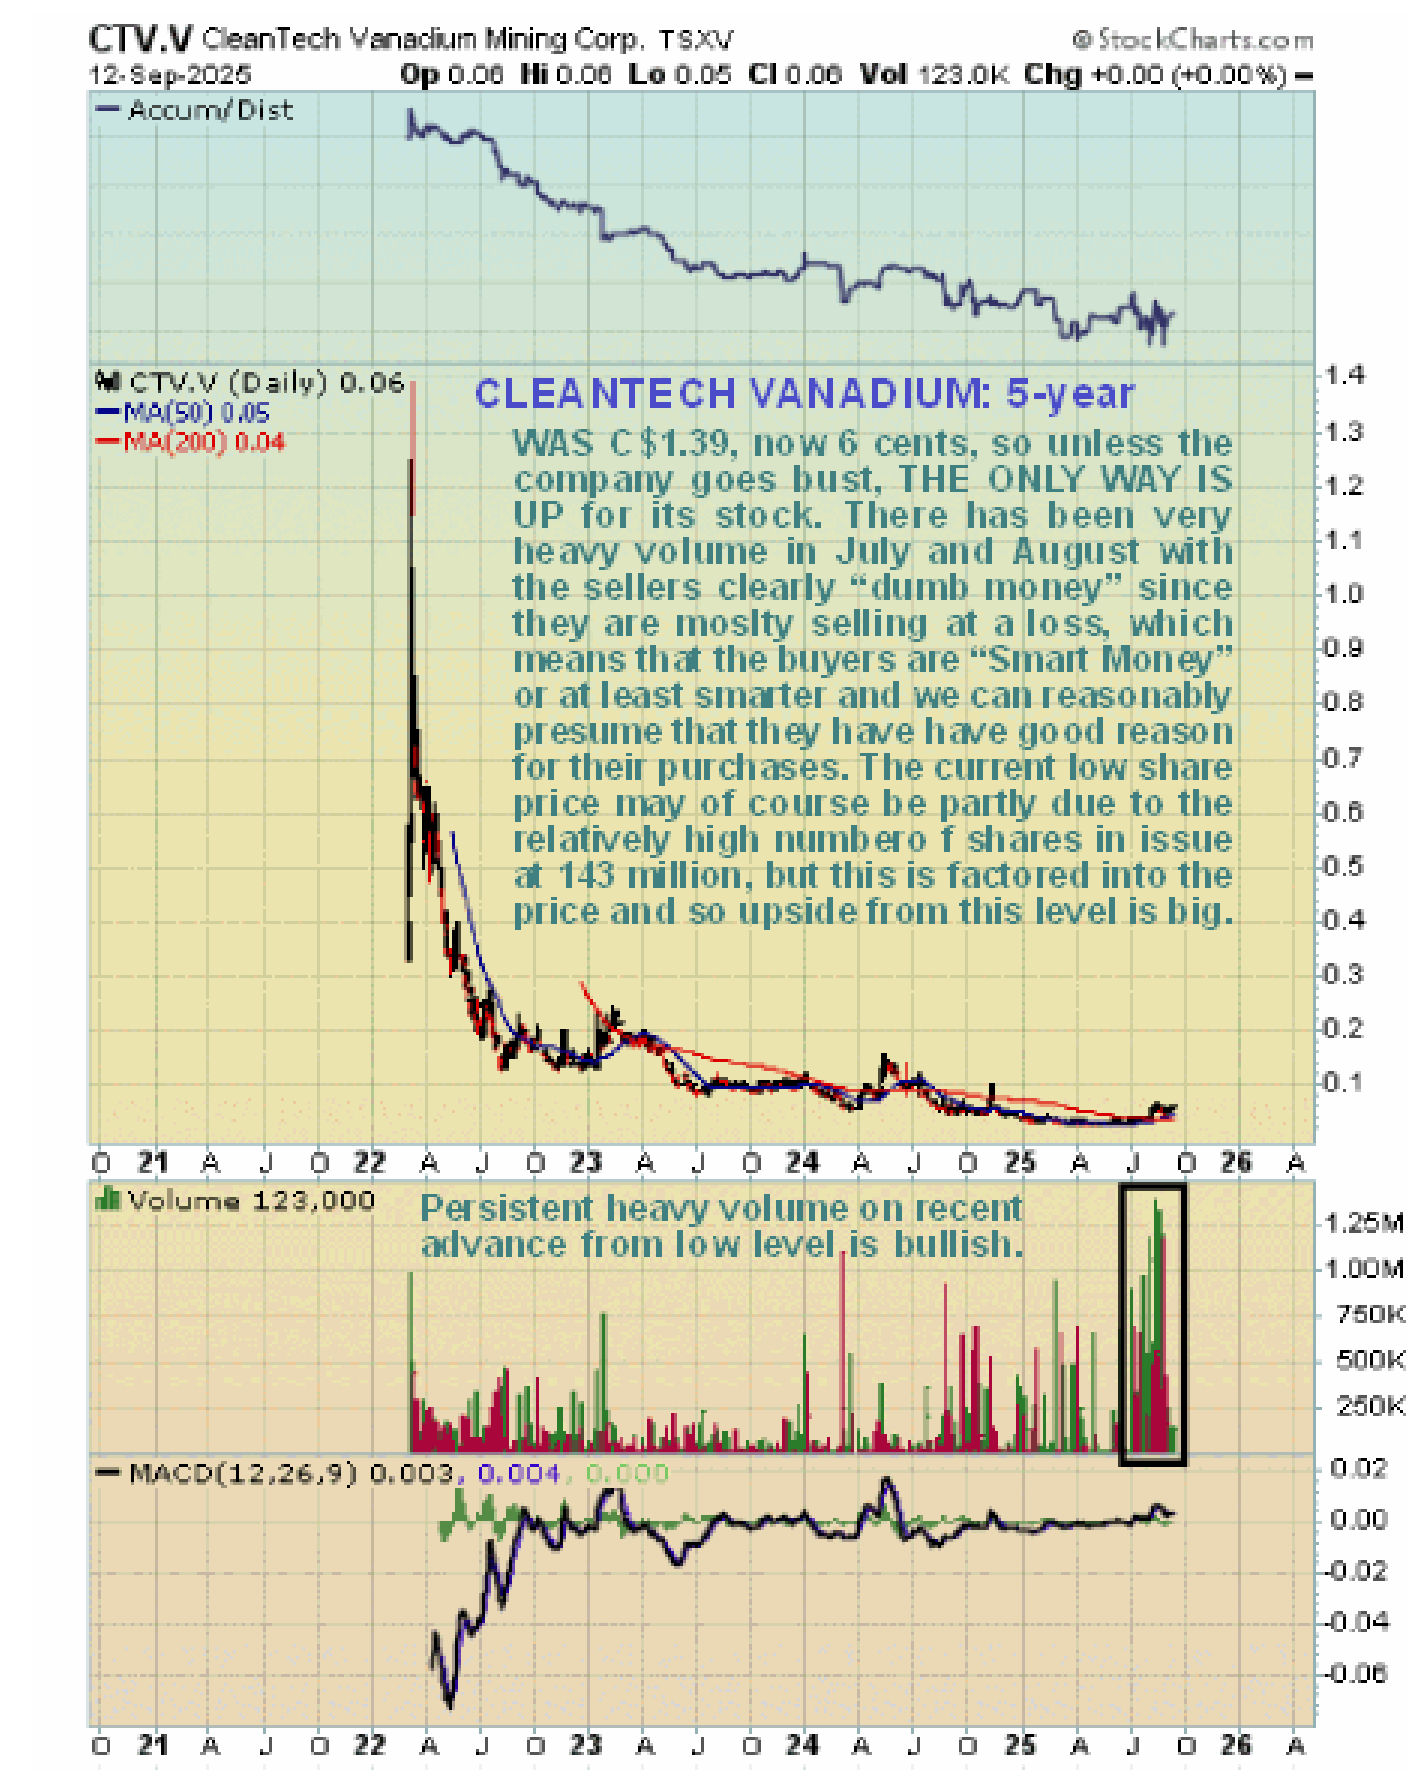
We will start with the longer-term 5-year chart which shows the entire history of the stock from when it started trading in 2022. As we can see, apart from an initial dramatic spike, it has been “downhill all the way” as after almost touching C$1.40 it plunged which marked the start of a long and corrosive bear market that ended in March of this year with it hitting bottom at the miserable price of just 2.5 cents. Before leaving this chart we can just see the improvement in price in the recent past but more importantly that this was accompanied by heavy volume which in this position is bullish.
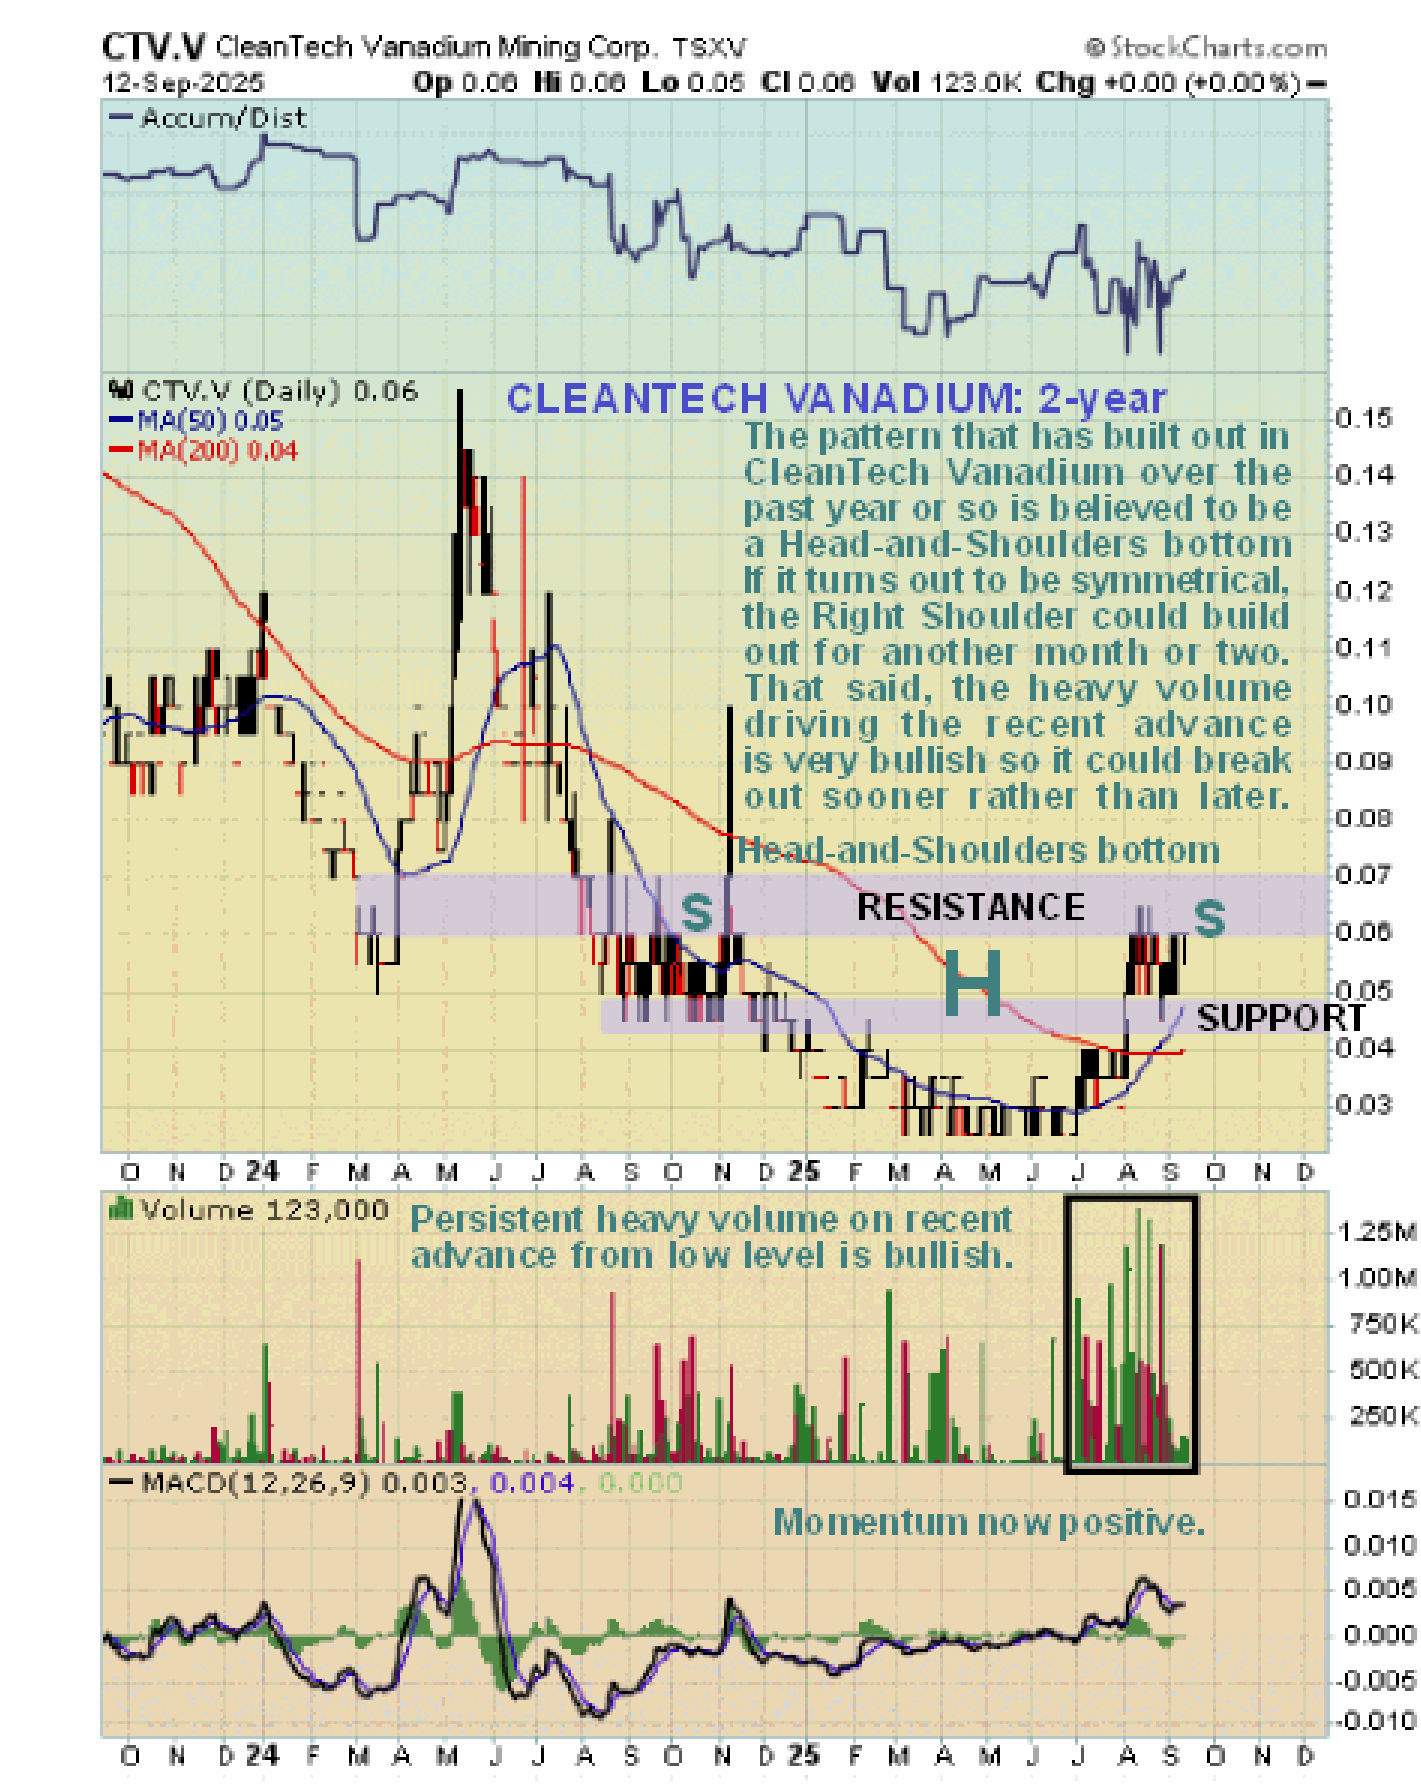
Zooming in closer, a 2-year chart enables us to detect that a potential Head-and-Shoulders bottom has been building out for a year now with the Left Shoulder of the pattern forming in the Fall of last year, way before it hit bottom in March. This pattern is approaching completion although it is clear that if it maintains symmetry, the current Right Shoulder could build out for another month or two before it breaks out. However the persistent aggressive accumulation of the stock over the past 10 weeks is viewed as very bullish, especially as volume has died back markedly as the price has consolidated over the past couple of weeks, so it may not hang around for that long before it breaks out – it could break much sooner than that and even imminently. Recent price / volume action is easier to see on a 1-year chart so we will now move on to look at that.
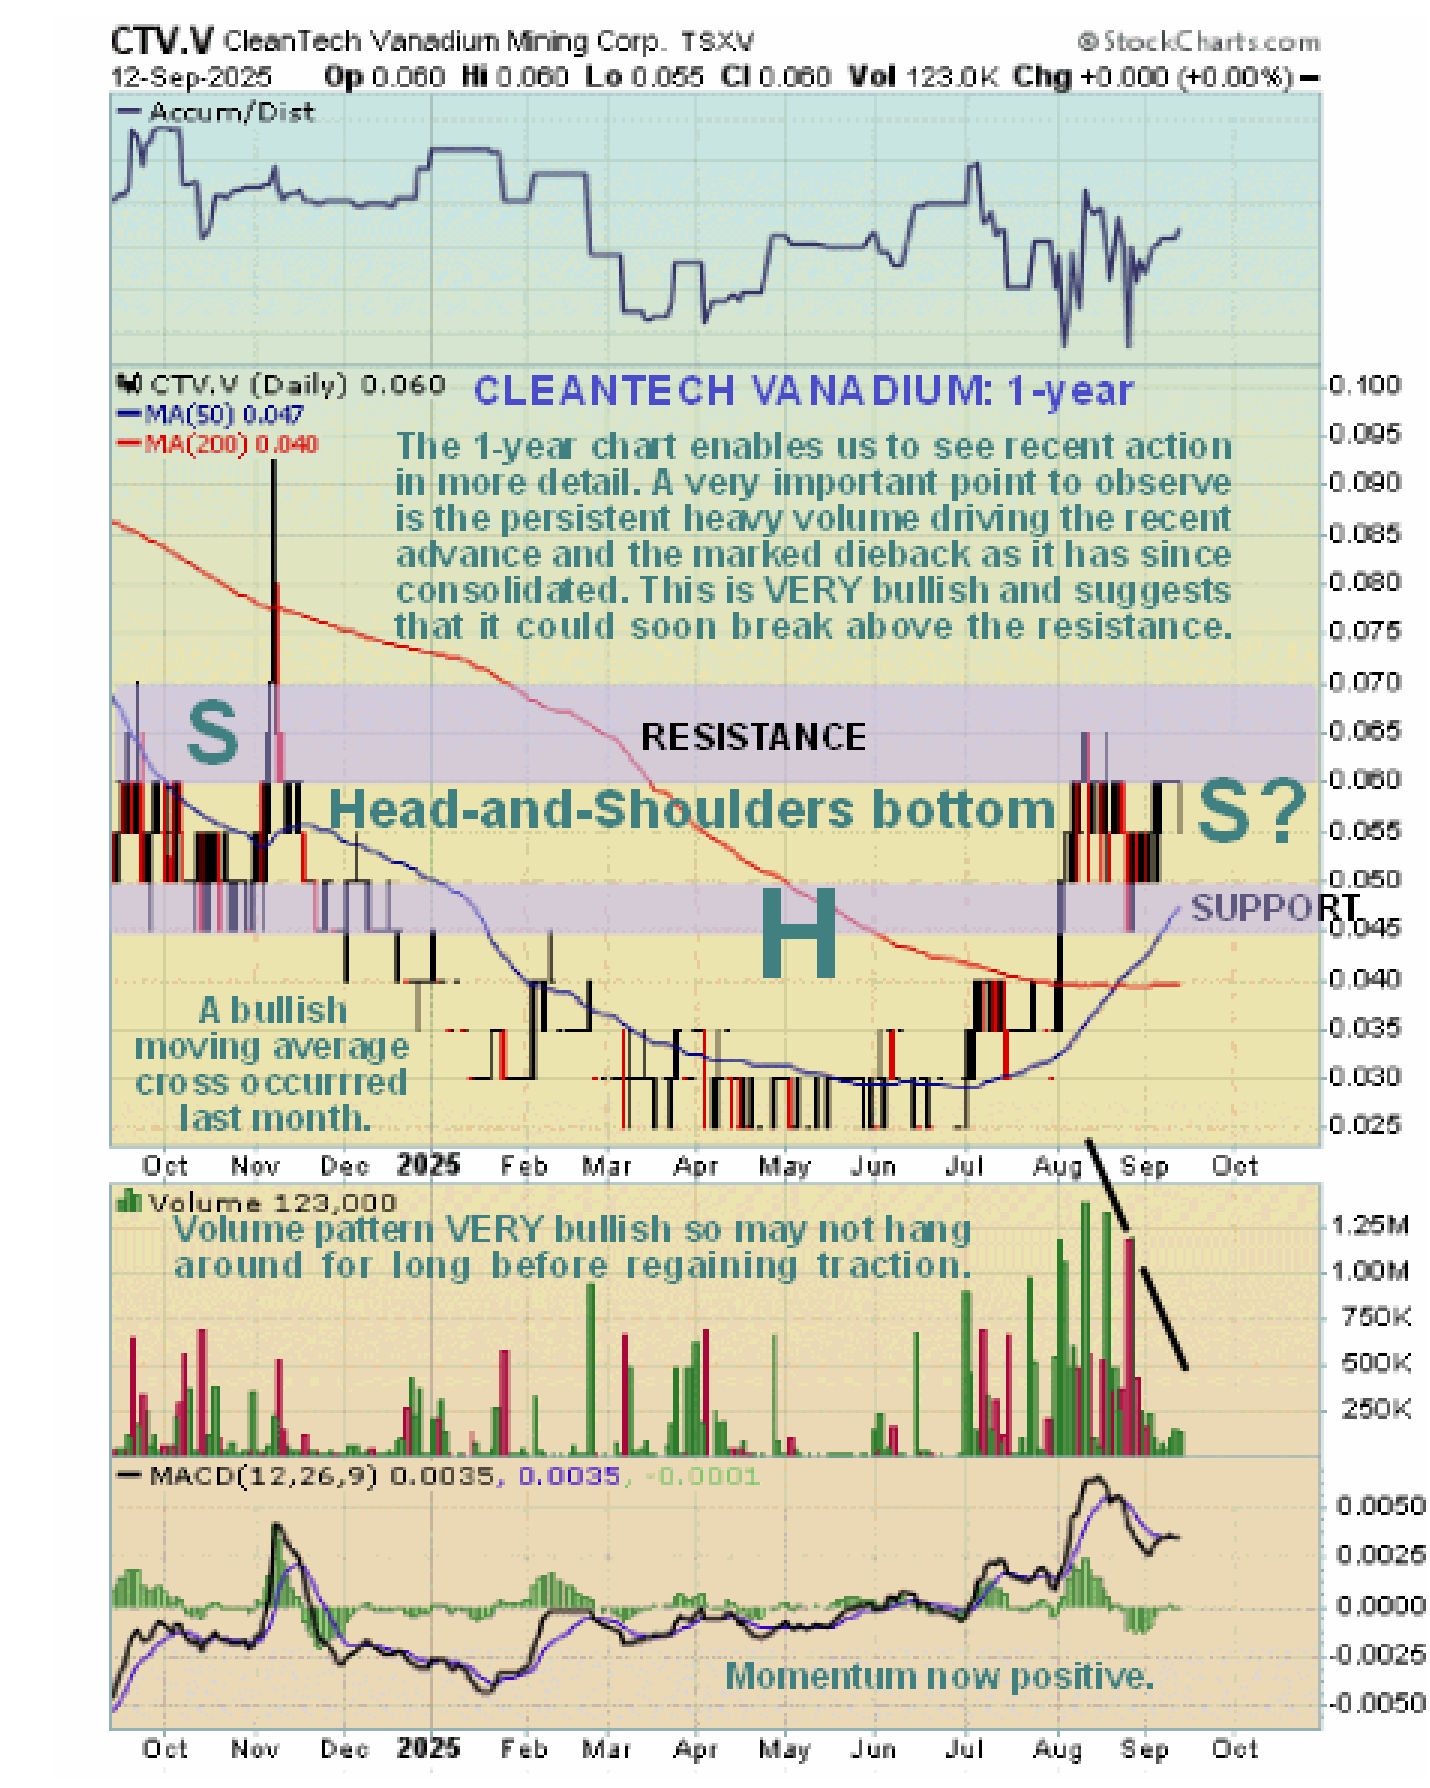
On the 1-year chart we can see that the sharp high volume rally early in August to complete the head of the supposed H&S bottom has been followed by several weeks of consolidation that has allowed the earlier overbought condition to partially unwind and time for the rising 50-day moving average to catch up with the price and in the middle of August a bullish cross of the moving averages occurred, setting the stock up to break out into a major new bull market, although as mentioned above it may want to spend more time completing a synmmtrical Right Shoulder, but again as mentioned above the very bullish volume pattern suggests that it is unlikely to tarry for long in this area before it breaks out. The “official” start of the bull market will be signaled by it breaking clear above the resistance marking the upper boundary of the H&S bottom, i.e. when it gets above 7 cents and a break above this level is expected to occur on high volume which is what we will want to see.
The conclusion is that CleanTech Vanadium is a most attractive critical minerals stock here with big upside from its current low price, especially in percentage terms, and it therefore viewed as a strong speculative buy with an awareness that there is some chance that it will hang around in this price area perhaps for a few weeks before it breaks higher.
CleanTech Vanadium website
CleanTech Vanadium Mining Corp., CTV.V, CTVFF on OTC, closed at C$0.06, $0.042 on 12th September 25.
Posted at 8.20 am EDT on 15th September 25.