The purpose of this article is to make it clear why the Precious Metals sector correction is far from over and has considerably further to run, both in terms of price drawdown and time.
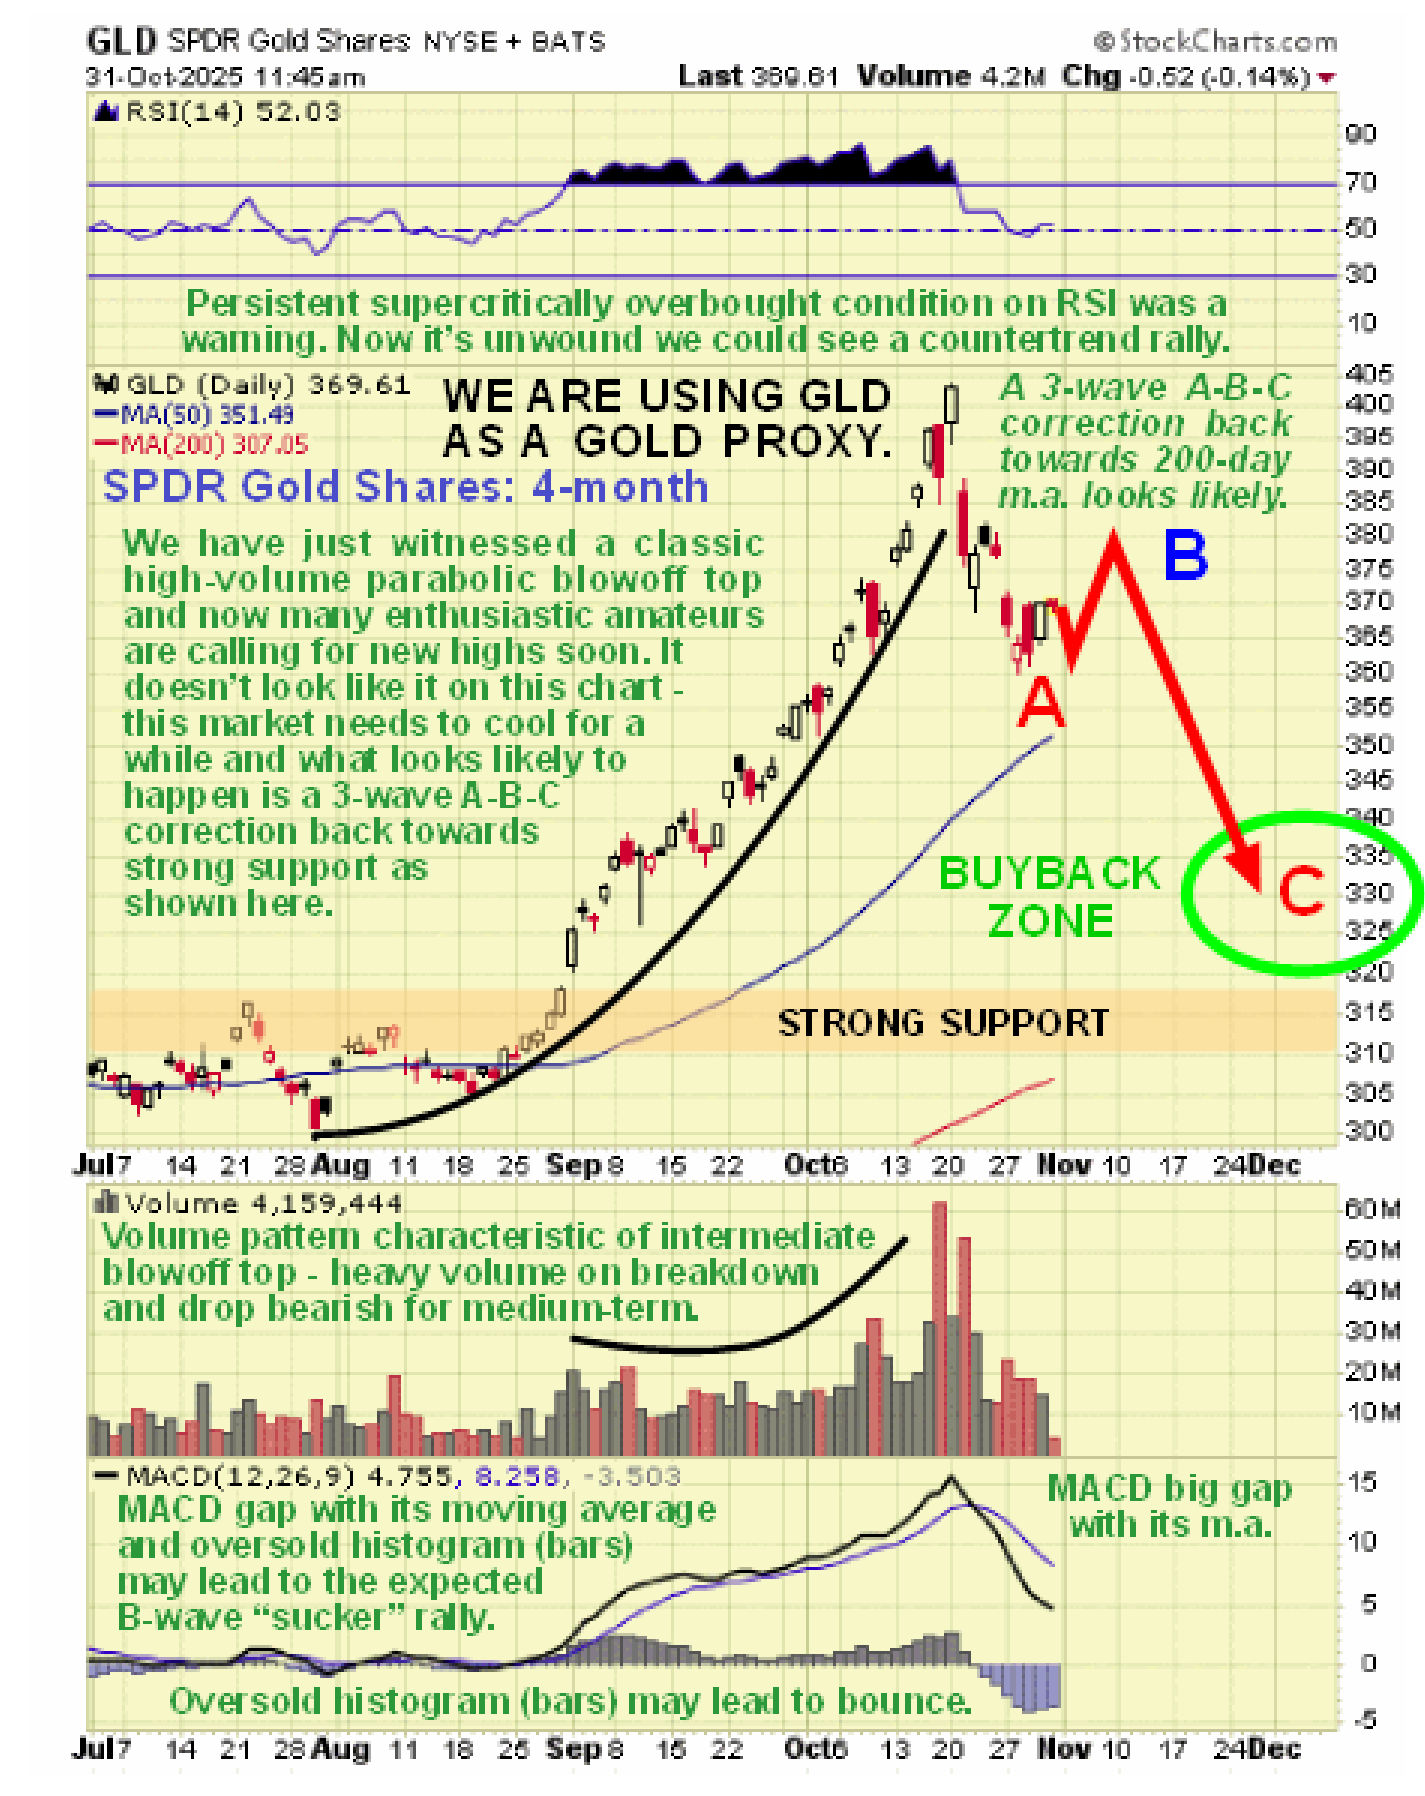
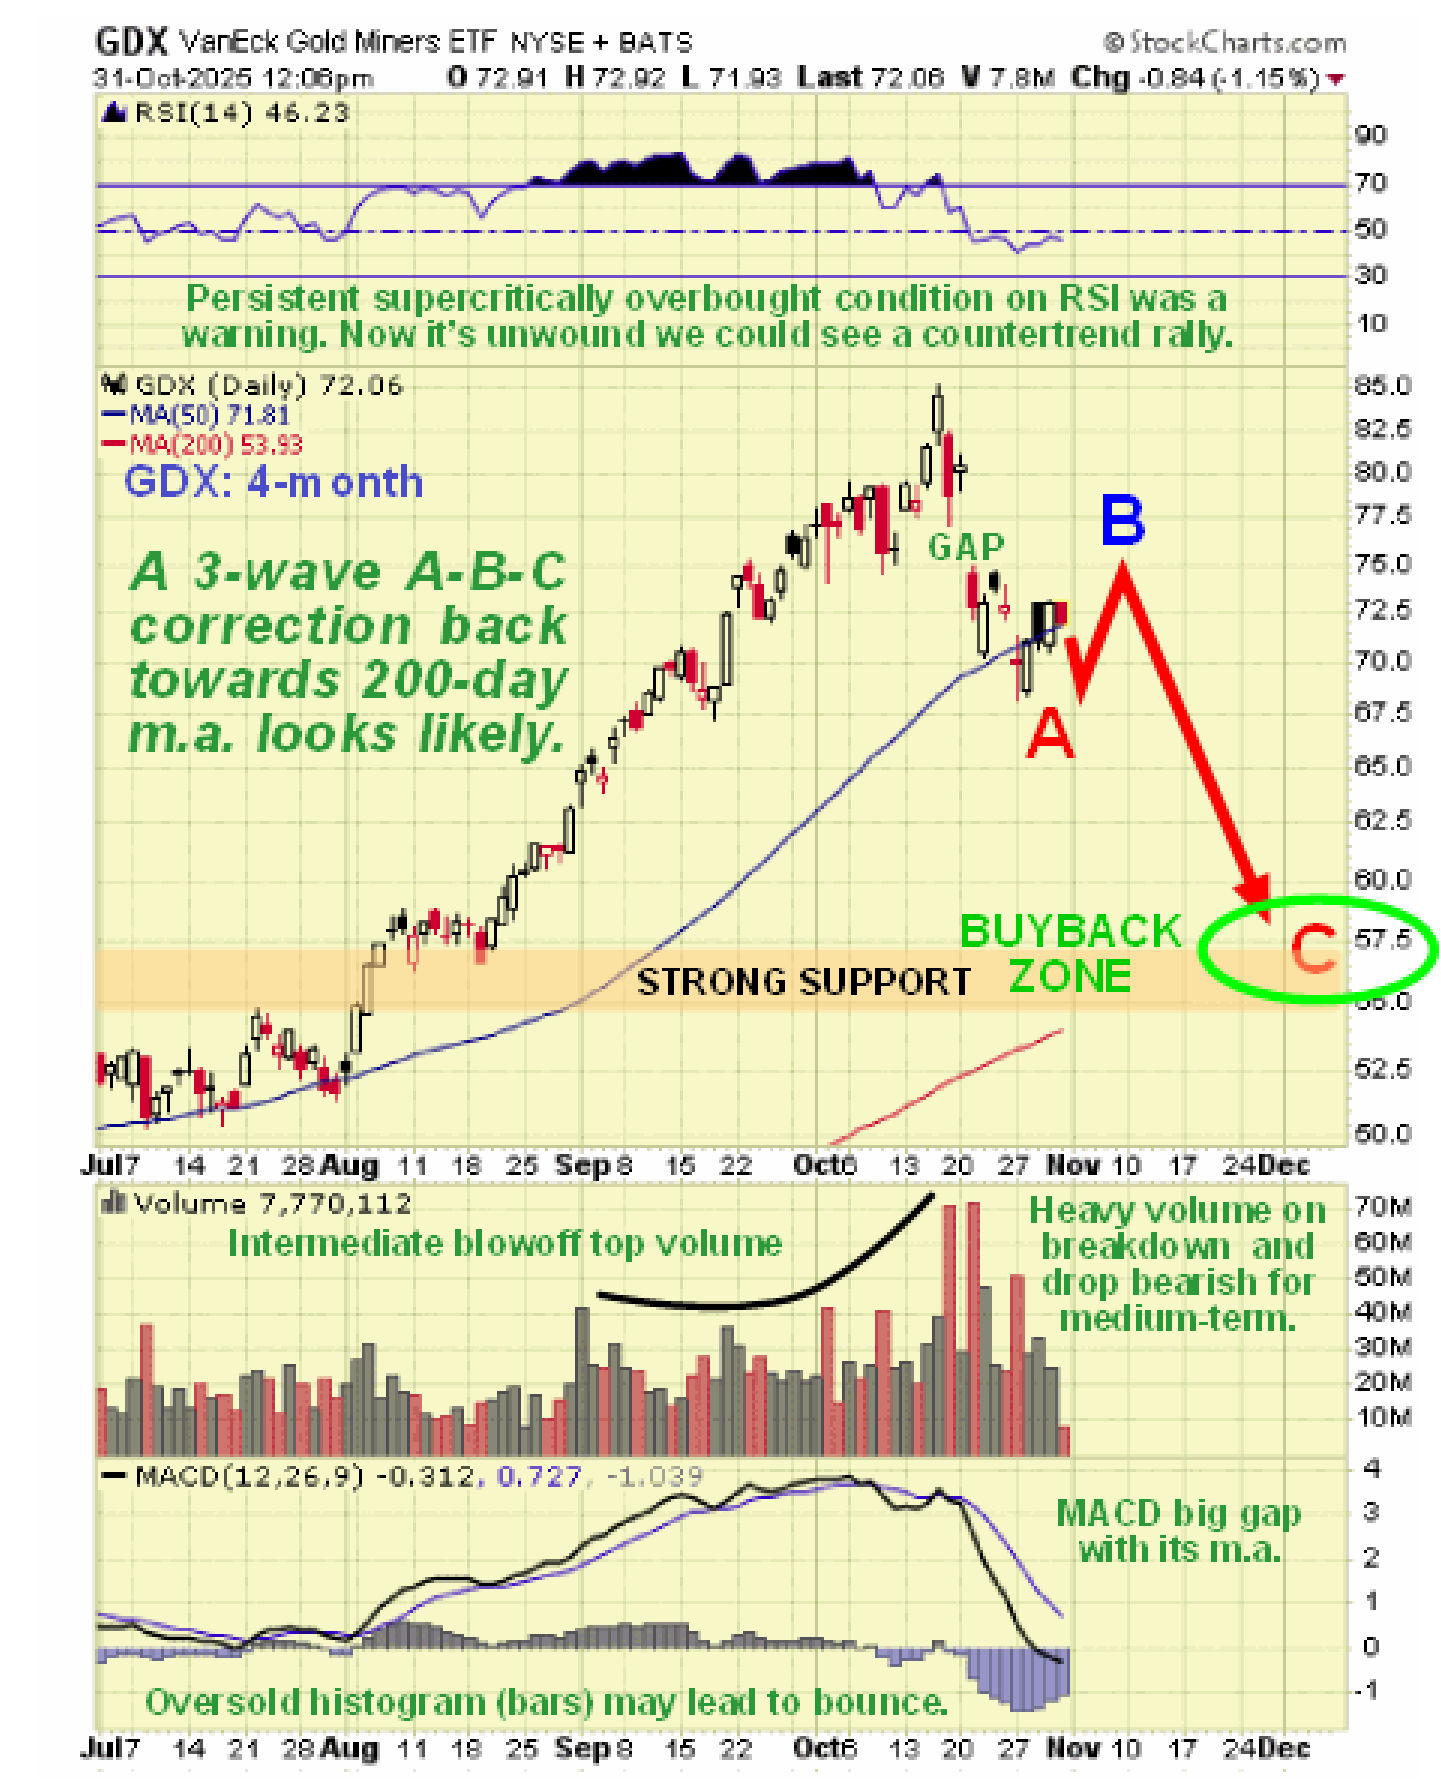
To this end we will use the charts for SPDR Gold Shares (GLD), iShares Silver Trust (SLV) and the Market Vector Gold Miners ETF, (GDX). The reason for using the charts for GLD and SLV instead of the charts for gold and silver themselves is that they show volume, which we need to see and they are faithful proxies for gold and silver themselves. We will look at 4-month charts for each in order to see recent action in detail but due to time constraints we will not consider longer-term charts and don’t need to for the purposes of this article.
Precious Metals stocks hit their highs on Thursday 16th October, gold hit its high on Monday 20th October and then cratered the next day, Tuesday 21st. However, PM stocks already reversed on heavy volume on Friday 17th, which we observed and was the reason that we took evasive action on Monday 20th in quiet trading before they got hit hard the next day, gapping lower on big volume and breaking down decisively from the steep uptrend in force from early August.
The reasons that the recent blowoff top in the sector is expected to lead to continued corrective action in the weeks ahead and possibly for a month or two are set out in the following bulleted list which should be read in conjunction with looking at the three charts set out below it.
- Both gold and silver broke down from a parabolic blowoff top on Tuesday 21st October, as shown on the charts of their faithful proxies GLD and SLV, below. A breakdown from a top of this nature invariably leads to a long period of consolidation / correction – it is almost unheard of for new highs to follow soon after a breakdown from a top of this nature.
- Gold, silver and PM stocks had all become massive record overbought by a wide margin at the peak, making the risk of a heavy correction high.
- Volume had built up to become climactic at and especially immediately after the top was reached amid high public involvement with the heavy volume on the descent from this peak having bearish implications for the intermediate term.
- The rate of climb of moving averages has become very steep with a yawning gap opening up between the 50-day and 200-day moving averages that calls for further corrective action going forward – the sector is currently finding support in the vicinity of the rising 50-day moving average on all these charts and this support may generate a B-wave “sucker” rally as shown on the charts but because of the large gap between the 50 and 200-day moving averages, this support is expected to crack leading to further corrective action back towards the 200-day.
- With upside momentum (MACD) having spectacularly failed, short to medium-term term risk is to the downside – in other words the sector is on the defensive.
- As set out in the article posted on the site on Tuesday 28th entitled BIG DOLLAR SURPRISE OUT OF LEFT FIELD SOON? the dollar looks poised to embark on a substantial rally which will provide a headwind for the Precious Metals as long as it lasts, and this rally looks like it has since started.
- As set out in the amusing China Observer video Gold Crash Hits Hard! as gold’s recent peak approached, the lowest grade of investor in China, fresh from losing money in Real Estate, was starting to become heavily involved, having been stoked by a tidal wave of gold bullish hype in the mainstream media – as the old saying goes “That many people can’t be right.”

Lest any of you should feel deflated or discouraged by the seemingly somewhat negative short to medium-term outlook shown on the shorter-term charts above, the following 3-year chart makes clear that GLD’s bull market, and thus gold’s, is alive and well and should resume in earnest once the necessary rebalancing of sentiment resulting from the current phase of consolidation / correction has run its course…
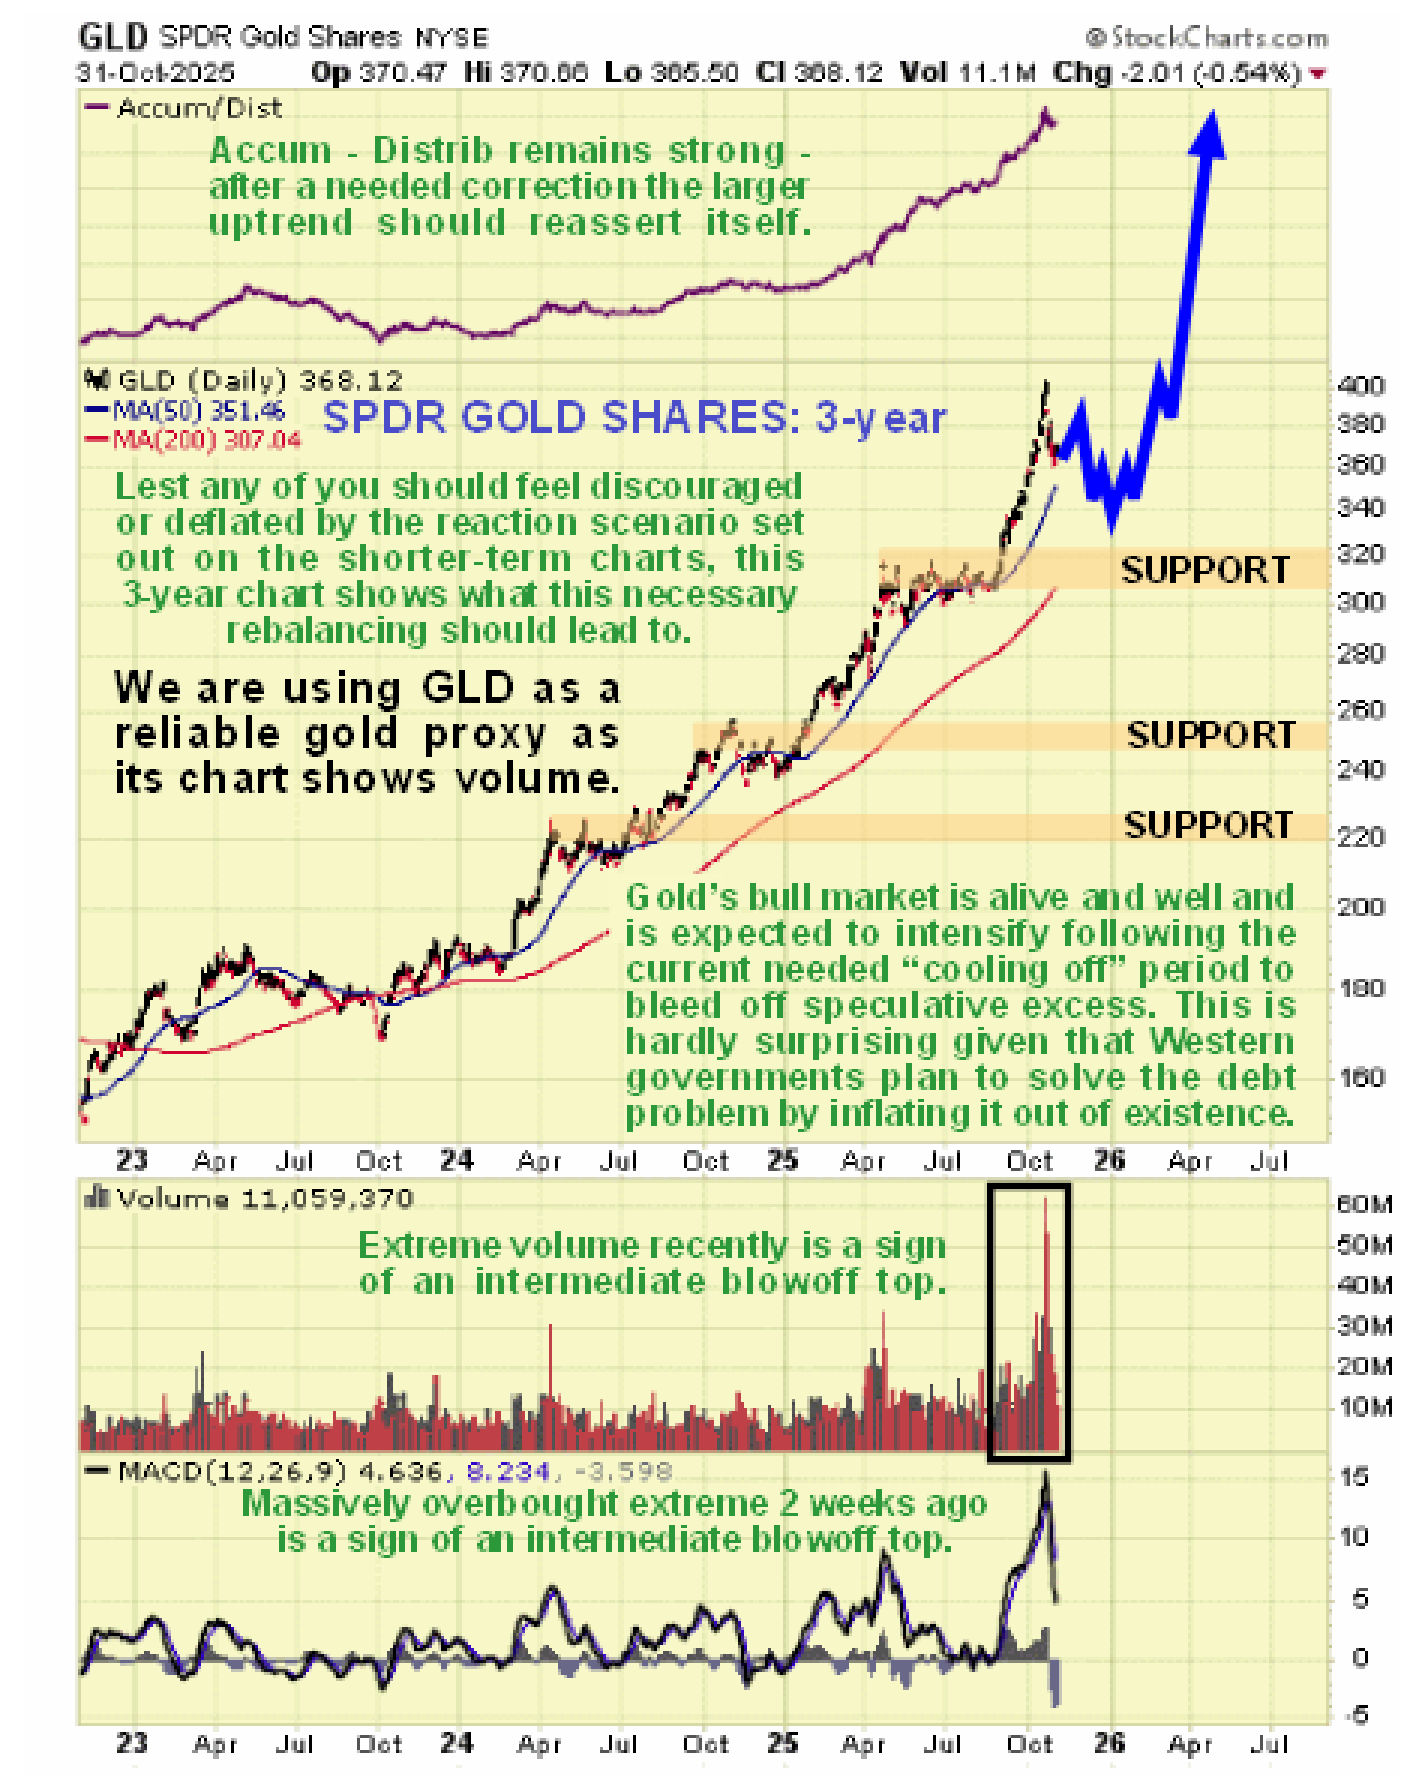
Never forget that it is better to do nothing than to make a wrong move and so, having got out or taken defensive action right before the sector caved in after milking it for all it’s worth, we are generally content to bide our time and let this correction run its course and the plan is to start averaging in to the best looking stocks as the correction low is thought to be approaching. This does not mean that we are sat twiddling our thumbs and doing nothing – we can utilize the time to sort out the best stocks ahead of the next major upleg and there for sure will be one – this top we have just seen is not the final top – how can it be with the Western Fiat money system in terminal decline with currencies heading in the direction of utter worthlessness? This is made crystal clear by Egon von Greyerz in his video short.
End of update.
Posted at 6.30 pm EDT on 31st October 25.