Altamira Gold has been kept under observation for weeks as we have waited patiently for its post-breakout reaction to run its course and the reason for this article now is that it looks like it has, or if not is close to having done so.
On its 2-year chart we can see that Altamira had a quite spectacular breakout from a large 2-year Double Bottom base pattern early in September on positive drilling results. As usual it ran up too far, too fast, this breakout move being given added impetus by the very positive conditions prevailing across the sector at that time. A significant reaction back was therefore to be expected and this has been amplified in the recent past by the sector correction so that the price is now arriving back at the zone of strong support which is a classic “buy spot” on such a post-breakout reaction, especially as the implications of the positive drilling results have in no way been diminished
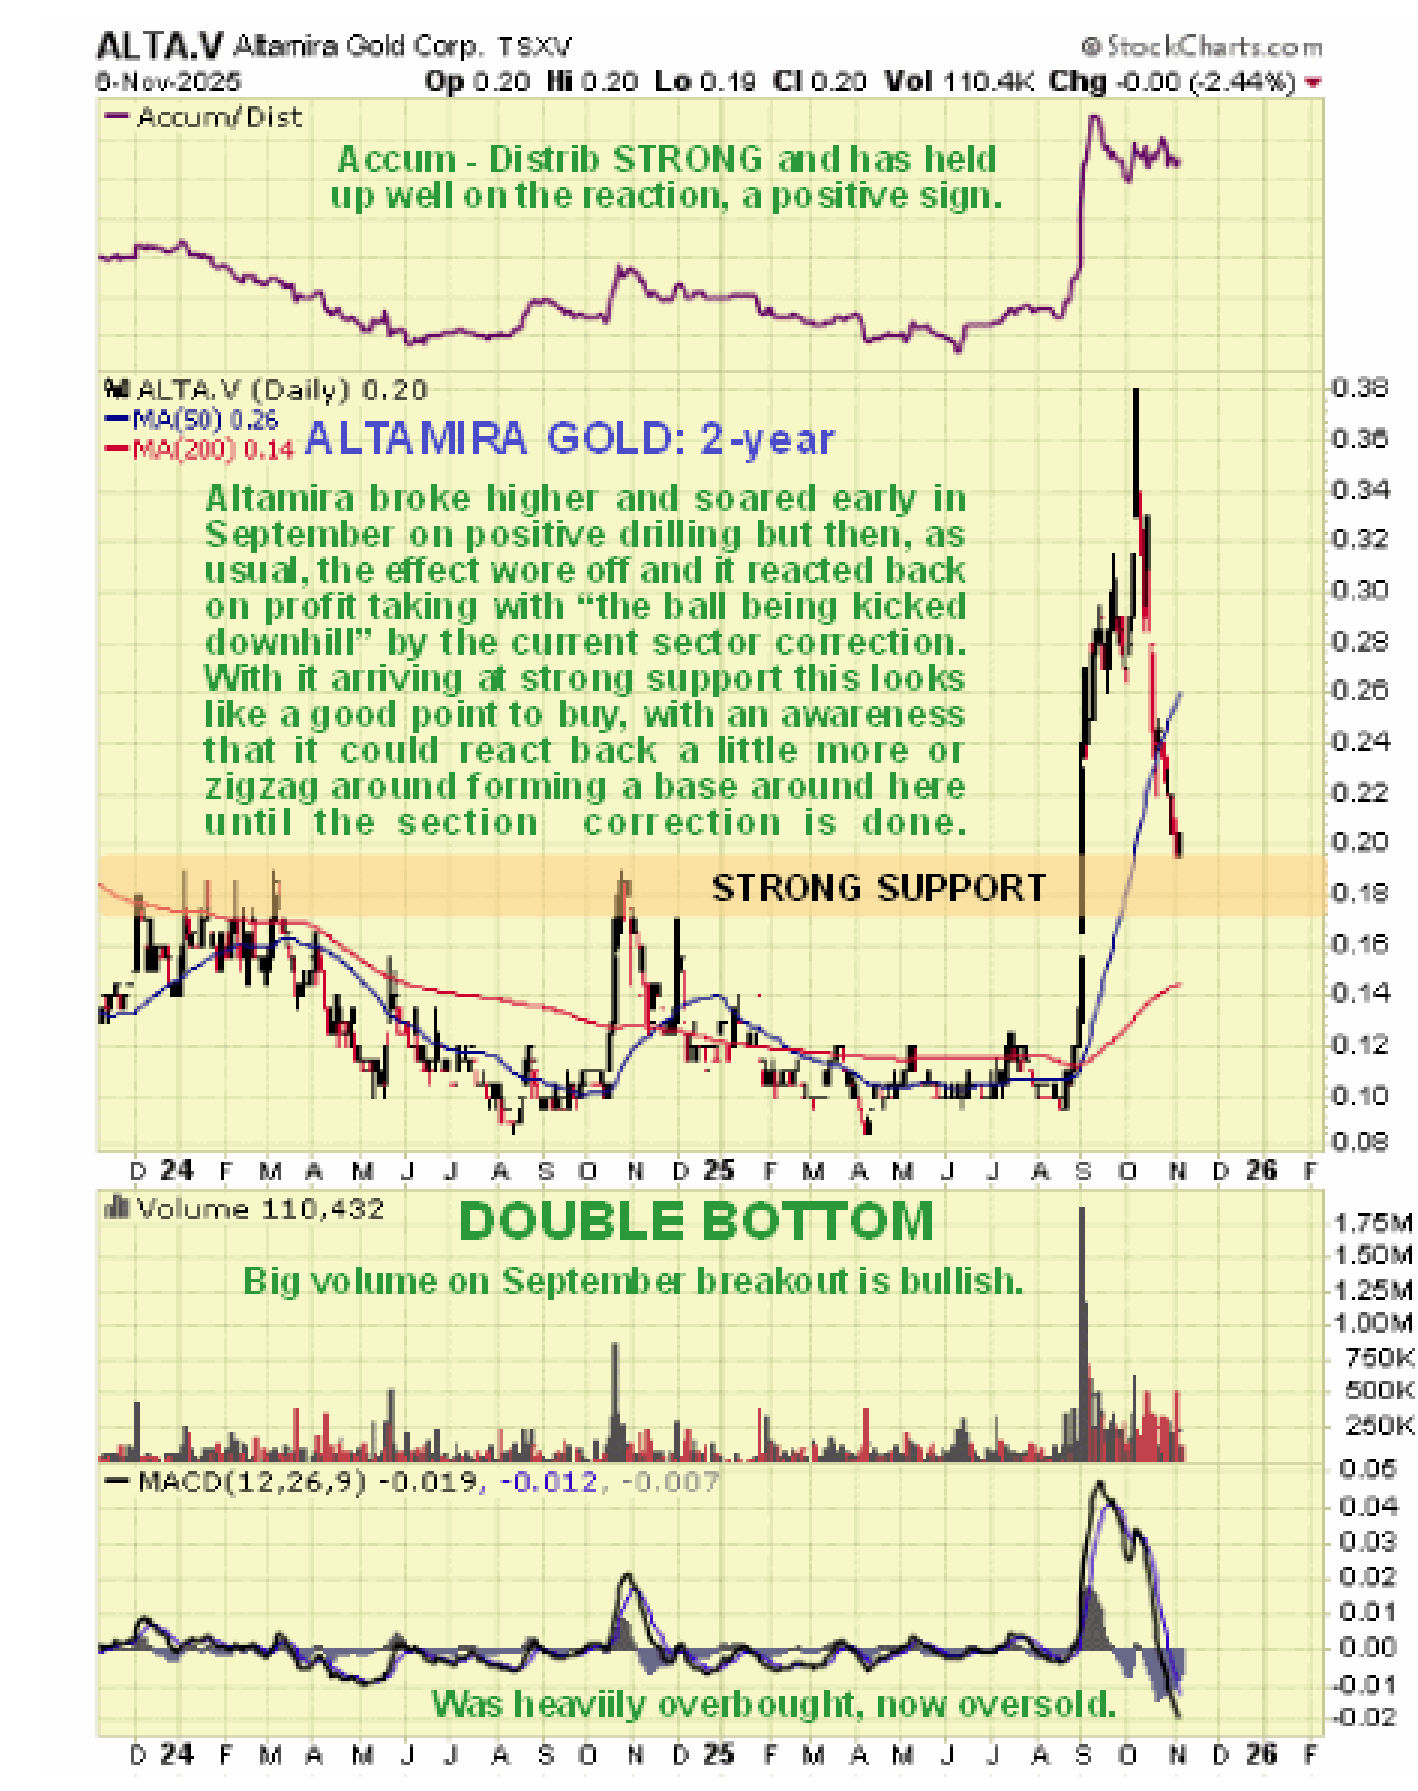
On the 6-month chart we can see recent action in much more detail and how the breakout early in September kicked off a big runup that resulted in the stock becoming extremely overbought. The huge volume on this breakout has long-term bullish implications. This runup has been followed by a heavy reaction that has almost cut the price in half from its value at the early October peak and with the price having dropped way below its now strongly rising 50-day moving average to arrive at the zone of strong support marking the upper boundary of the large base pattern in a now quite deeply oversold state, it looks like the pendulum has swung too far in the opposite direction. This therefore looks the point to move in and start buying the stock with an awareness that it could drop little further or zigzag around in this area for a while until the sector correction has run its course. Having said that it does look like a bullish Falling Wedge has formed that is now closing up, which implies that it could break to the upside soon, especially as the MACD histogram (blue bars) is creeping steadily up towards the zero line, implying that, despite significant downside volume in the recent past, it could soon break to the upside and given the “compression” this could happen with a sizable up day.

Altamira Resources is therefore rated a stong buy in this area and especially on any further near-term downside, which is likely to be minor, or on a breakout from the suspected bullish Falling Wedge on volume.
Altamira Gold website
Altamira Gold Corp., ALTA.V, EQTRF on OTC, closed at C$0.20, $0.14 on 6th November 25.
Posted at 8.30 am EST on 7th November 25.