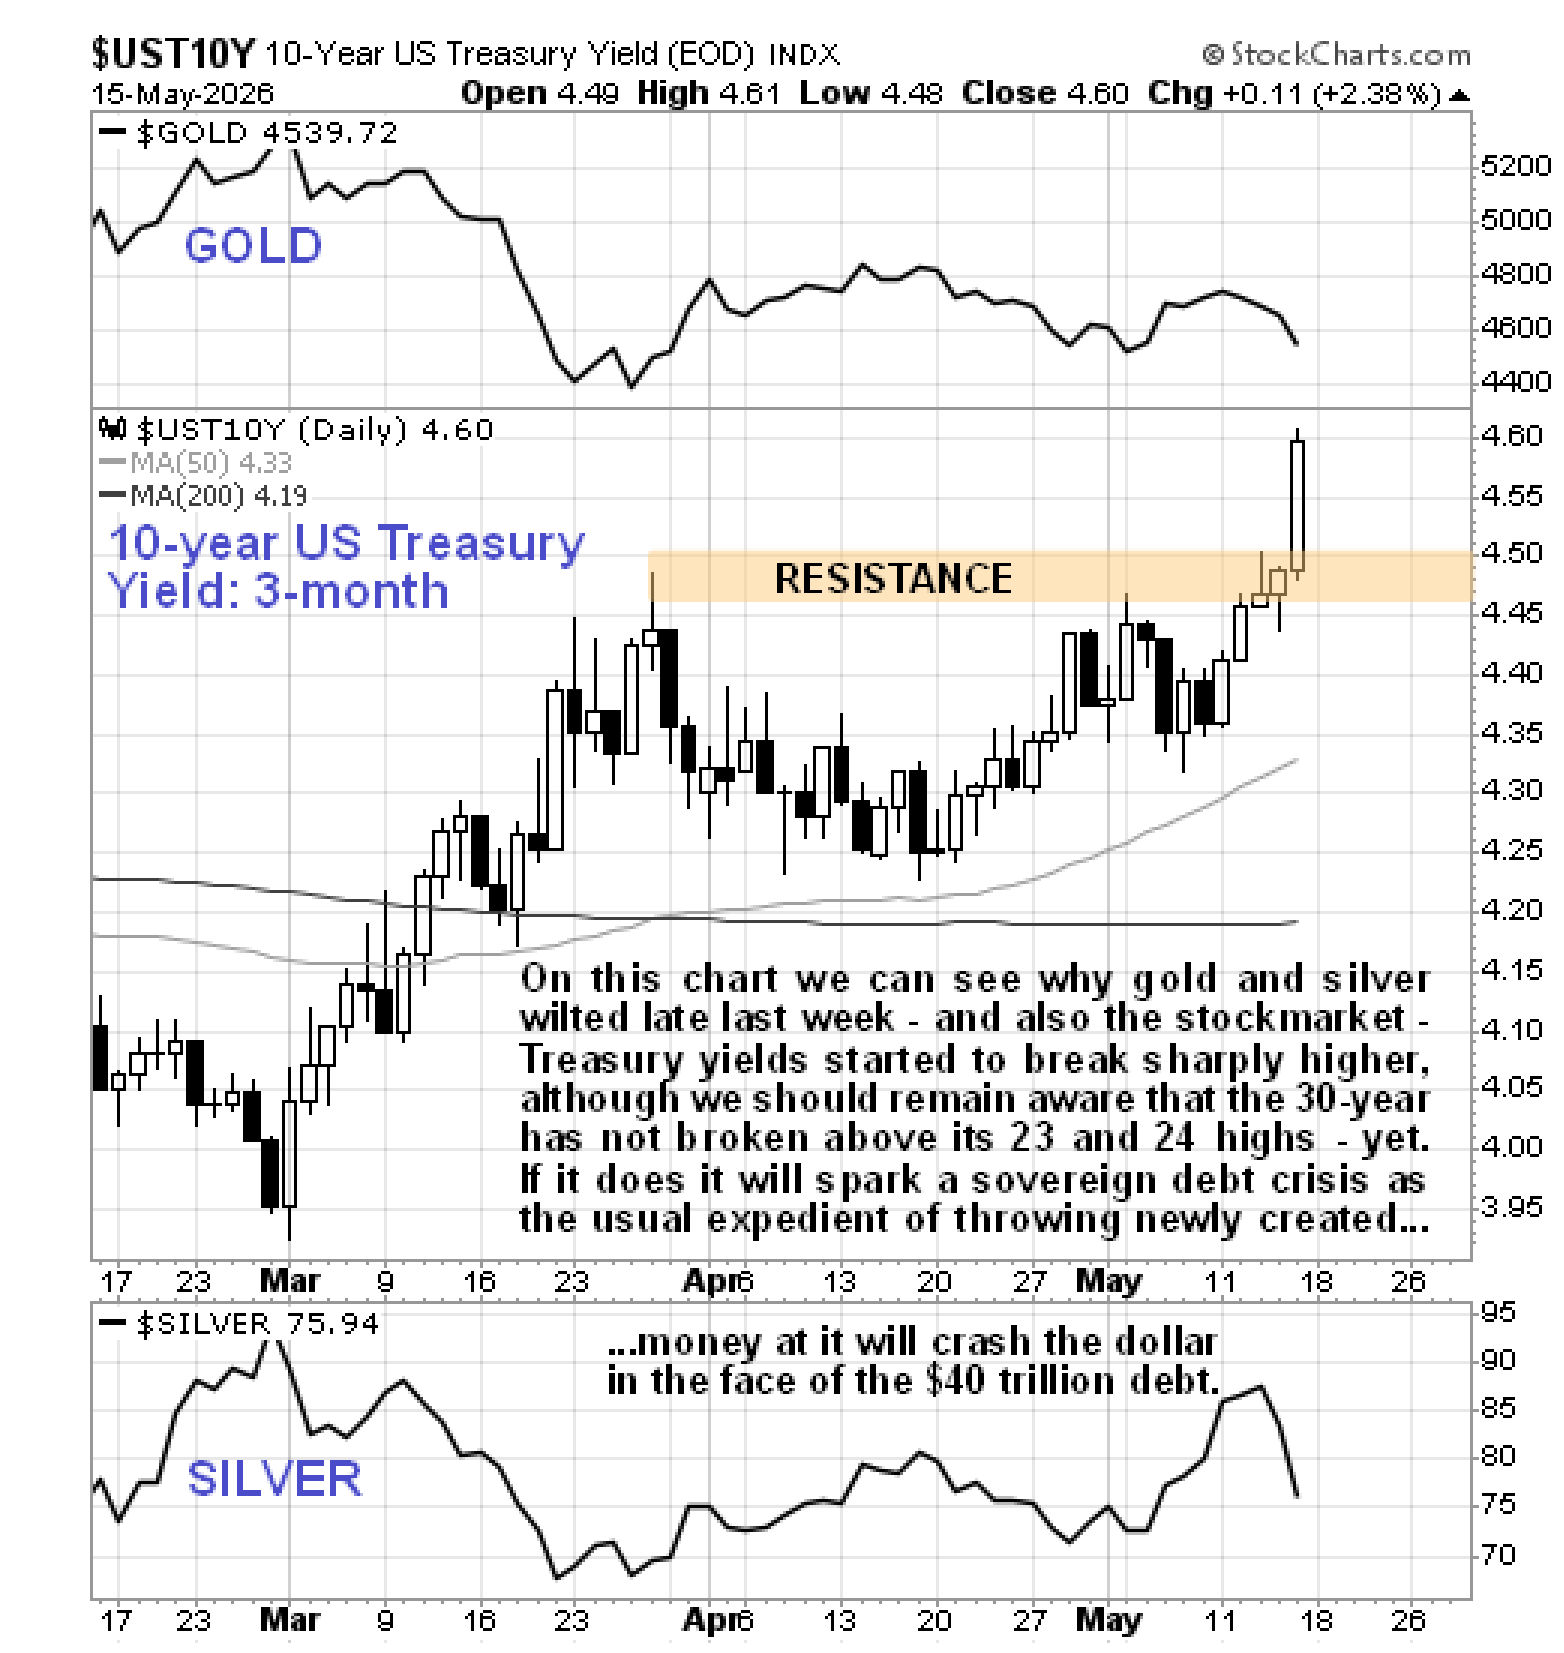
The interpretation early this month that the PM sector was about to start a major upleg is starting to look incorrect – wrong – as a result of developments late last week. It began well enough with silver breaking higher but then late last week both gold and silver were hit hard as a result of interest rates breaking higher.
Ultimately, rising rates will not stop gold and silver marching higher, partly because higher rates will not attract investors to Treasuries if the reason for it is that their prices are collapsing, just as rising rates did not stop the Precious Metals bull market in the late 1970’s. However, they could have a inhibiting effect on the metals over the medium-term – so what we are going to look at in this update is the outlook for rates and the consequent effect on Precious Metals prices.
First we will look at the 3-month chart for the 10-year T-bond Yield which makes clear immediately why the metals got hit last week, especially on Thusday and Friday. For the T-Bond Yield broke sharply higher on Friday which immediately raises the question of whether this constitutes a breakout into a major new uptrend and to determine that we will need to look at a long-term chart and we’ll do that for the important 30-year T-bond.
On the 6-year chart for the 30-year T-bond Yield we can see much more clearly what is going on. On this chart we see that, following a vigorous advance from a very low level during 2022 and 2023, rates settled into an upwardly skewed trading range, a Rising Triangle, which has bullish implications. If it is going to break out of this Triangle to the upside, the time is clearly at hand for it to do so, as the Triangle is fast closing up. Although it hasn’t quite achieved a clear breakout yet, action in the metals and in the stock market late last week suggests that it will succeed in doing so soon and a point that should be borne in mind is that, as this Triangle has been forming for almost 3 years, a breakout from it will have major implications.
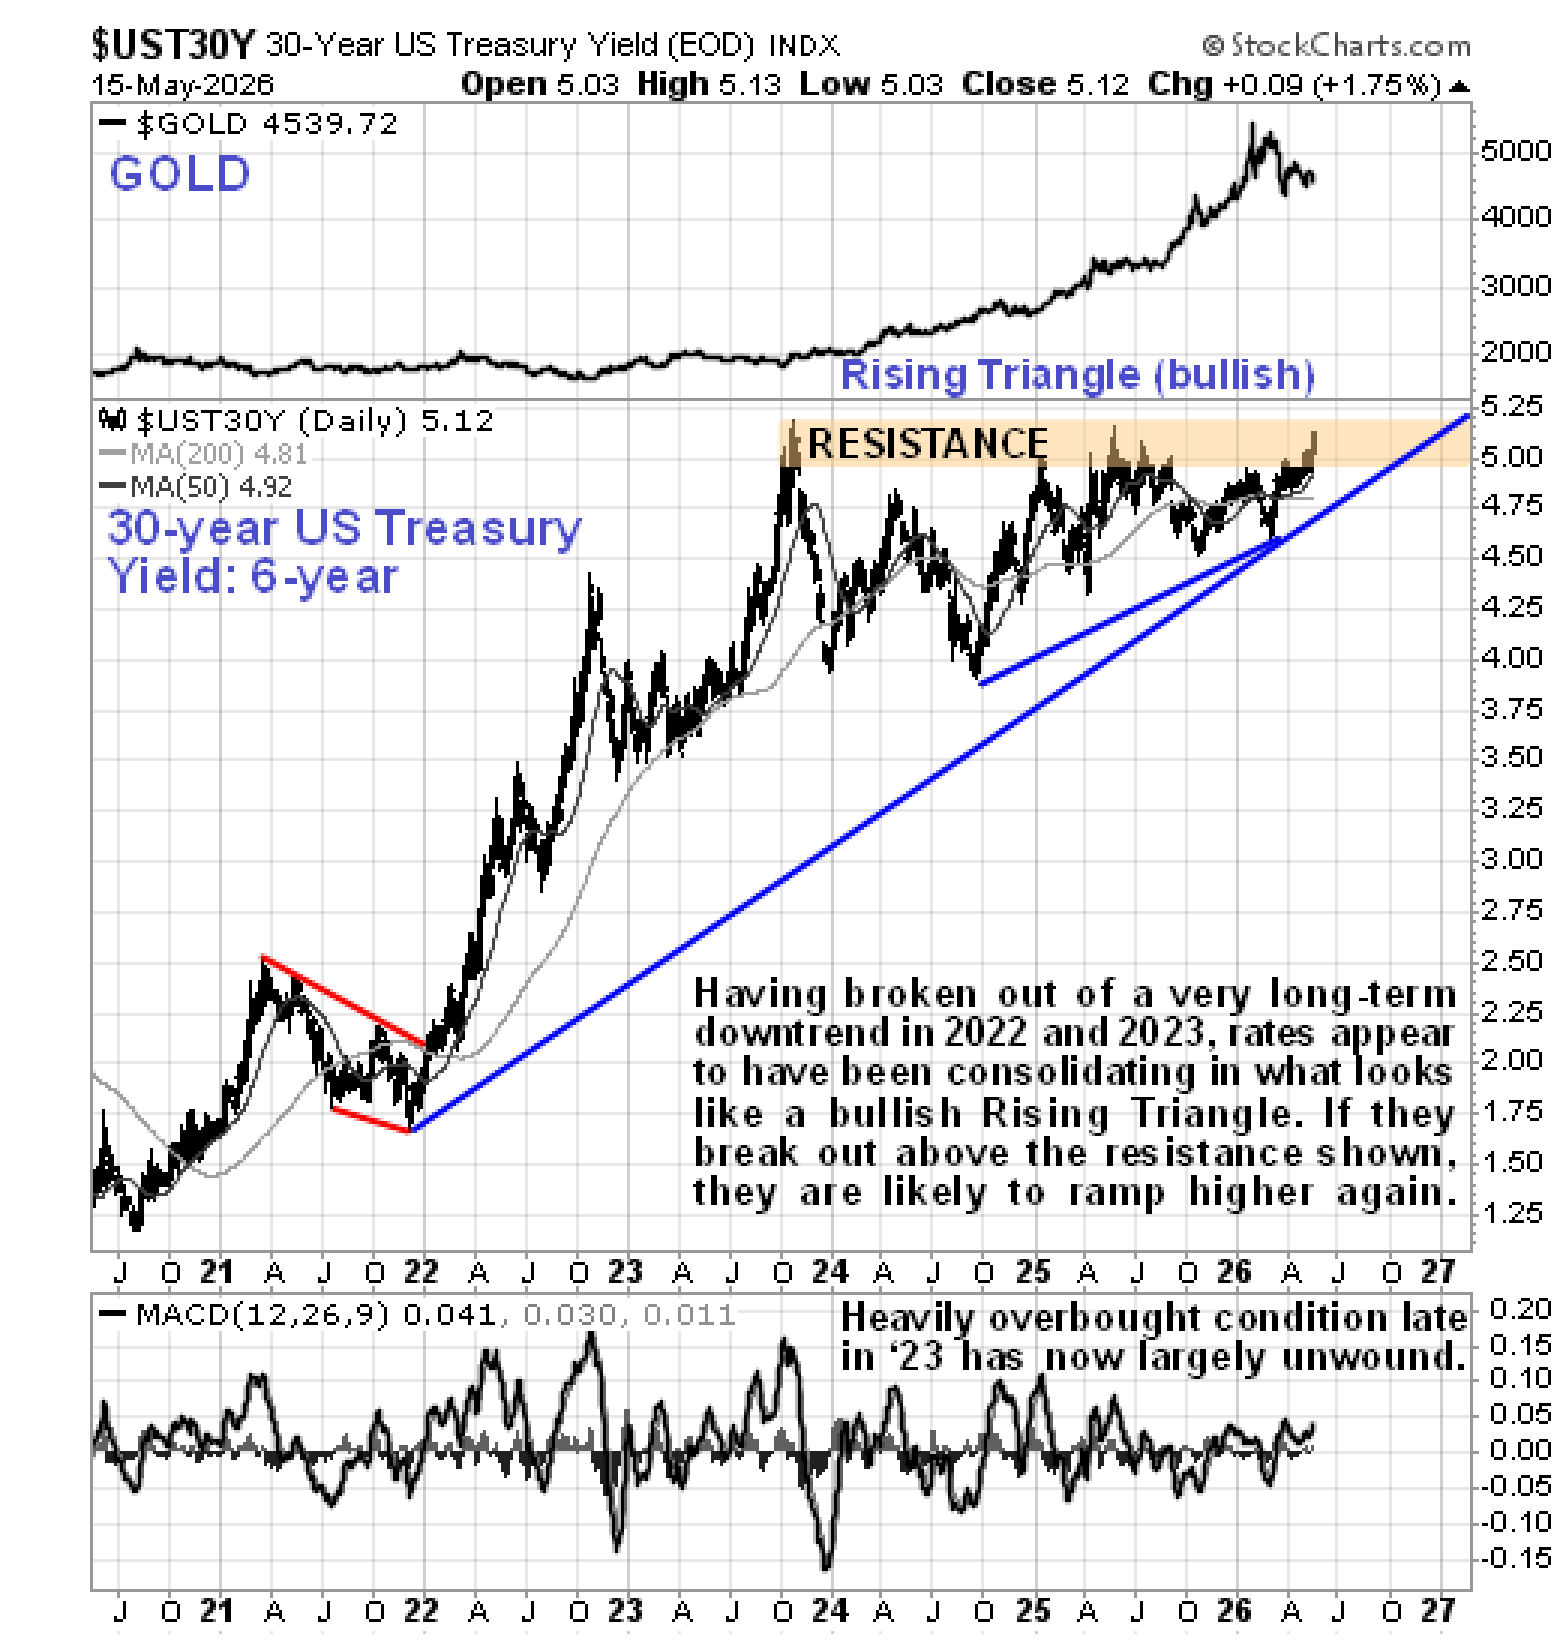
Now normally the Fed / Treasury would be able to head off or mitigate rate rises by the simple expedient of creating huge amounts of new money out of thin air to throw at propping up the bond market and the reason that this time it’s different is that the deficit is now so enormous, at $40 trillion and growing exponentially, that if they try this gambit it will implode the US dollar, so it looks like they are simply going to let rates go through the roof. While this will be hard on ordinary people the destitution and unemployment etc that this will bring about will further the purposes of The Great Reset, as a people who are broke, dependant and desperate are a lot easier to control and herd into the CBDC system which is ready and waiting in the wings. So the ruling class are not averse to this outcome.
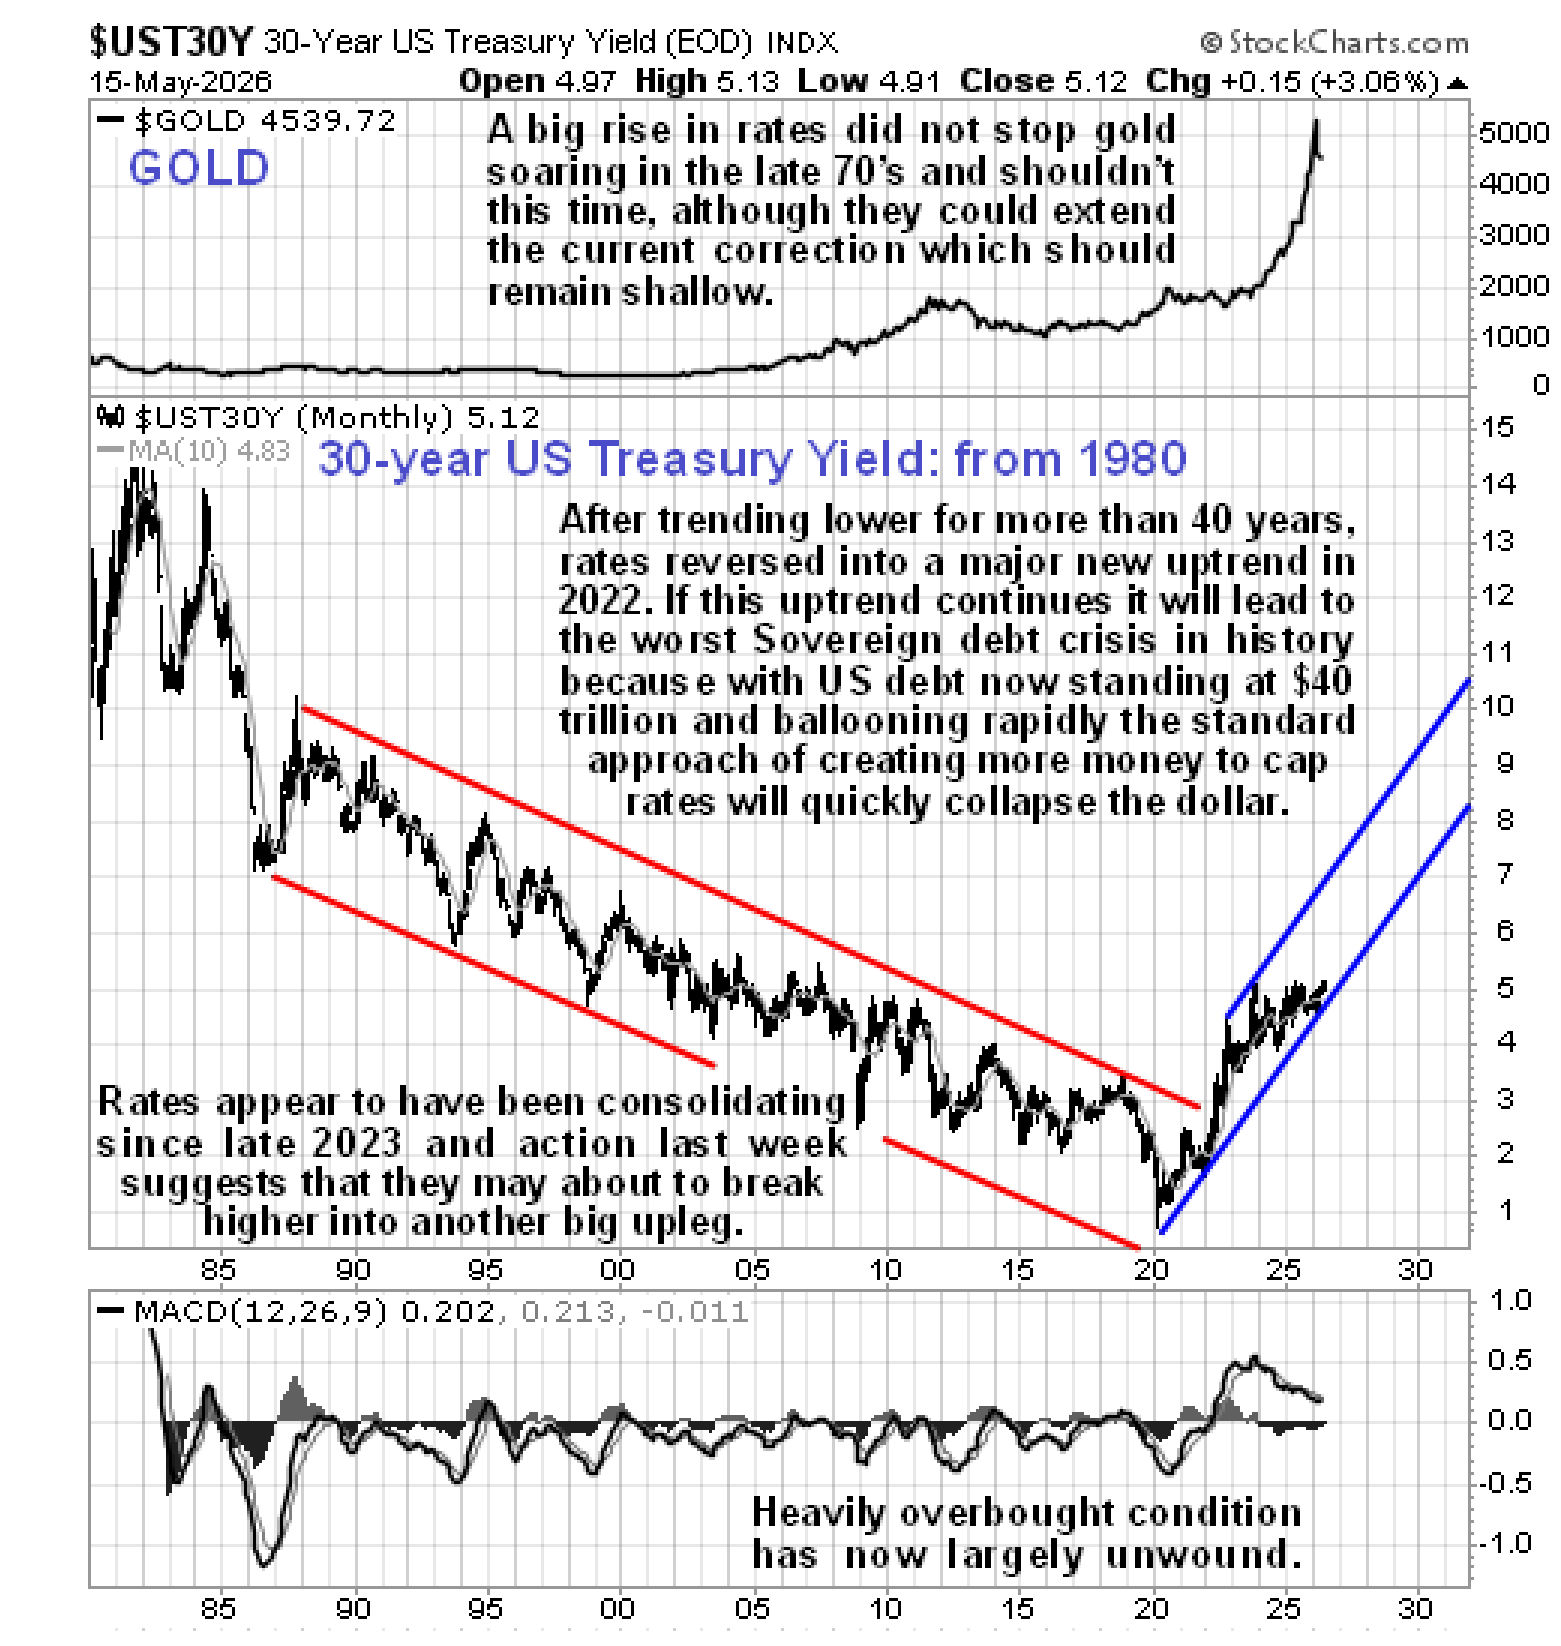
So now let’s put this setup with the bond market into even greater perspective by looking at the very long-term chart for the 30-year T-bond Yield going way back to 1980. Here we see that yields had been in a long-term bear market for no less than 40 years, finally breaking out of it decisively in 2022. This breakout and strong advance into late 2023 resulted in it becoming heavily overbought, calling for a corrective phase, and that is what we have since seen and the fact that yields remained largely unchanged since early 2024 presented a window of opportunity for the PM sector to advance, unfettered by rising rates. Now, however, that may be about to change fast, as we caught a glimpse of late last week, and as noted above, the Fed / Treasury / government’s ability to avert this is limited, unless they want to crash the dollar.
Now we’ll quickly review the effect of this on the Precious Metals.
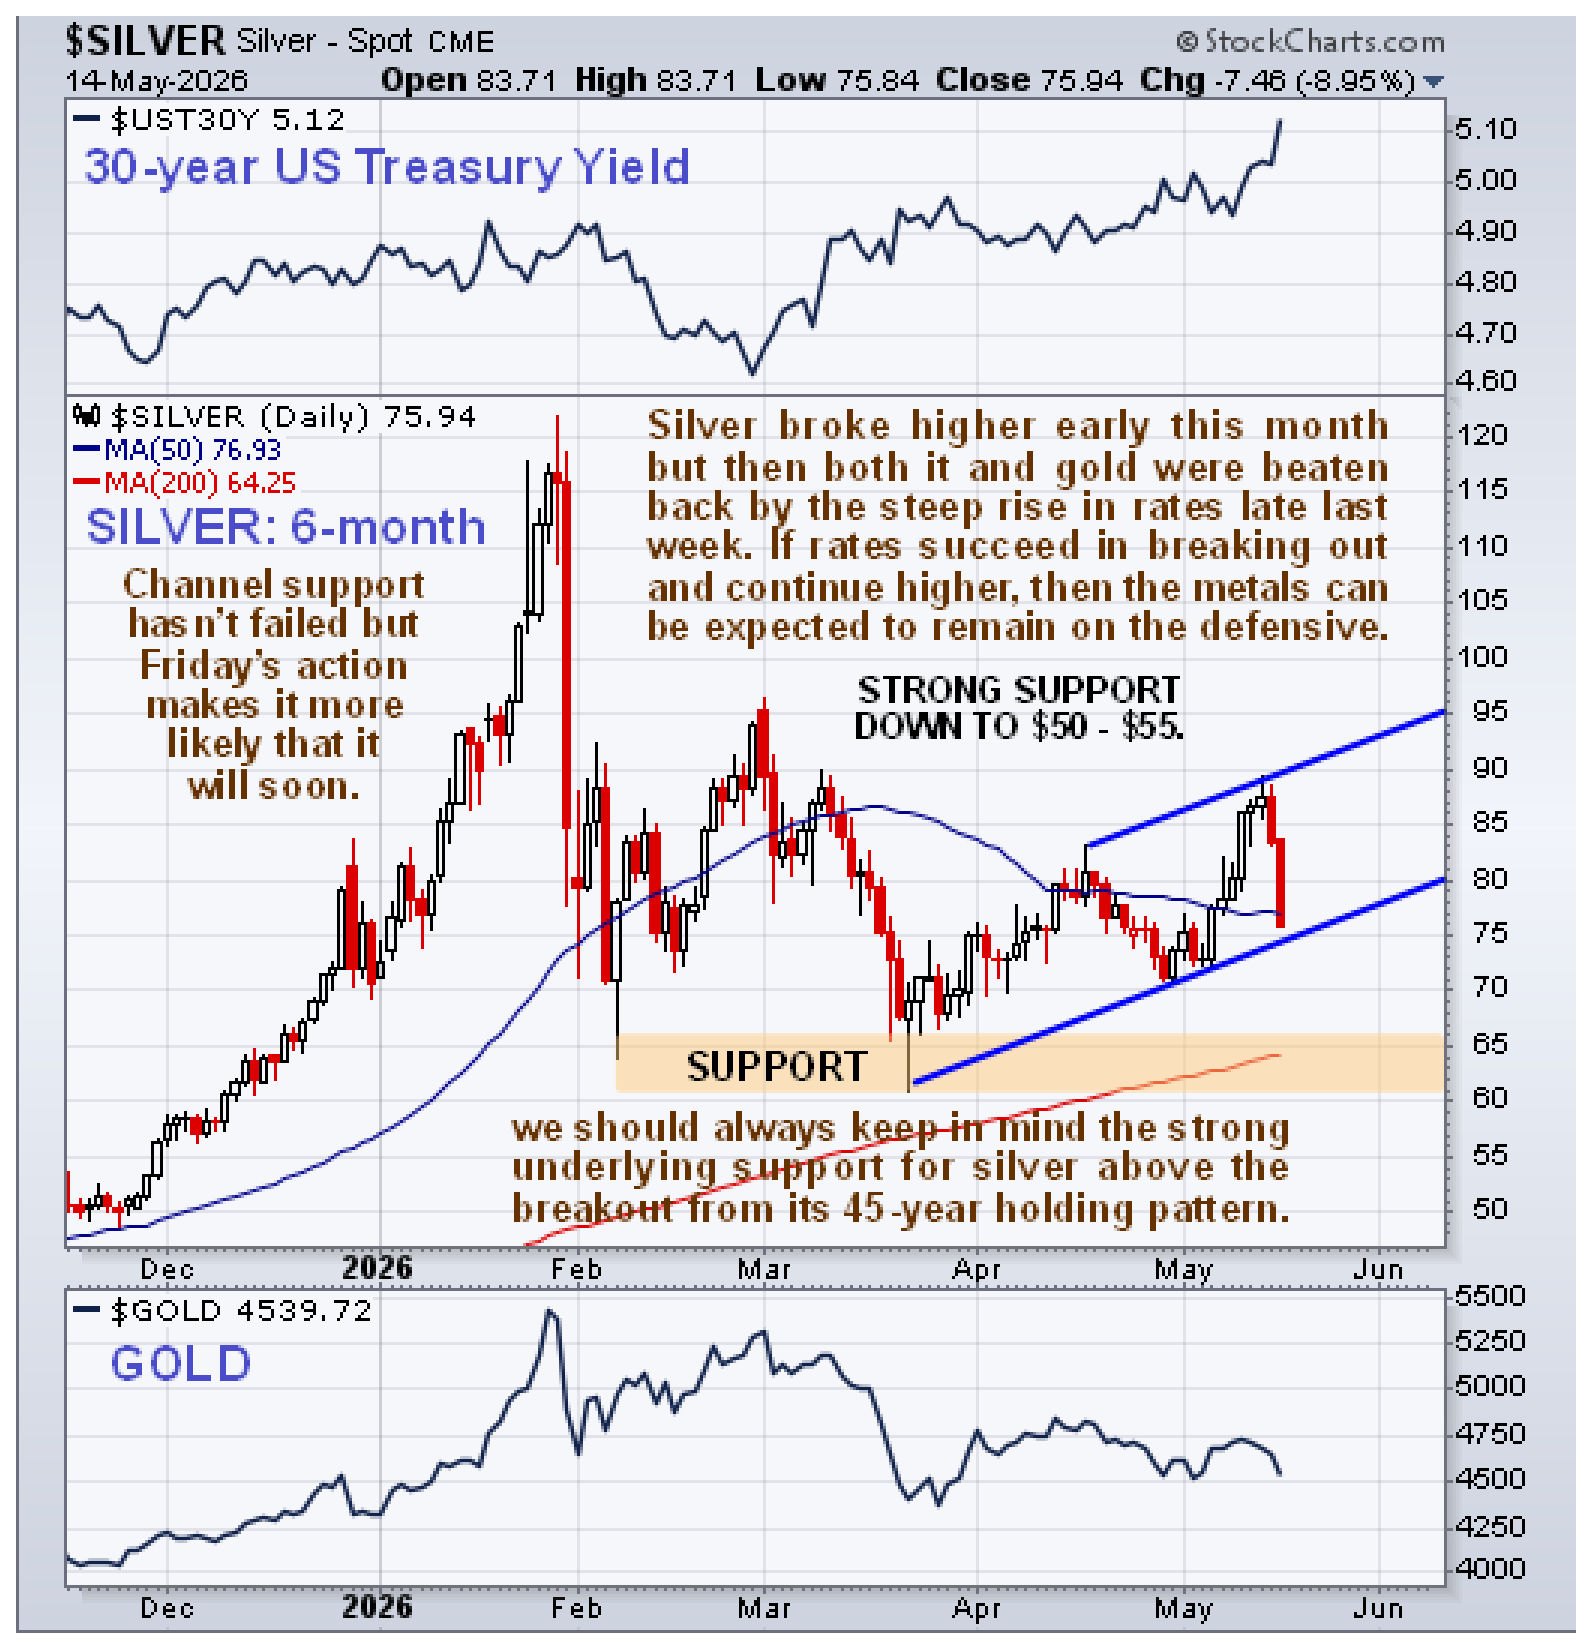
Starting with the 6-month chart for silver, we see that it started to break higher early in the month, as predicted, but then late last week it was clobbered by the rate rise. It still hasn’t broken down from the uptrend channel shown, but the action late last week suggests that it soon will, especially of course if rates complete an upside breakout into a new intermediate uptrend. We should note however, that if silver does break down from this uptrend, it probably won’t drop much because of the broad band of strong support not far beneath, and also because many other factors having a bearing on the Precious Metals market are exceptionally bullish.
On the 6-month chart for GDX (Market Vectors Gold Miners ETF) we see that PM stocks have been fluctuating within a large Symmetrical Triangle since early March, and with this Triangle now closing up, a breakout into a new intermediate trend looks set to occur soon and the high volume gap break to the lower boundary of the Triangle on Friday suggests an increased risk that it will break down from it.
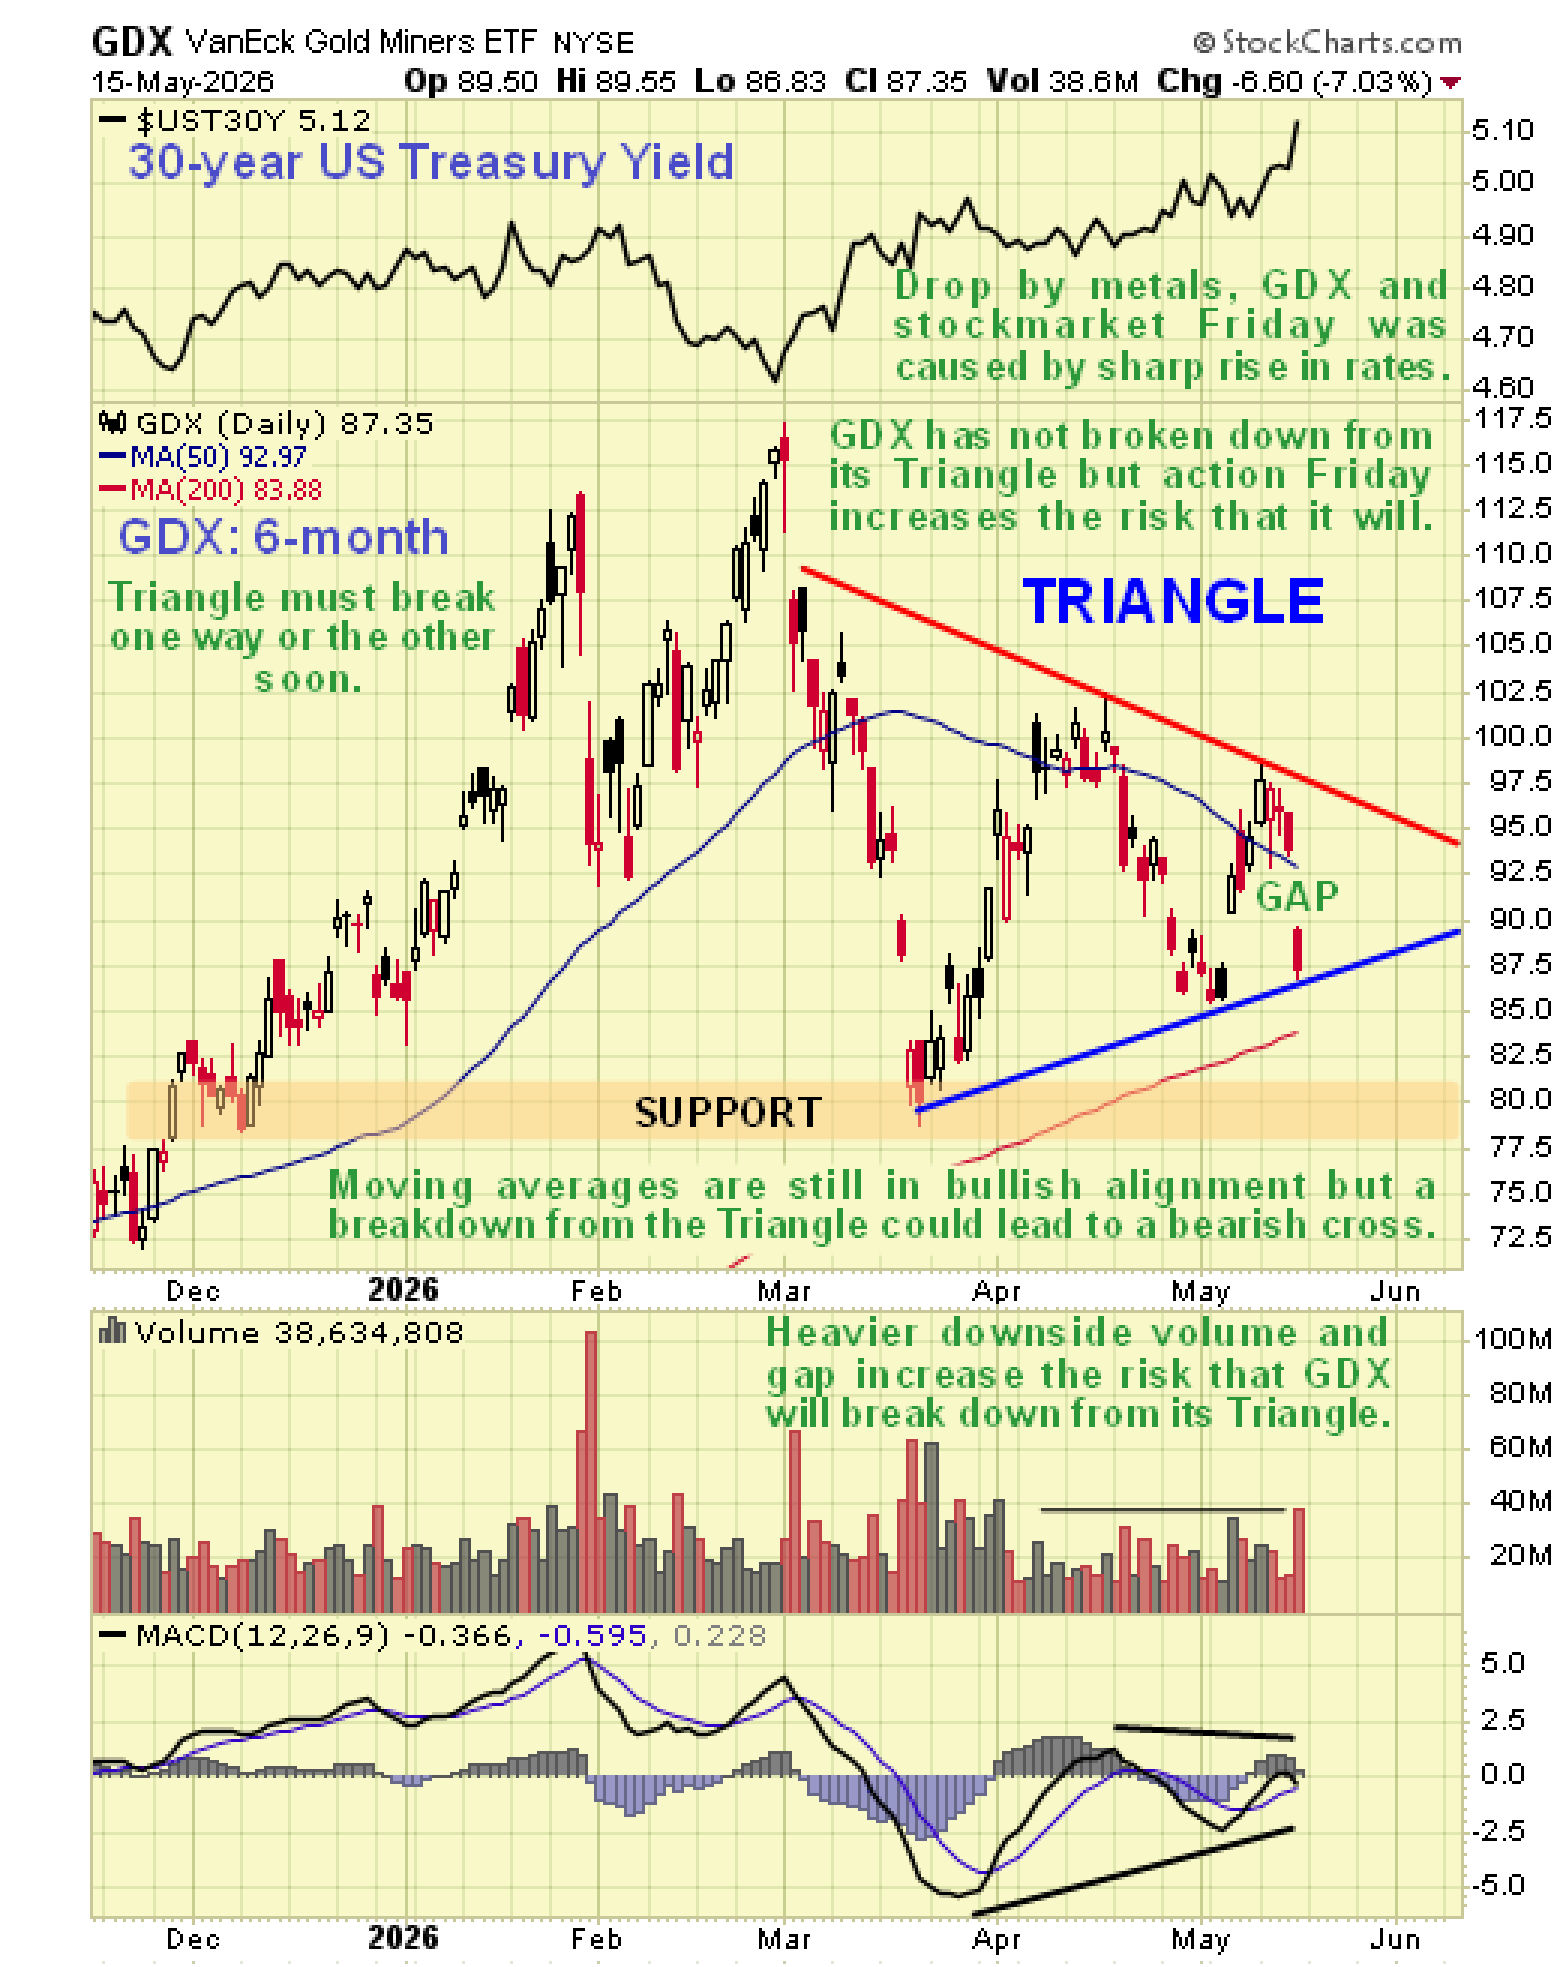
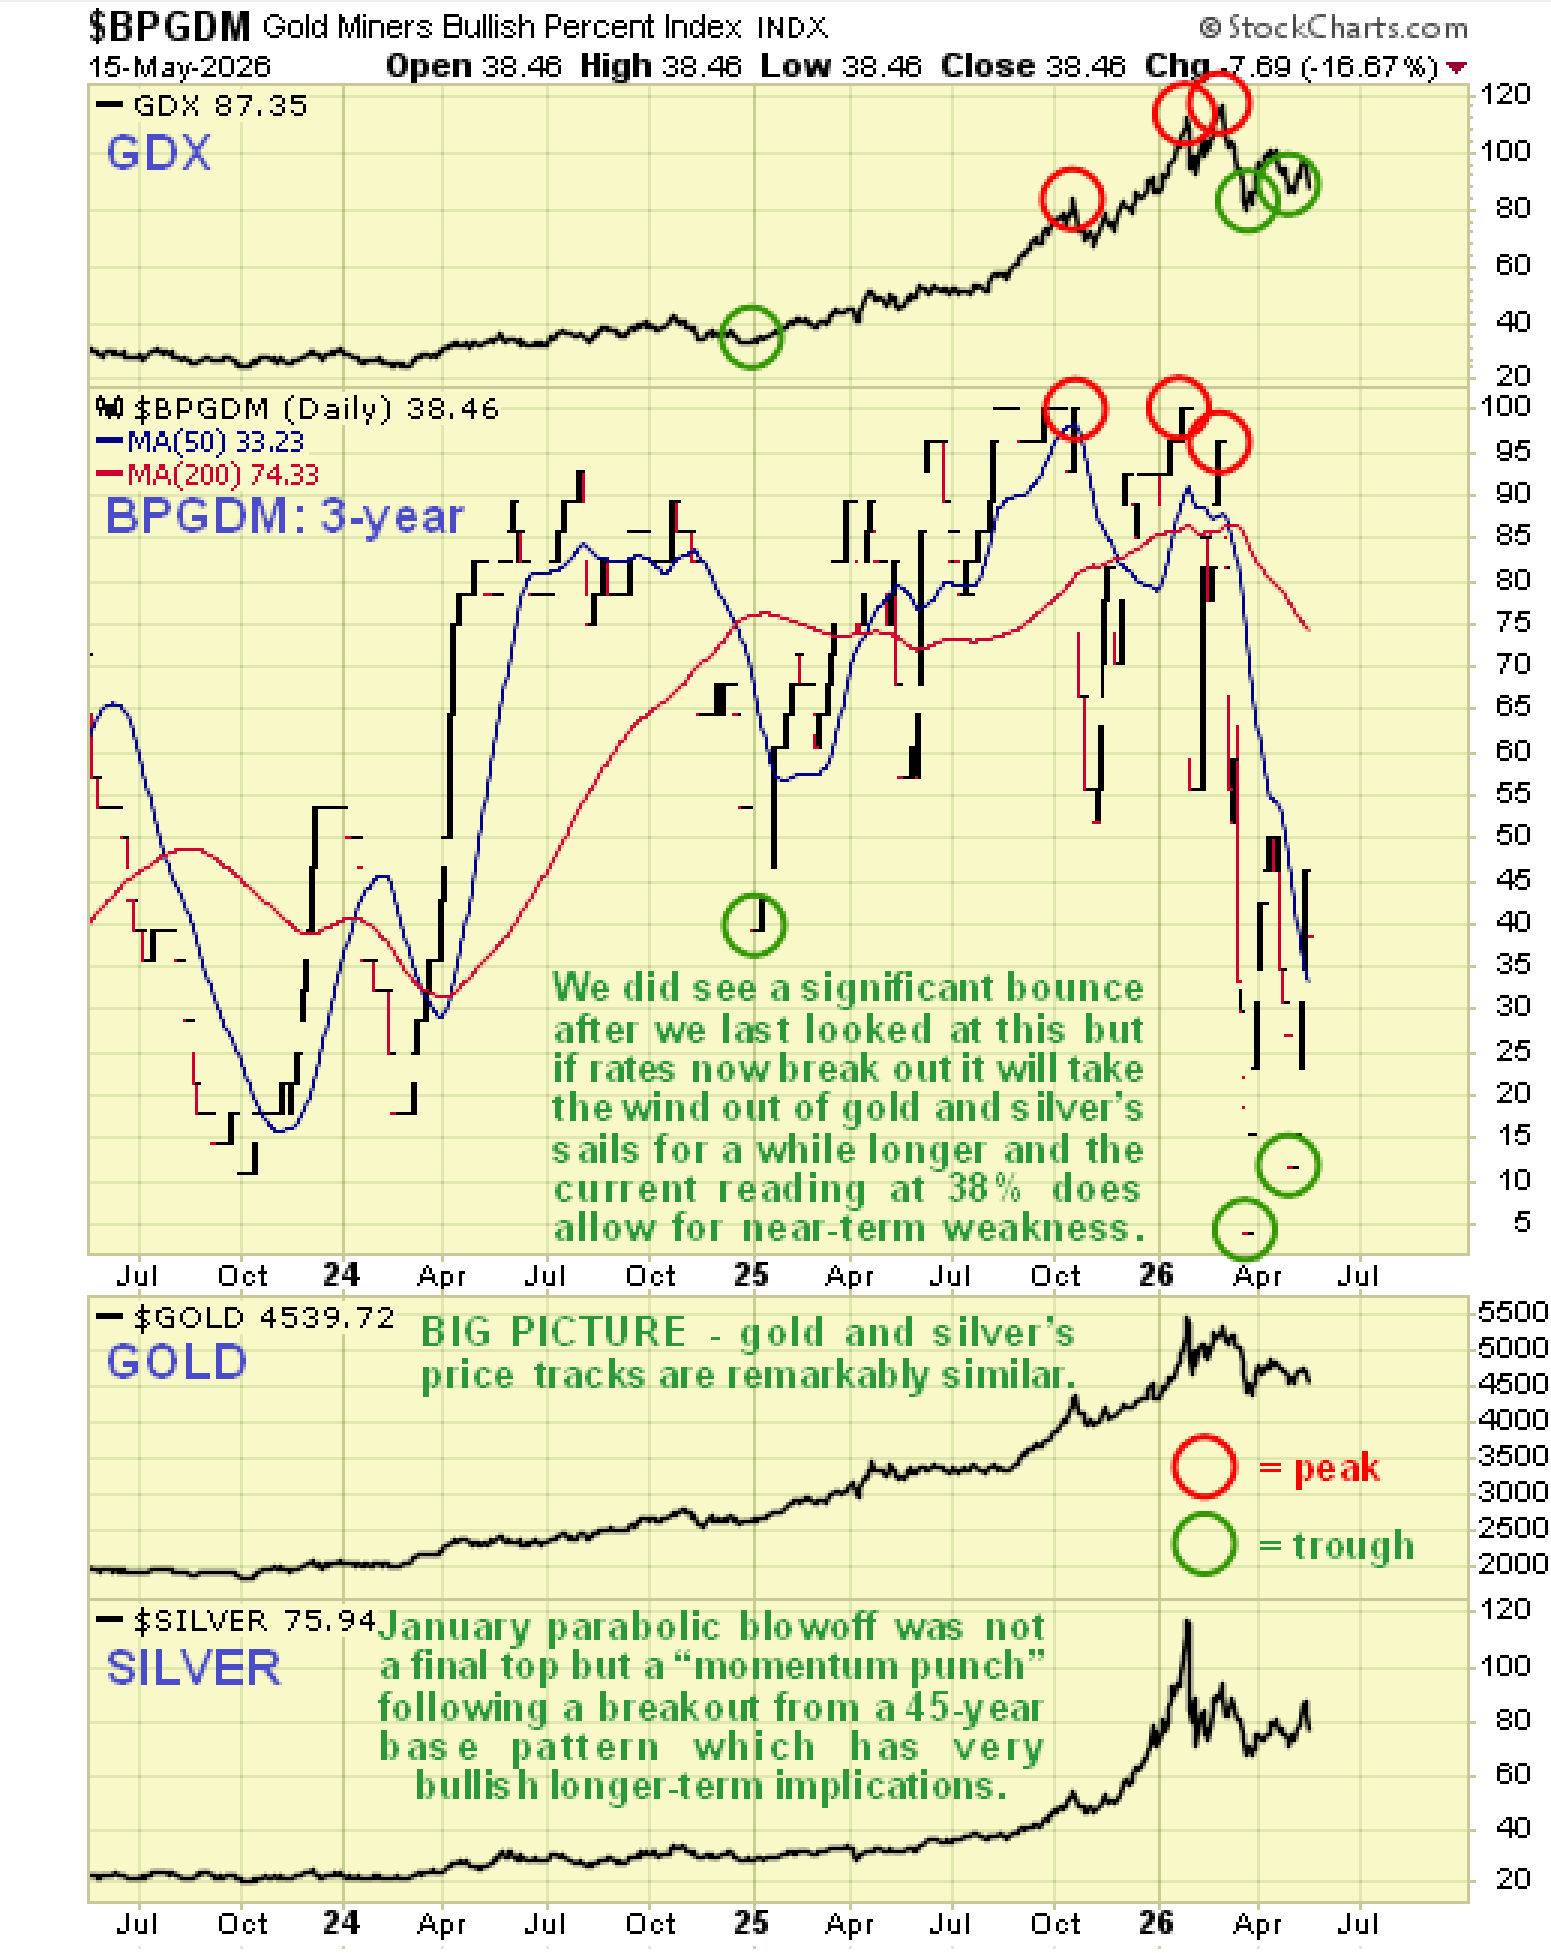
On the latest 3-year chart for the Gold Miners Bullish % Index we see that the very low reading early in the month did lead to a rally as expected, but this rally took it back up to 46%, thus creating the leeway for the drop we saw late last week, and with it still at 38% there is room for a further drop.
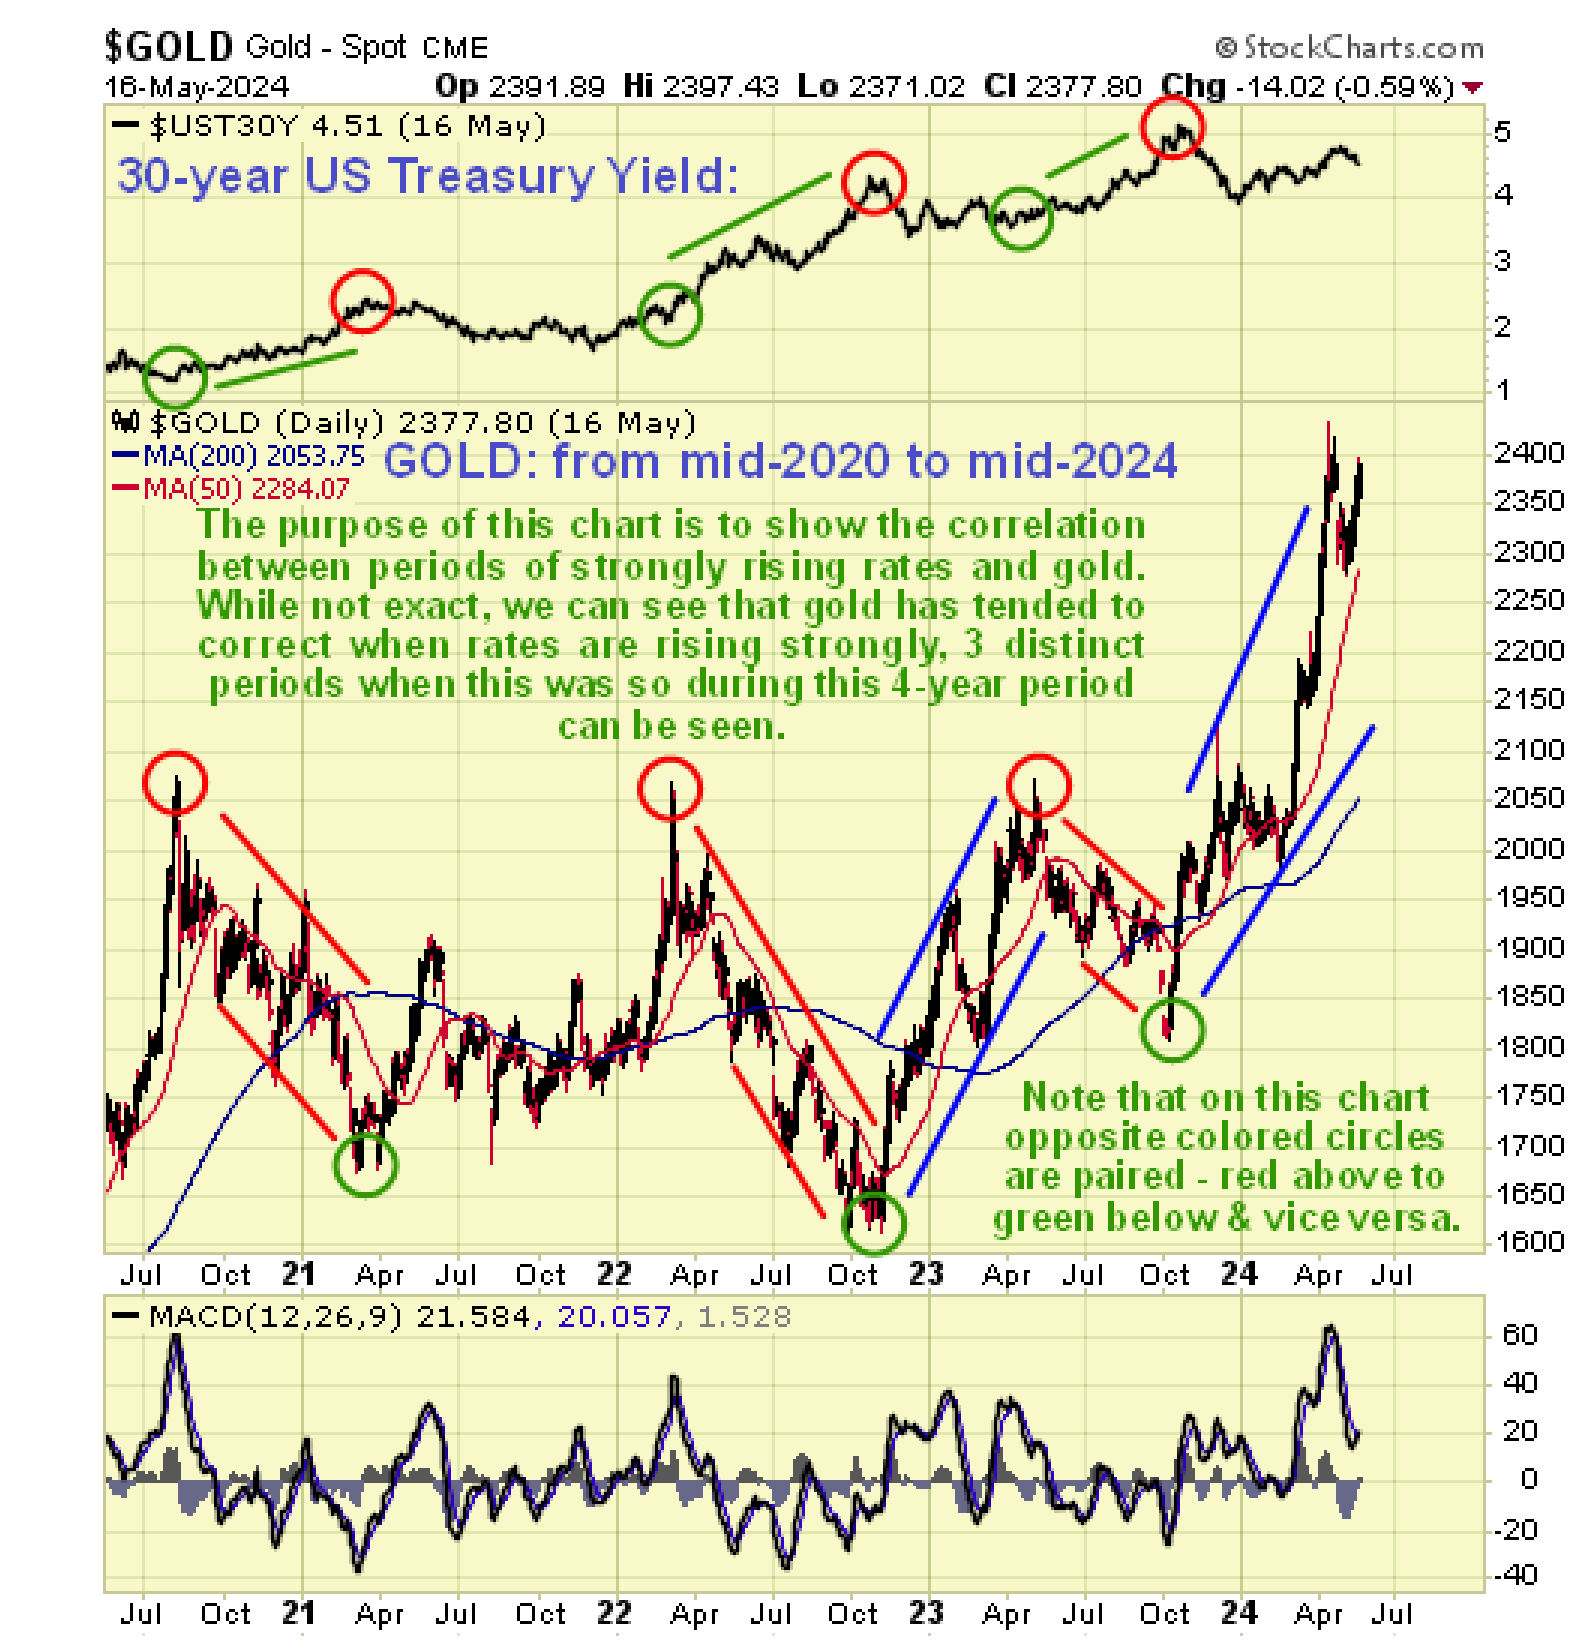
If we do see a completed breakout into a trend of rising rates that will likely take them up to the 10% area, what will the likely effect on gold be? To gauge this we can see what happened to gold during the period when rates had a number of strong rallies between early 2020 and late 2023. Here we see that gold tended to correct back when rates were rising strongly with the red circles for gold paired with the green circles for the Yield and vice versa. This of course suggests that if rates forge ahead soon then the Precious Metals will continue in a corrective phase, but against this we must set the other outstandingly bullish factors operating on gold, not least of which is ongoing aggressive Central Bank purchases, so further correction is likely to be shallow.
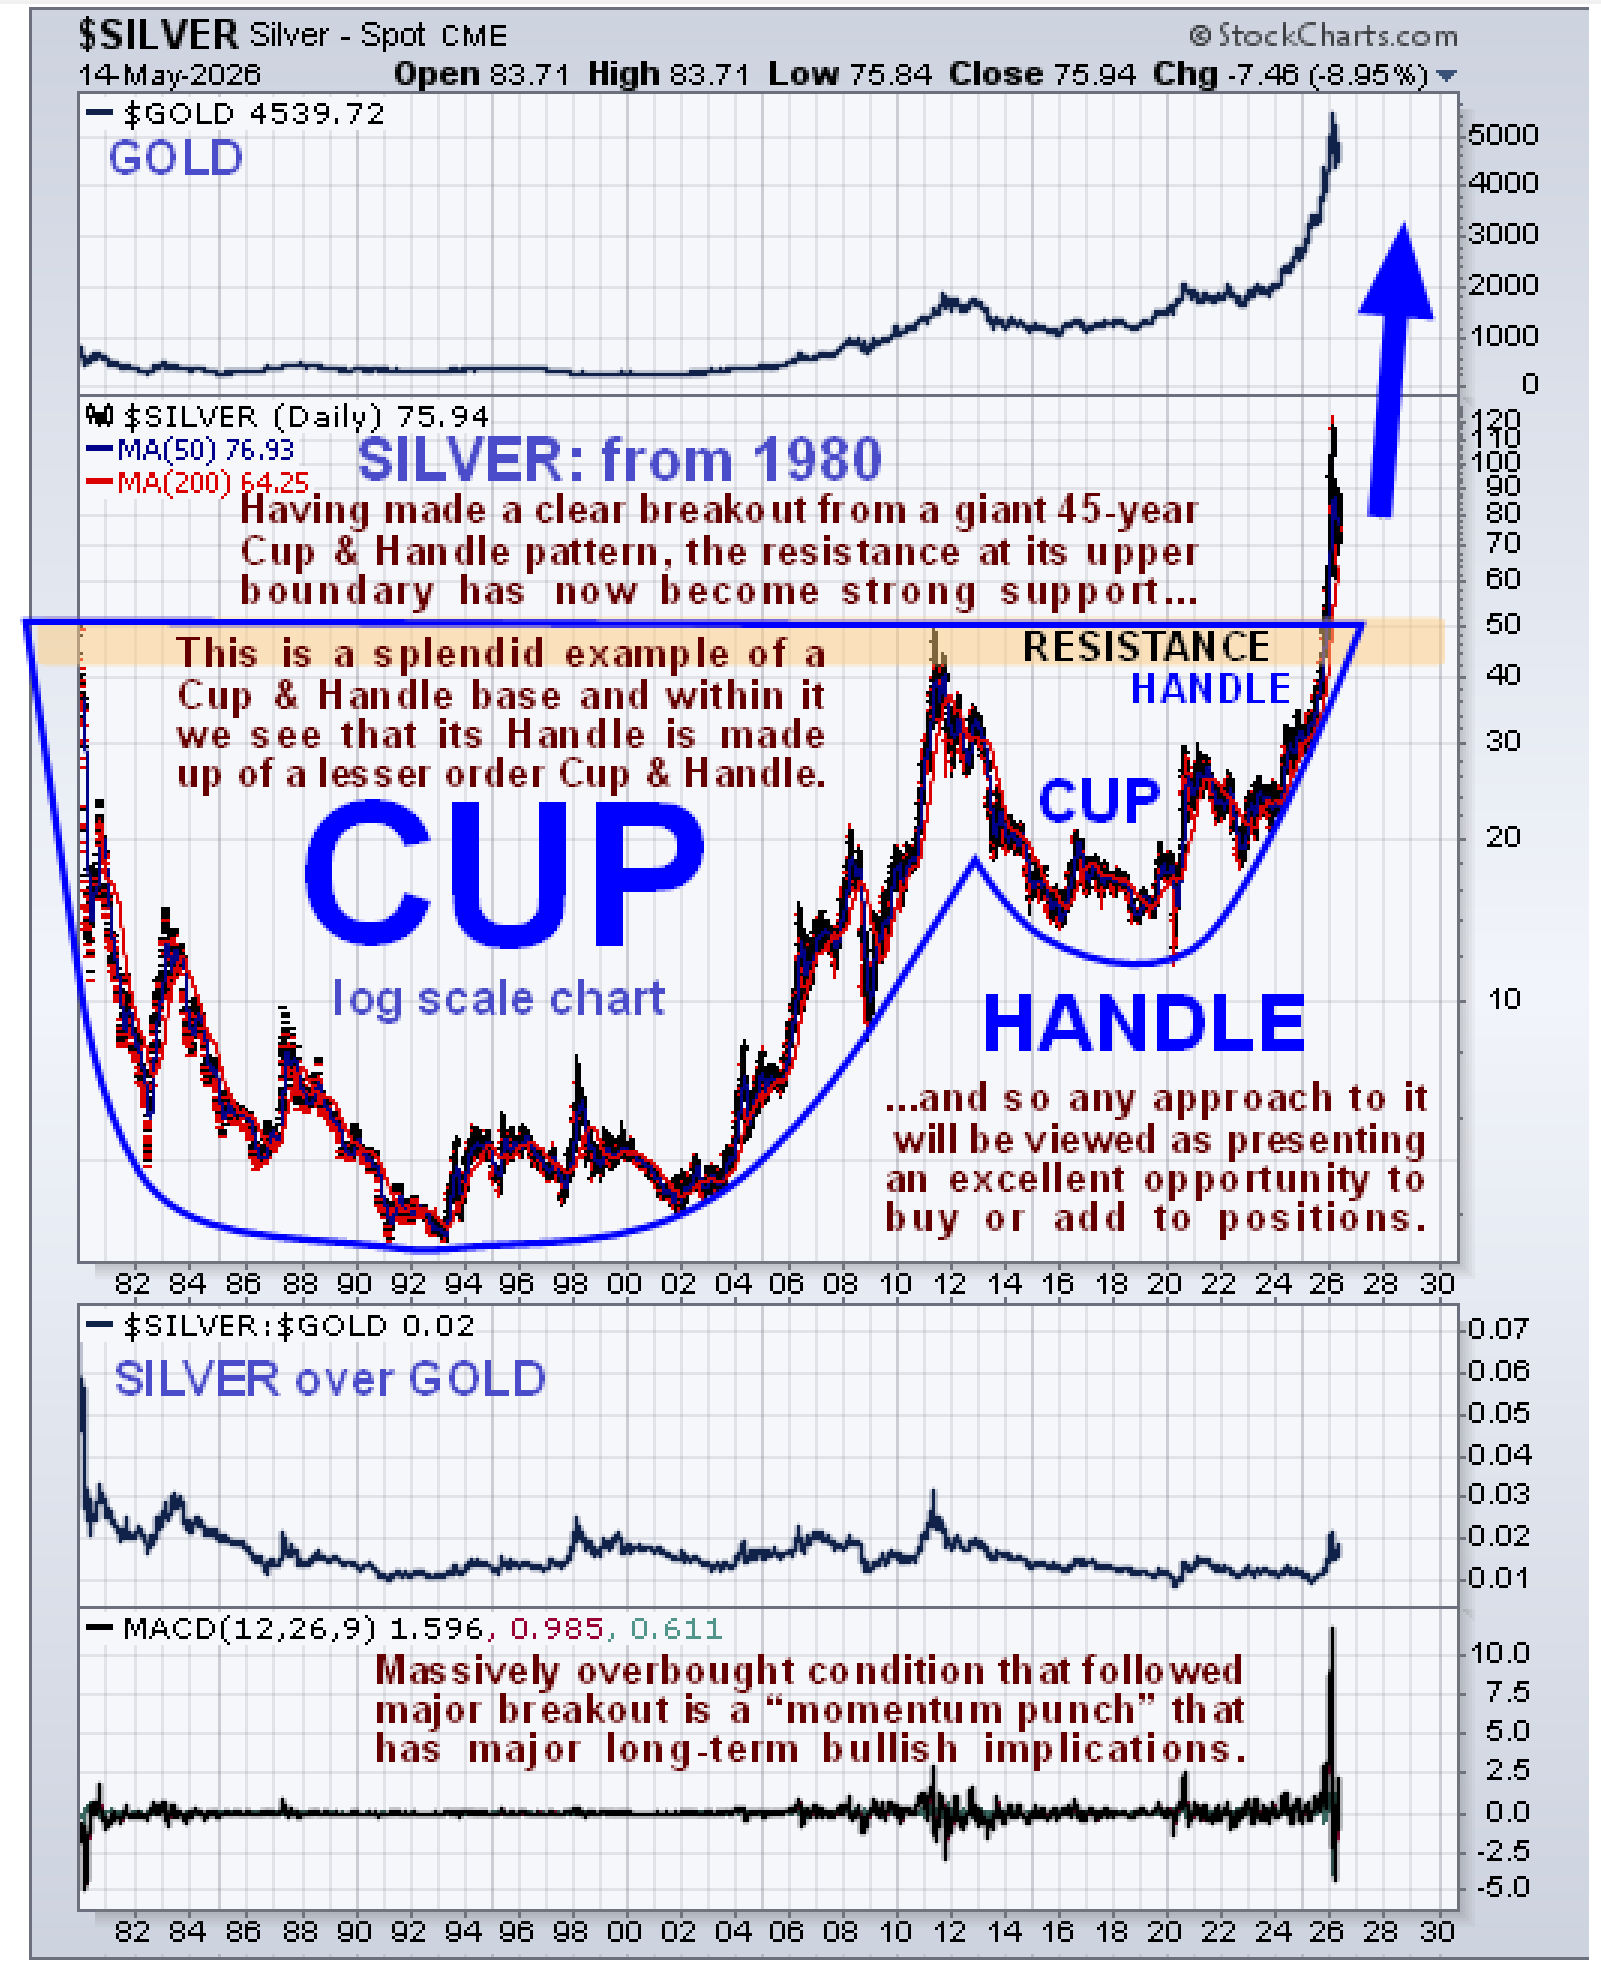
In closing it is important to remind ourslves that in the case of silver, having broken out from a 45-year Cup & Handle pattern late last year, massive underlying support means that its downside is limited and any decline towards or into this support will be regarded as presenting an exceptional opportunity to buy or add to positions…
End of update.
Posted at 5.00 pm EDT on 17th May 26.