In this update we are going to delineate downside targets for the current intermediate corrective downtrends in gold and silver and an associated downside target for copper, the main purpose being to highlight the best price areas to buy or add to positions across the sector.
Let’s start by setting out what we know.
- The intermediate corrective downtrends in gold and silver began when they reversed from their late January blowoff tops and remain in force until they don’t which will be when their prices break out of these downtrends
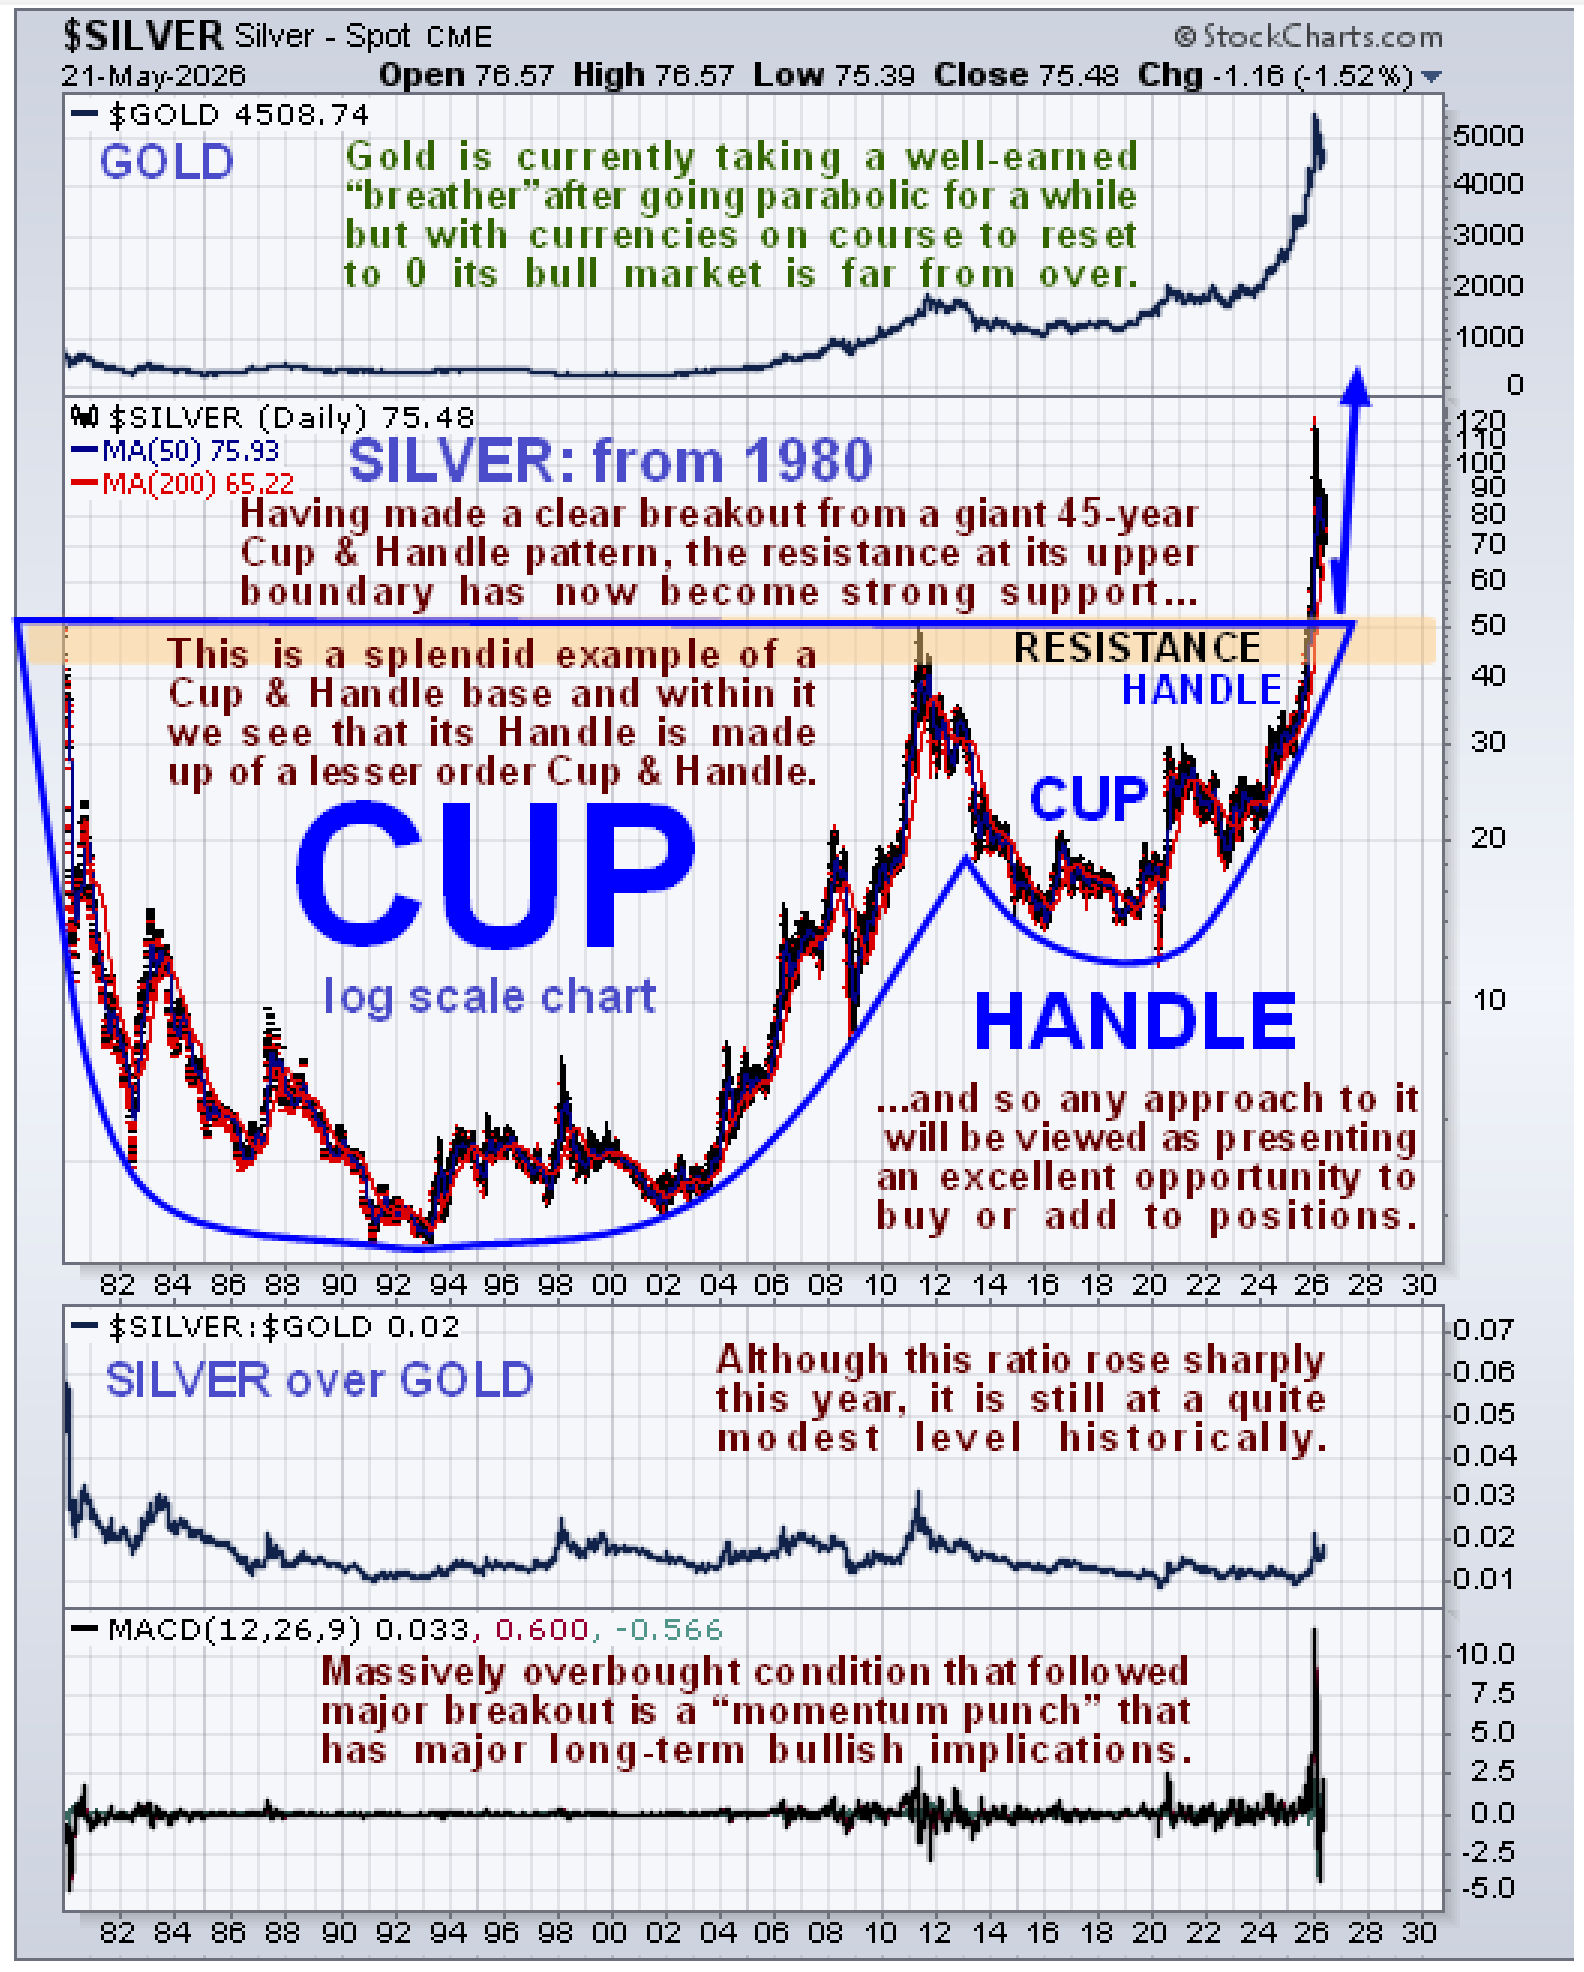
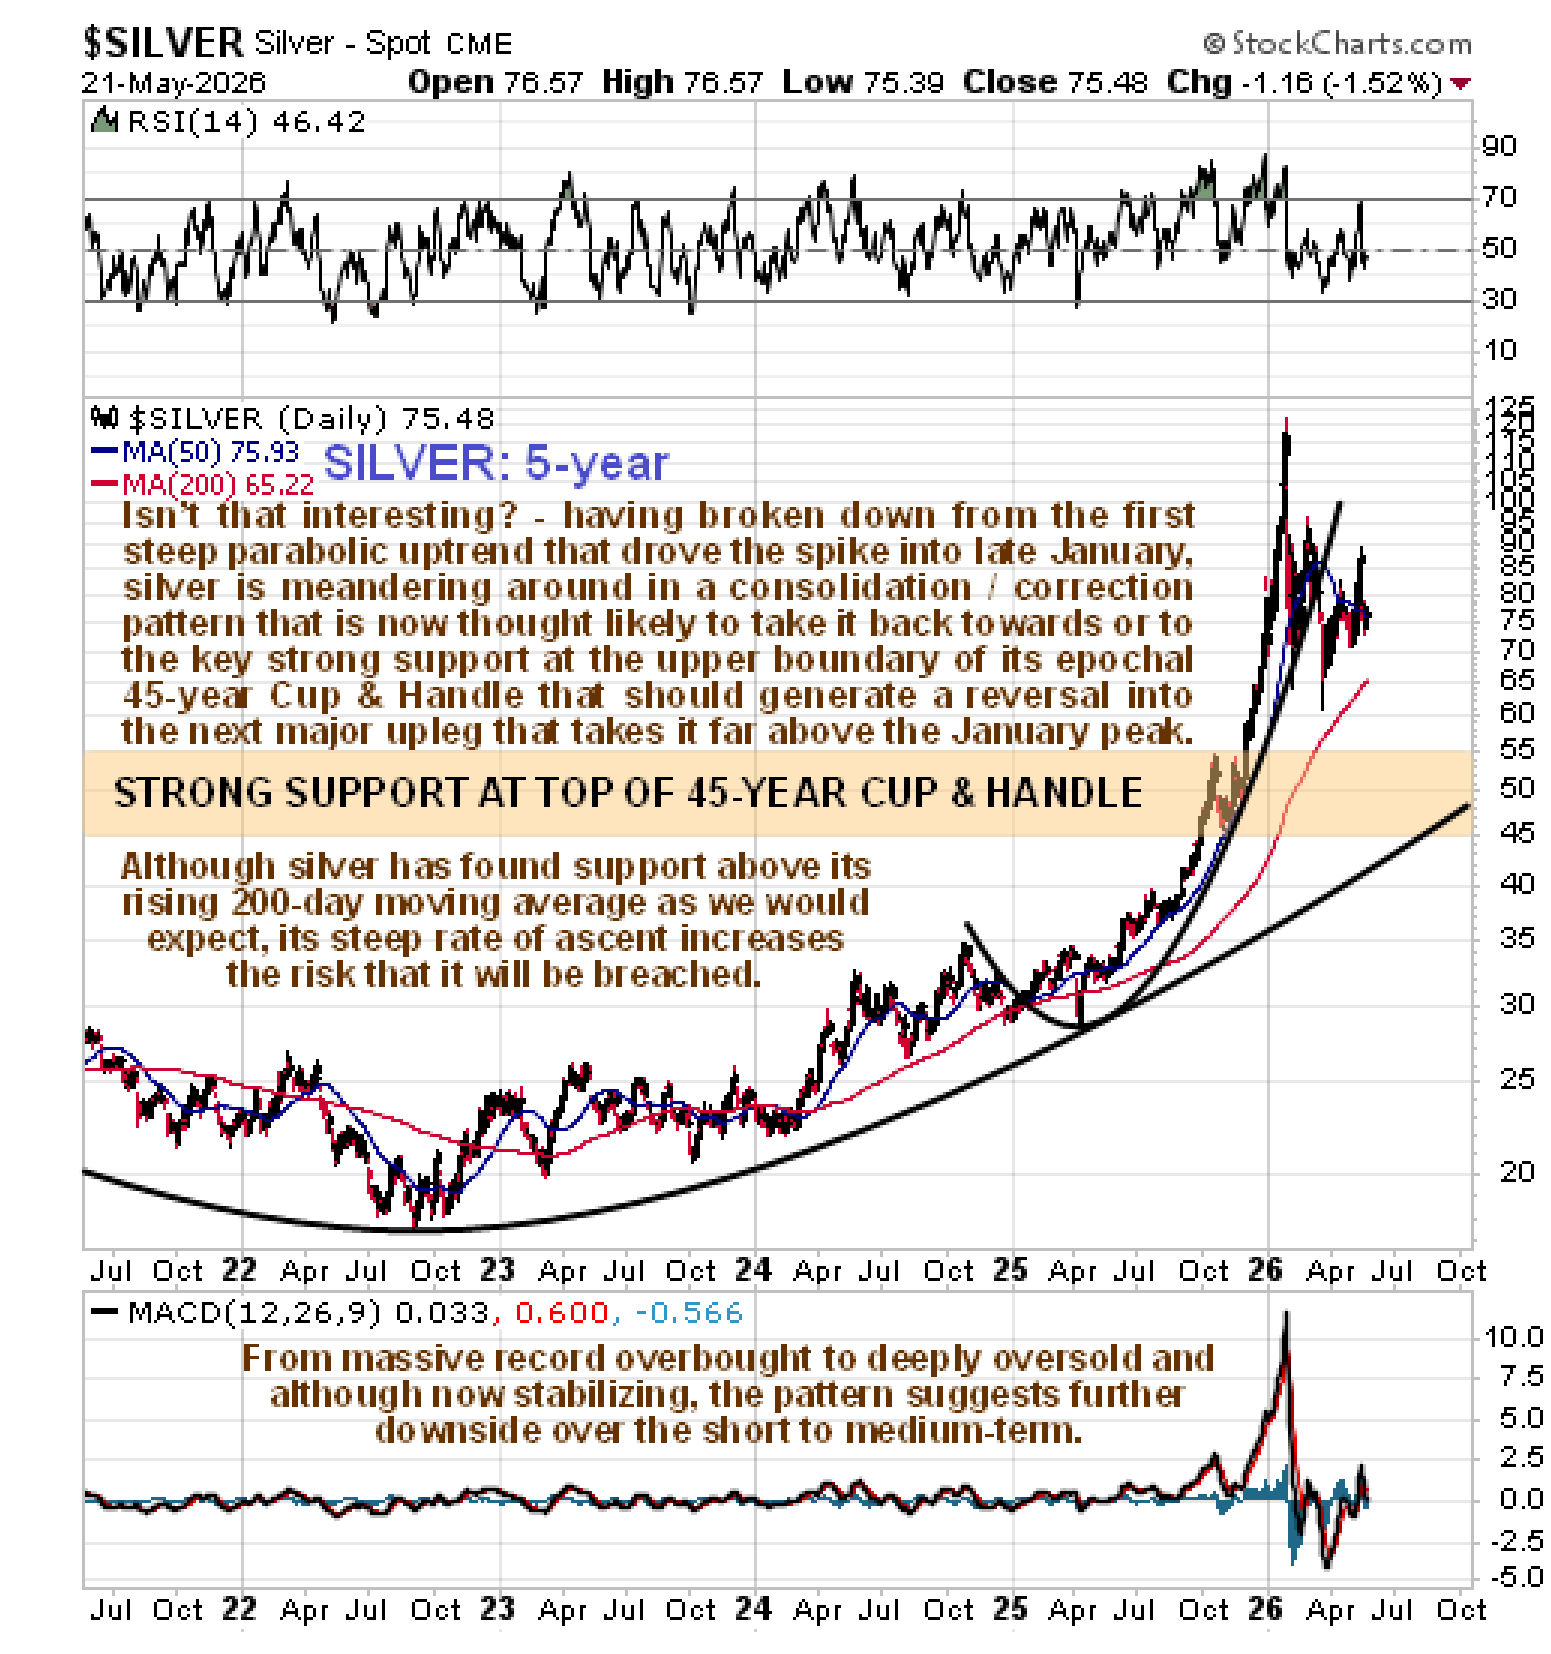
- The major long-term uptrends in gold and silver (and copper) remain very much in force – nowhere is this clearer than with silver, which late last year broke out of a gigantic 45-year holding pattern to commence a bull market of epochal proportions – see its chart from 1980 below.
- With gold and silver converging with their moving averages, especially their respective 200-day averages, we are arriving at an inflexion point that will force a breakout one way or the other – and the weight of the evidence points to a continuation of the current intermediate downtrends, which means that they will probably break below their 200-day averages into another downleg that brings prices down to strong support that is expected to end this downtrend, leading to a resumption of the larger uptrend as another major upleg begins that takes most metals confortably to new highs (gold, silver, copper, platinum, palladium etc).
Now we will review a range of charts for gold and silver to see exactly where we are on the “market clock” for these metals.
We will begin with very long-term charts going all the way back to 1980.
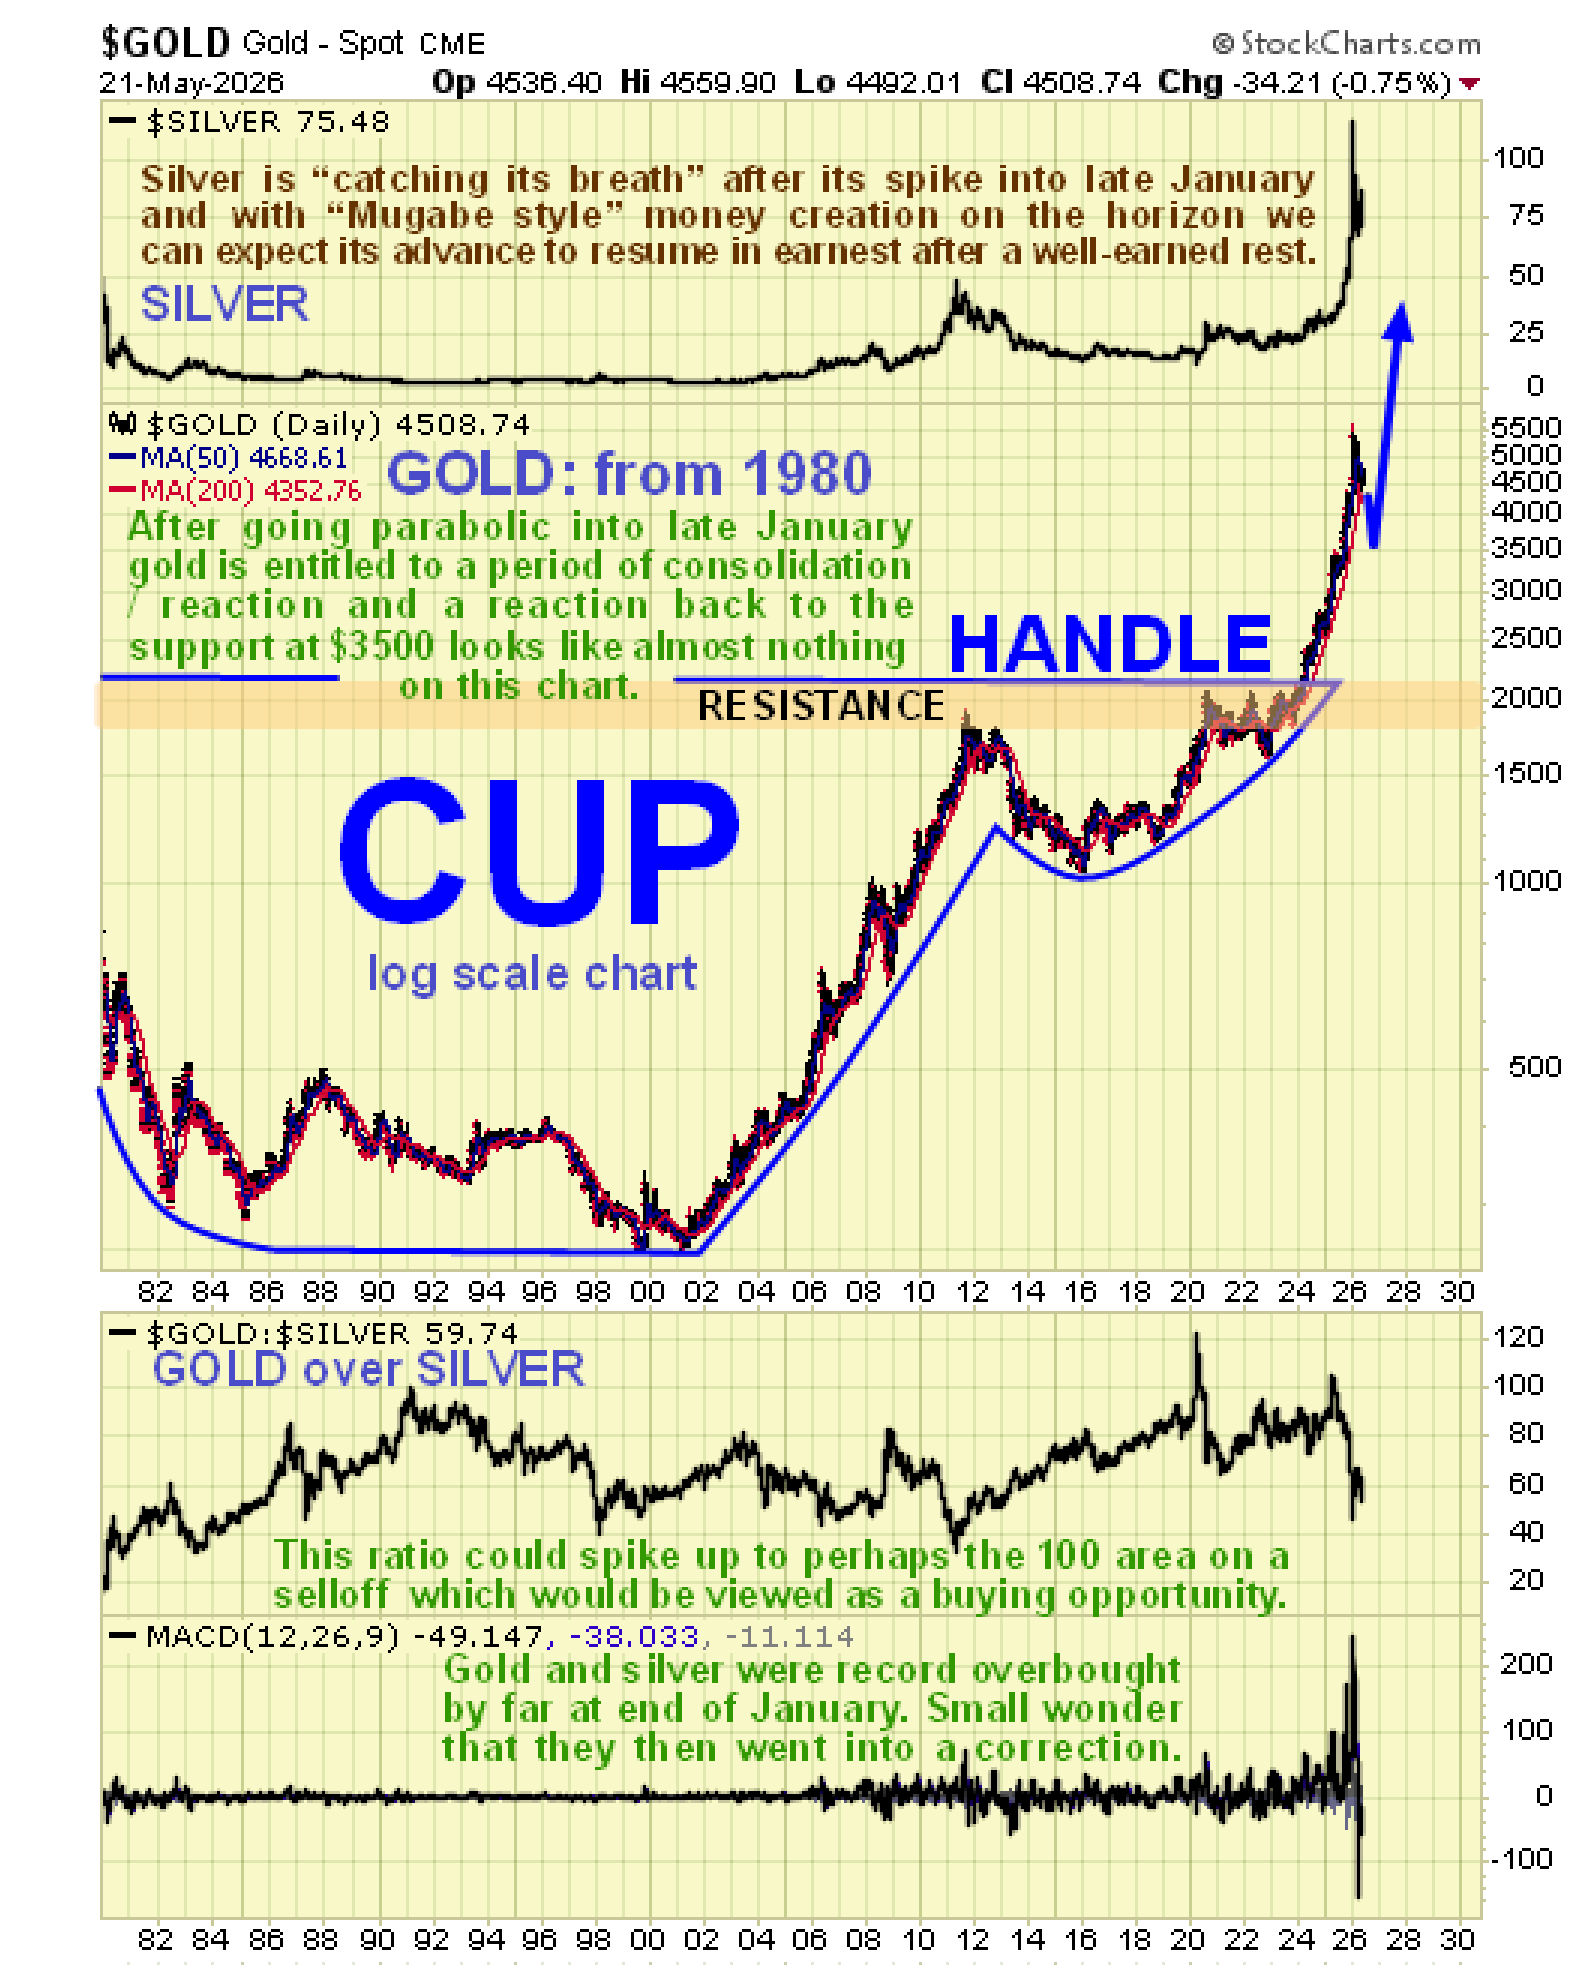
Starting with the chart for gold from 1980 we see that early in 2024 it broke out of a gigantic Cup & Handle holding pattern that had been forming from that time. This was a major technical development that not surprisingly led to the big rally that we saw in gold in 2024 and 2025 and into January of this year. After such an impressive run that resulted in its becoming massively overbought, it was entitled to take a rest and that has been what it has been doing since January. However, we should not lose sight of the enormous significance of that breakout which is an indication that it is going much higher – hardly surprising when you factor in that most currencies will end up being totally worthless, as Egon Von Greyerz has repeatedly pointed out. Therefore we will seize on the opportunity being presented by the current correction to buy / add to positions are very favorable prices and will use shorter-term charts included below to pinpoint optimum buy levels.
It’s a very similar story with silver, the main difference being that whereas gold broke out from its giant pattern early in 2024, it took silver until late last last year to break out and really get moving so only 6 months ago, but this is normal as gold leads silver in bull markets.
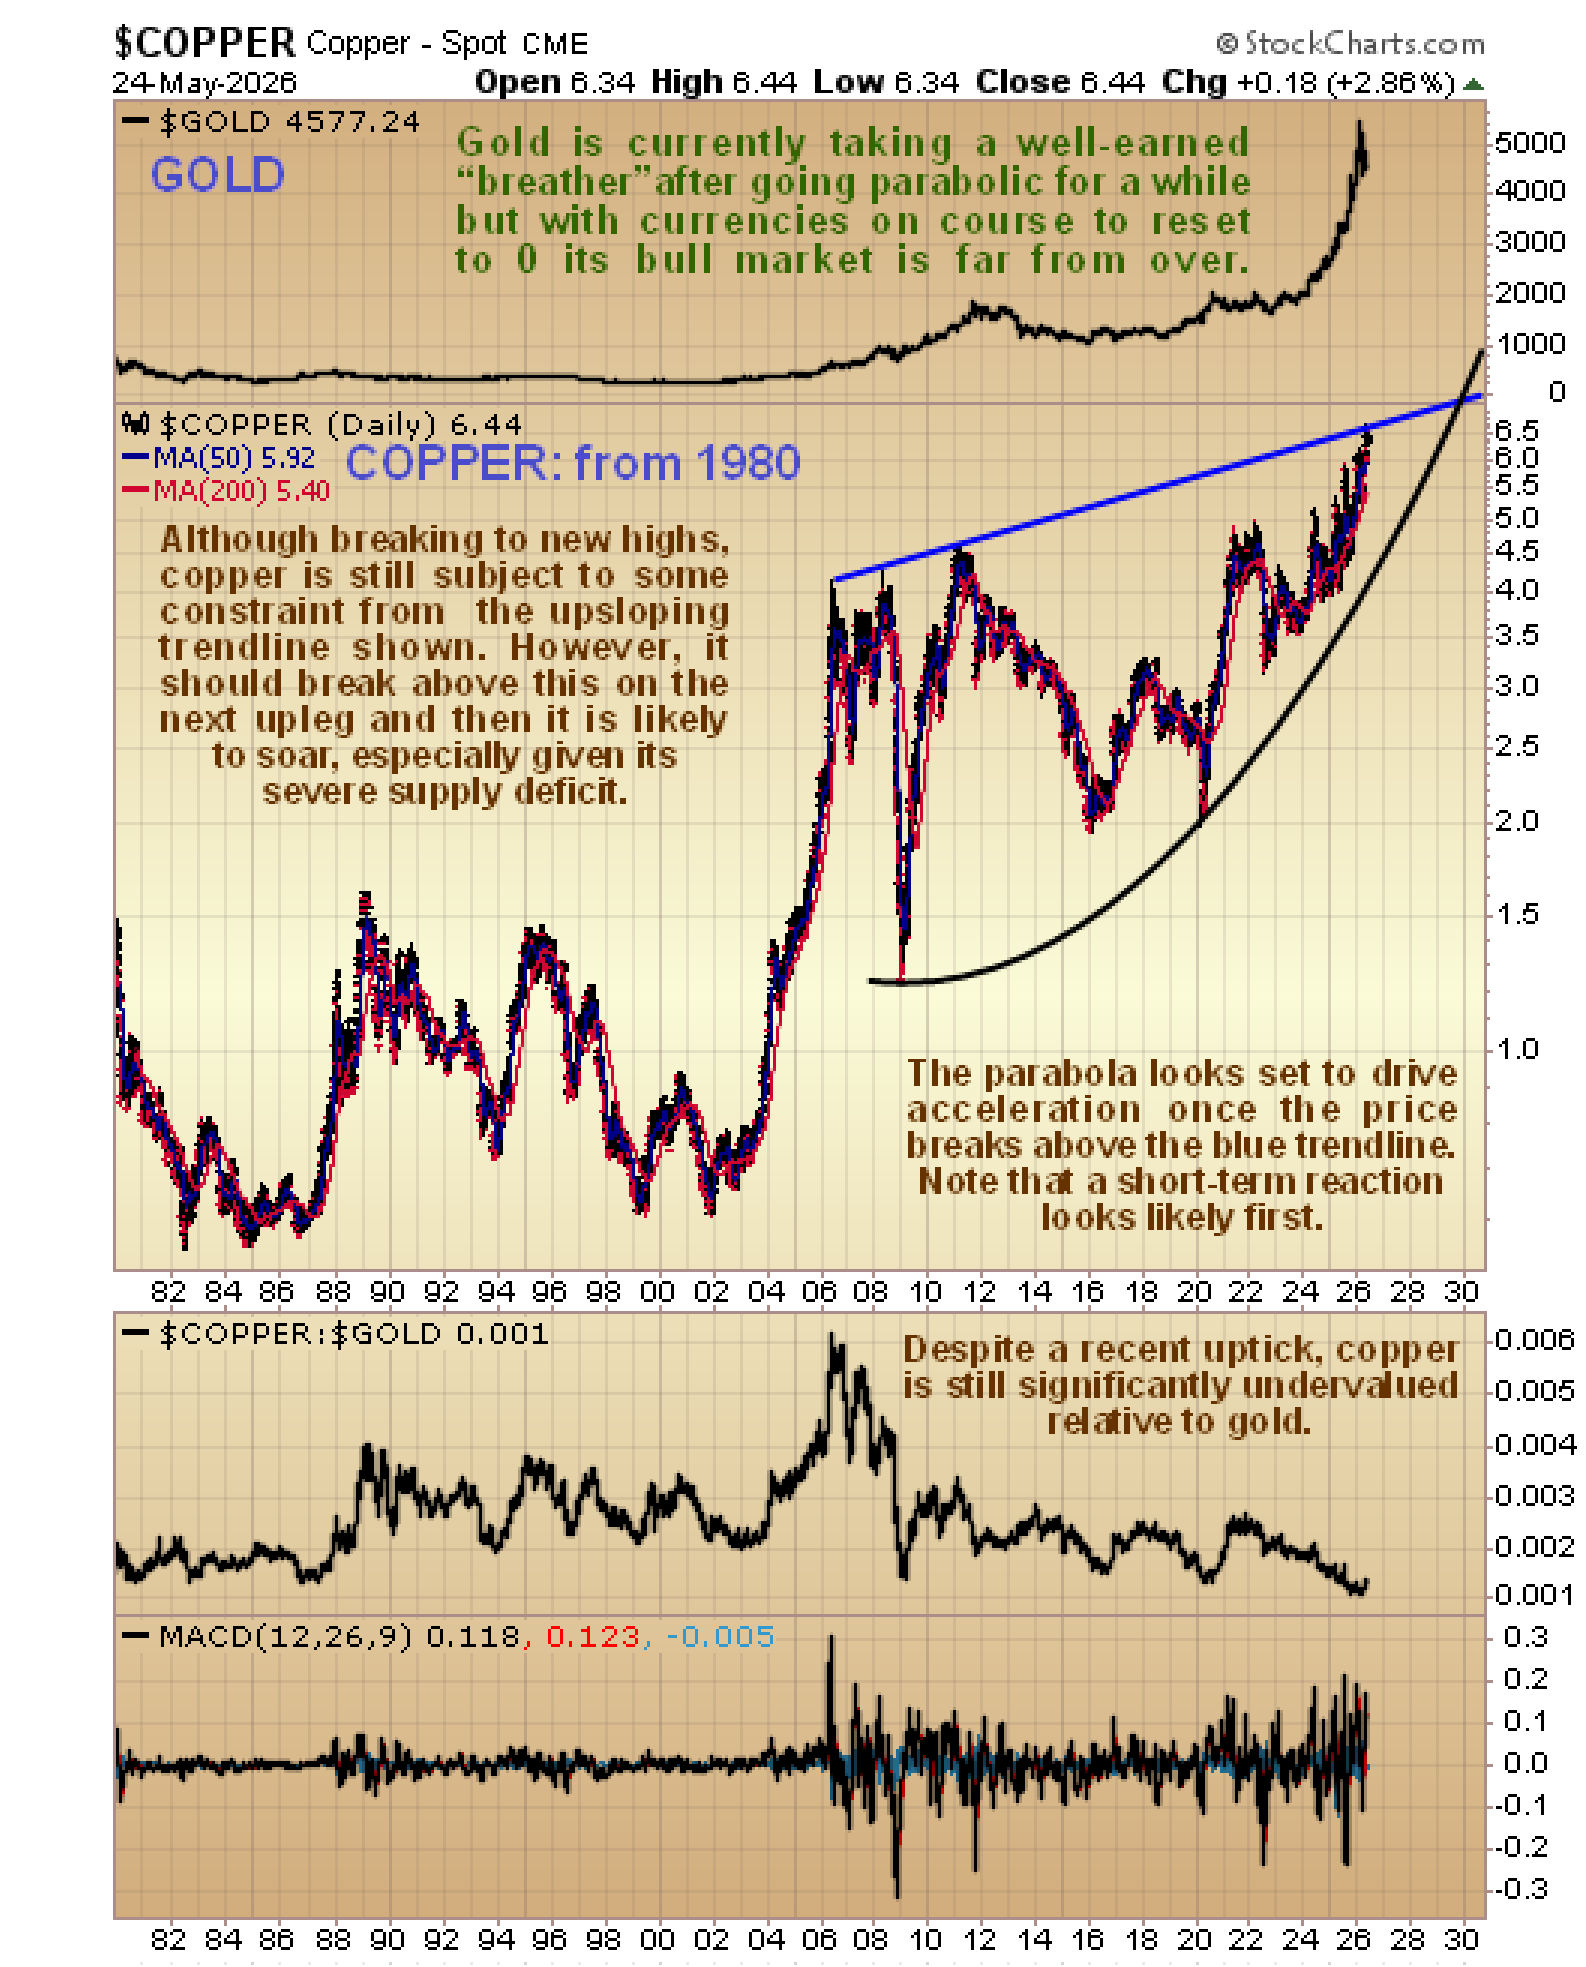
Meanwhile, copper’s long-term chart from 1980 is most encouraging, for although we can see that it is still being subjected to some constraint from the upsloping trendline shown, which may lead in the current circumstances to the reaction that the shorter-term chart portends, we can also see that the parabolic uptrend is shepherding it towards a breakout above this line that should lead to a dramatic acceleration in its rate of advance – hardly surprising given the exceptionally positive long-term outlook for gold and silver…
Now we will zoom in on the action of recent years in gold and silver (but not copper) using 5-year charts which show all of the action leading up to and following the breakouts from their giant patterns in much more detail.
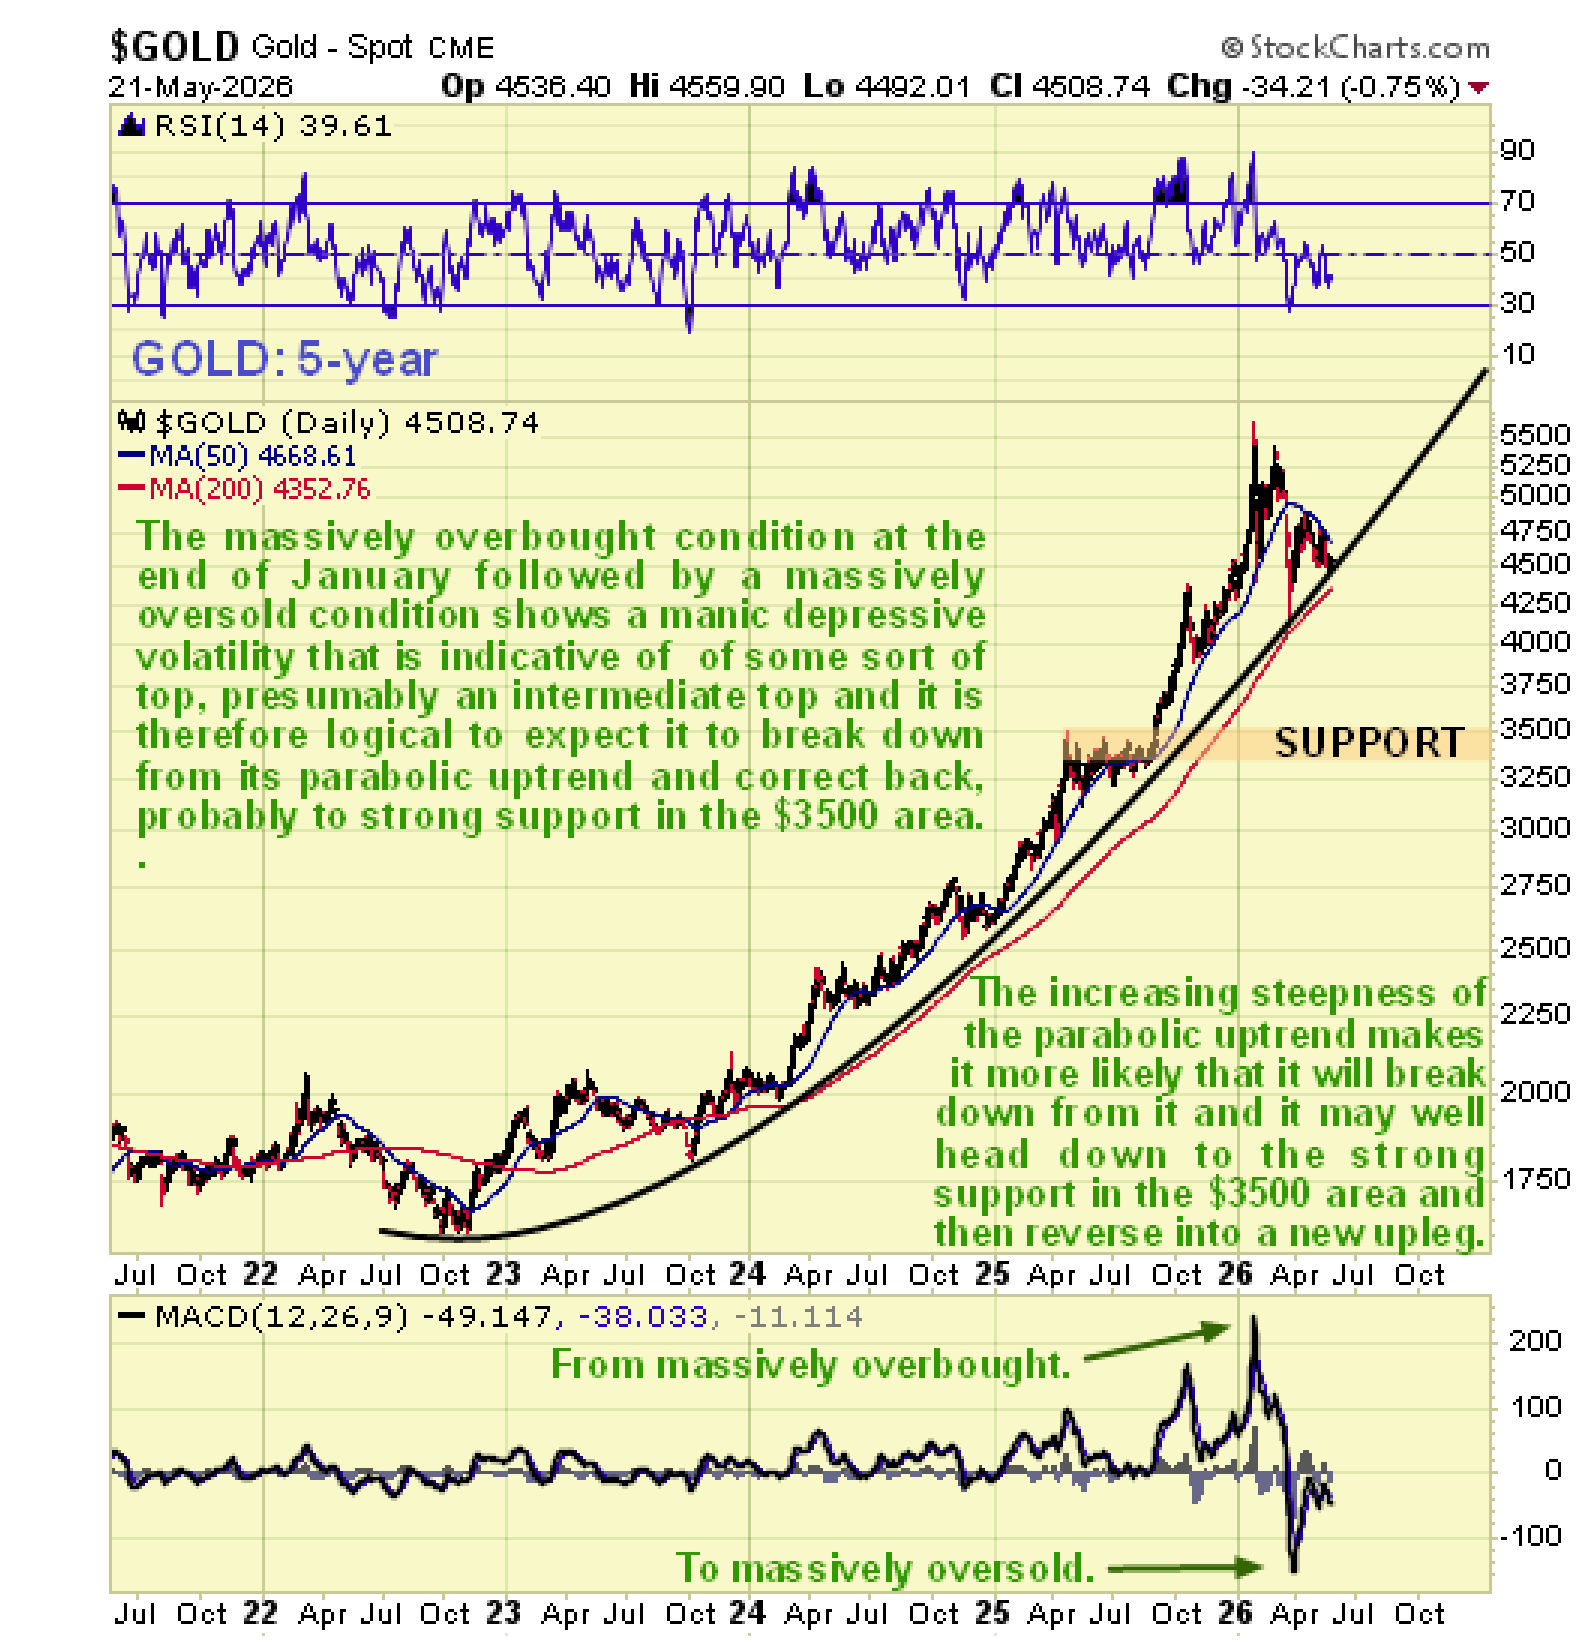
Starting with gold’s 5-year chart we see that it finally bust through key resistance level at the $2000 - $2100 level early in 2024 and then didn’t look back – it soared, accelerating to the upside above a parabolic uptrend but at last, with silver going vertical in January, the uptrend destabilised in conditions of extreme volatility, leading to a blowoff top and the current reactive phase – but thus far the parabolic uptrend has held, although we are now clearly at a critical juncture as it is right at its boundary. Will the parabolic uptrends in these metals hold and if not what can we expect? – these are the questions that this article is intended to answer.
On silver’s 5-year chart we can see that it was a similar story, the difference being that once silver broke clear out of its giant 45-year pattern, the speculative crowd piled in, driving it to insane record overbought extremes that called for the current cooling off period. The current steep rate of ascent of its 200-day moving averages suggests that the prie is likely to break below it soon, which can be expected to lead to a further drop back towards the strong support at the breakout point which just happens to be not far above the less steep longer-term parabolic support that is no starting to come into lay beneath.
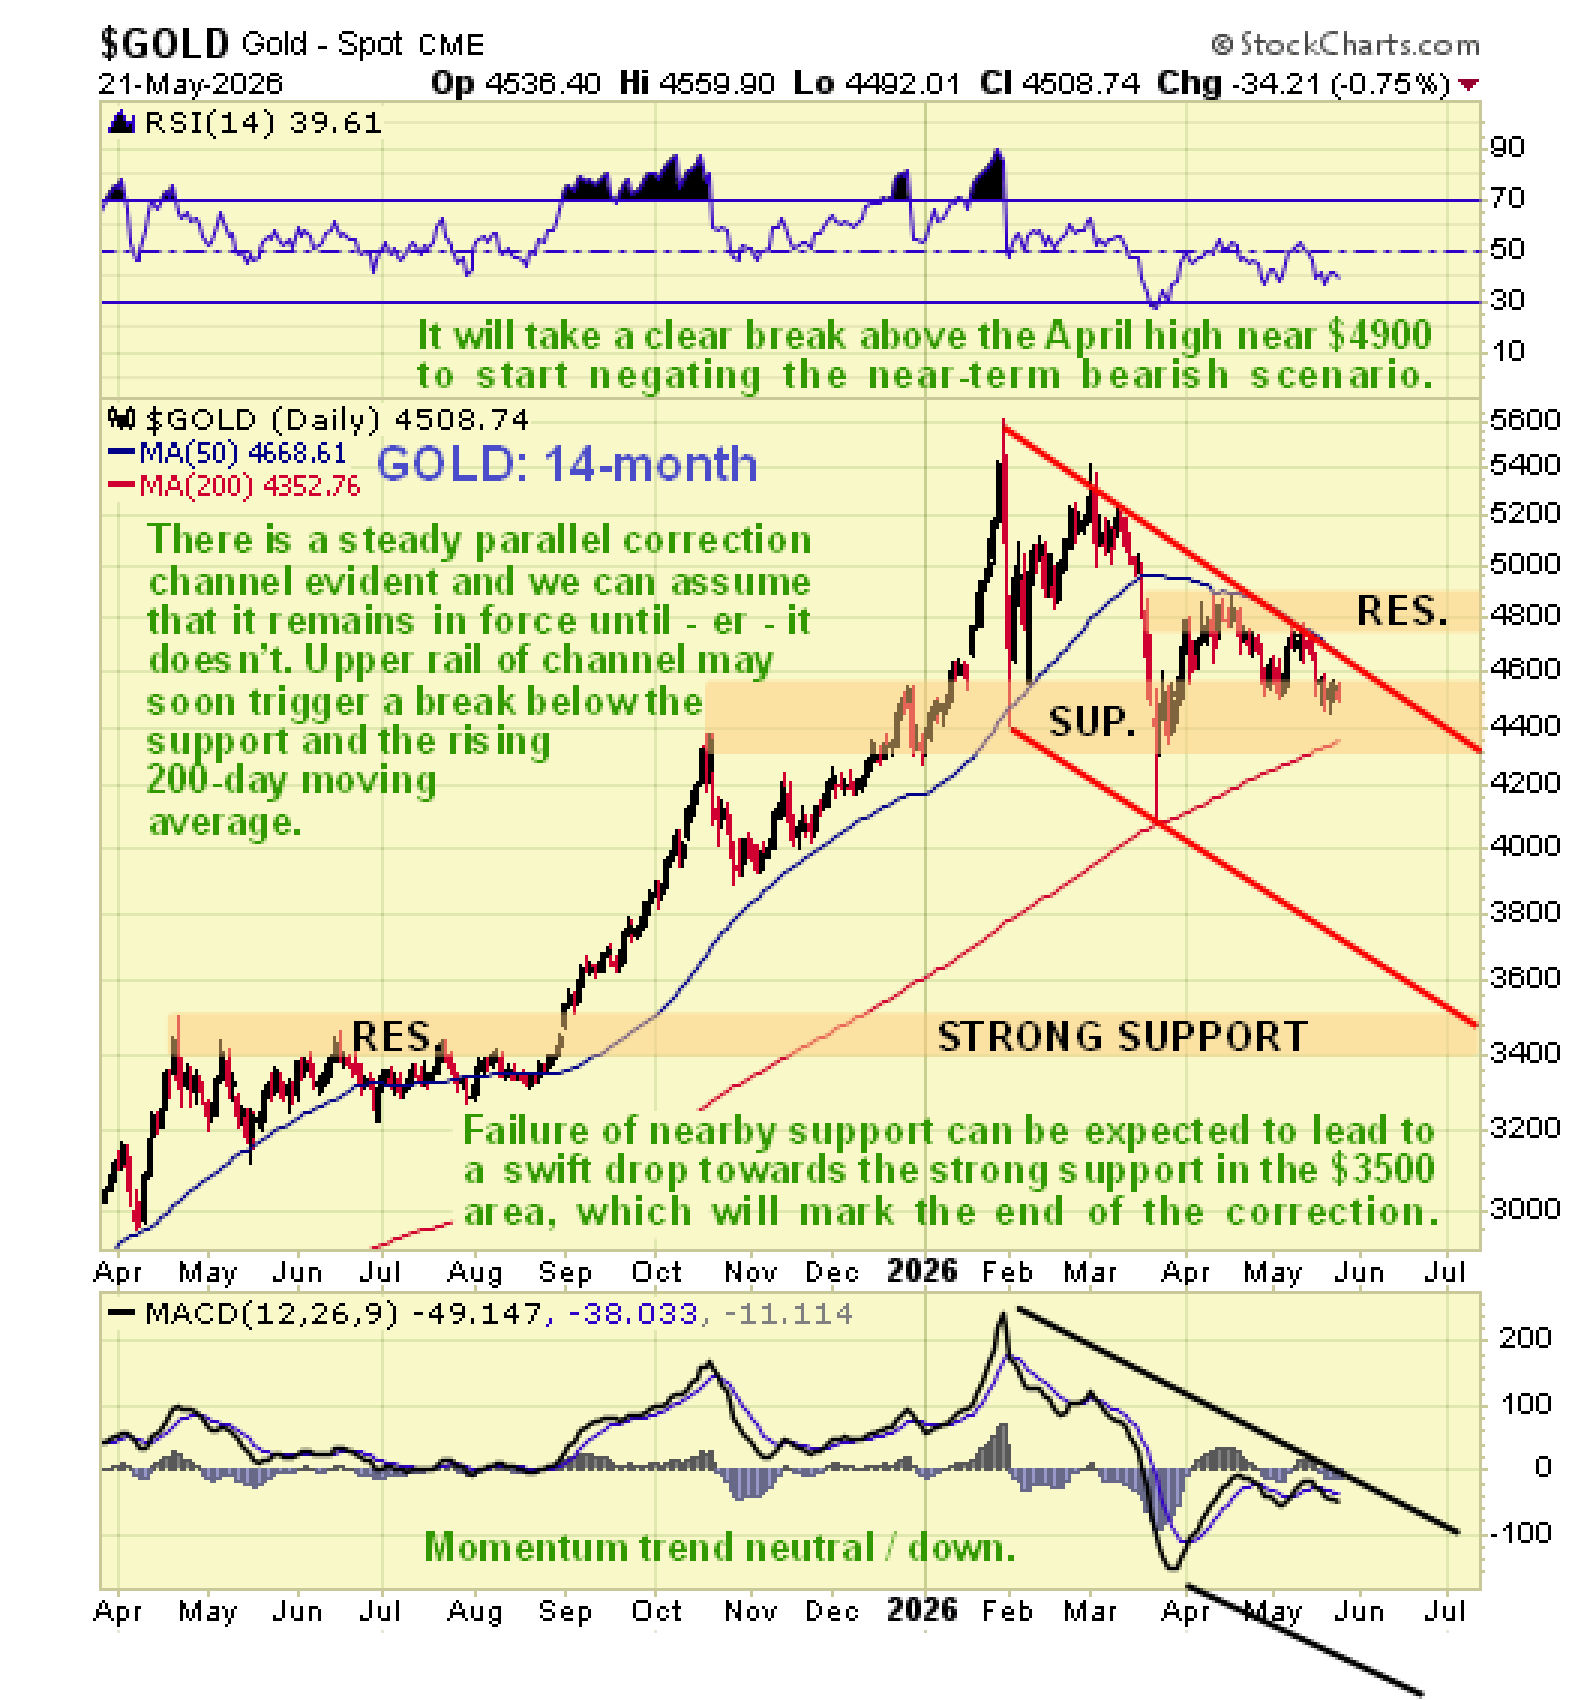
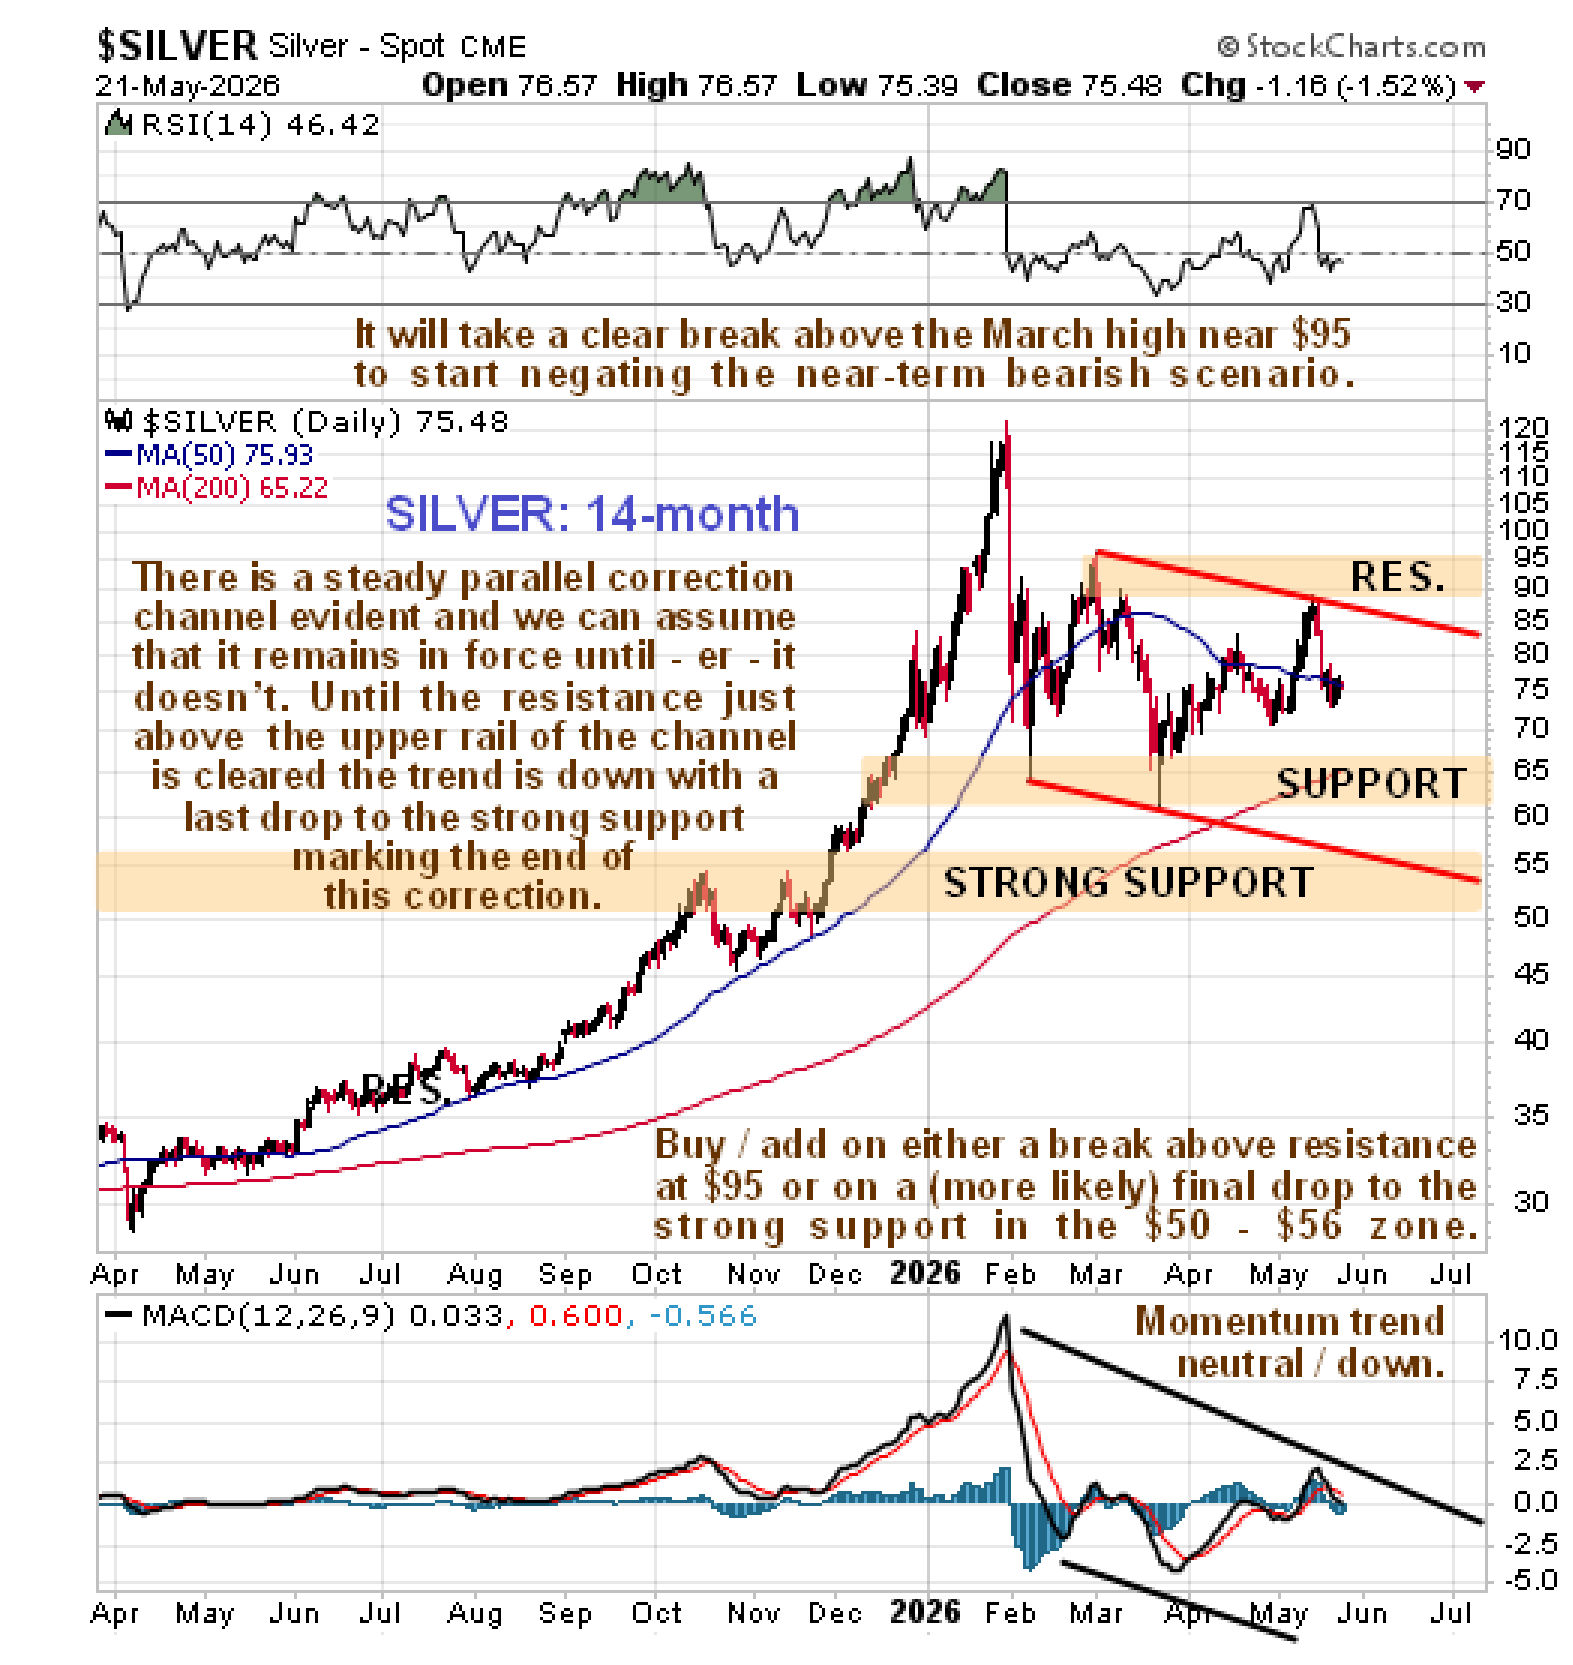
Now we will take a closer look at the corrective downtrends in gold and silver on 14-month charts, which make it easier for us to see exactly what is going on. The first thing to observe is that the downtrends are parallel and relatively orderly and quite well defined. This is helpful as it means we can adopt a mechanical approach and do not need to resort to the pedantry of agonizing over fundamentals. To start with it means that we can view the downtrends as remaining in force until the price breaks above them.
In gold’s case we can see that the downtrend is very well defined with the price so far being beaten back every time it arrives at its upper boundary and with the price and its moving averages converging rapidly, it’s decision time – it either breaks out into another upleg soon, or it breaks into another downleg which if it happens will be exacerbated by the 200-day moving average being breached. Such a downleg is expected to take it to the lower boundary of the channel and also the strong support at the top of the trading range that formed before the August 25 breakout into a strong upleg – i.e. to the $3,500 area. If it breaks to the upside we will want to see it confirmed by the price also breaking above the nearby resistance at the early April highs.
If gold breaks lower then so of course will silver and its downleg can be expected to take it down to the lower boundary of its downttend channel and not coincidentally to the strong support at the breakout point of its giant 45-year pattern, meaning roughly to the $50 - $55 price zone where it will be a very strong buy...
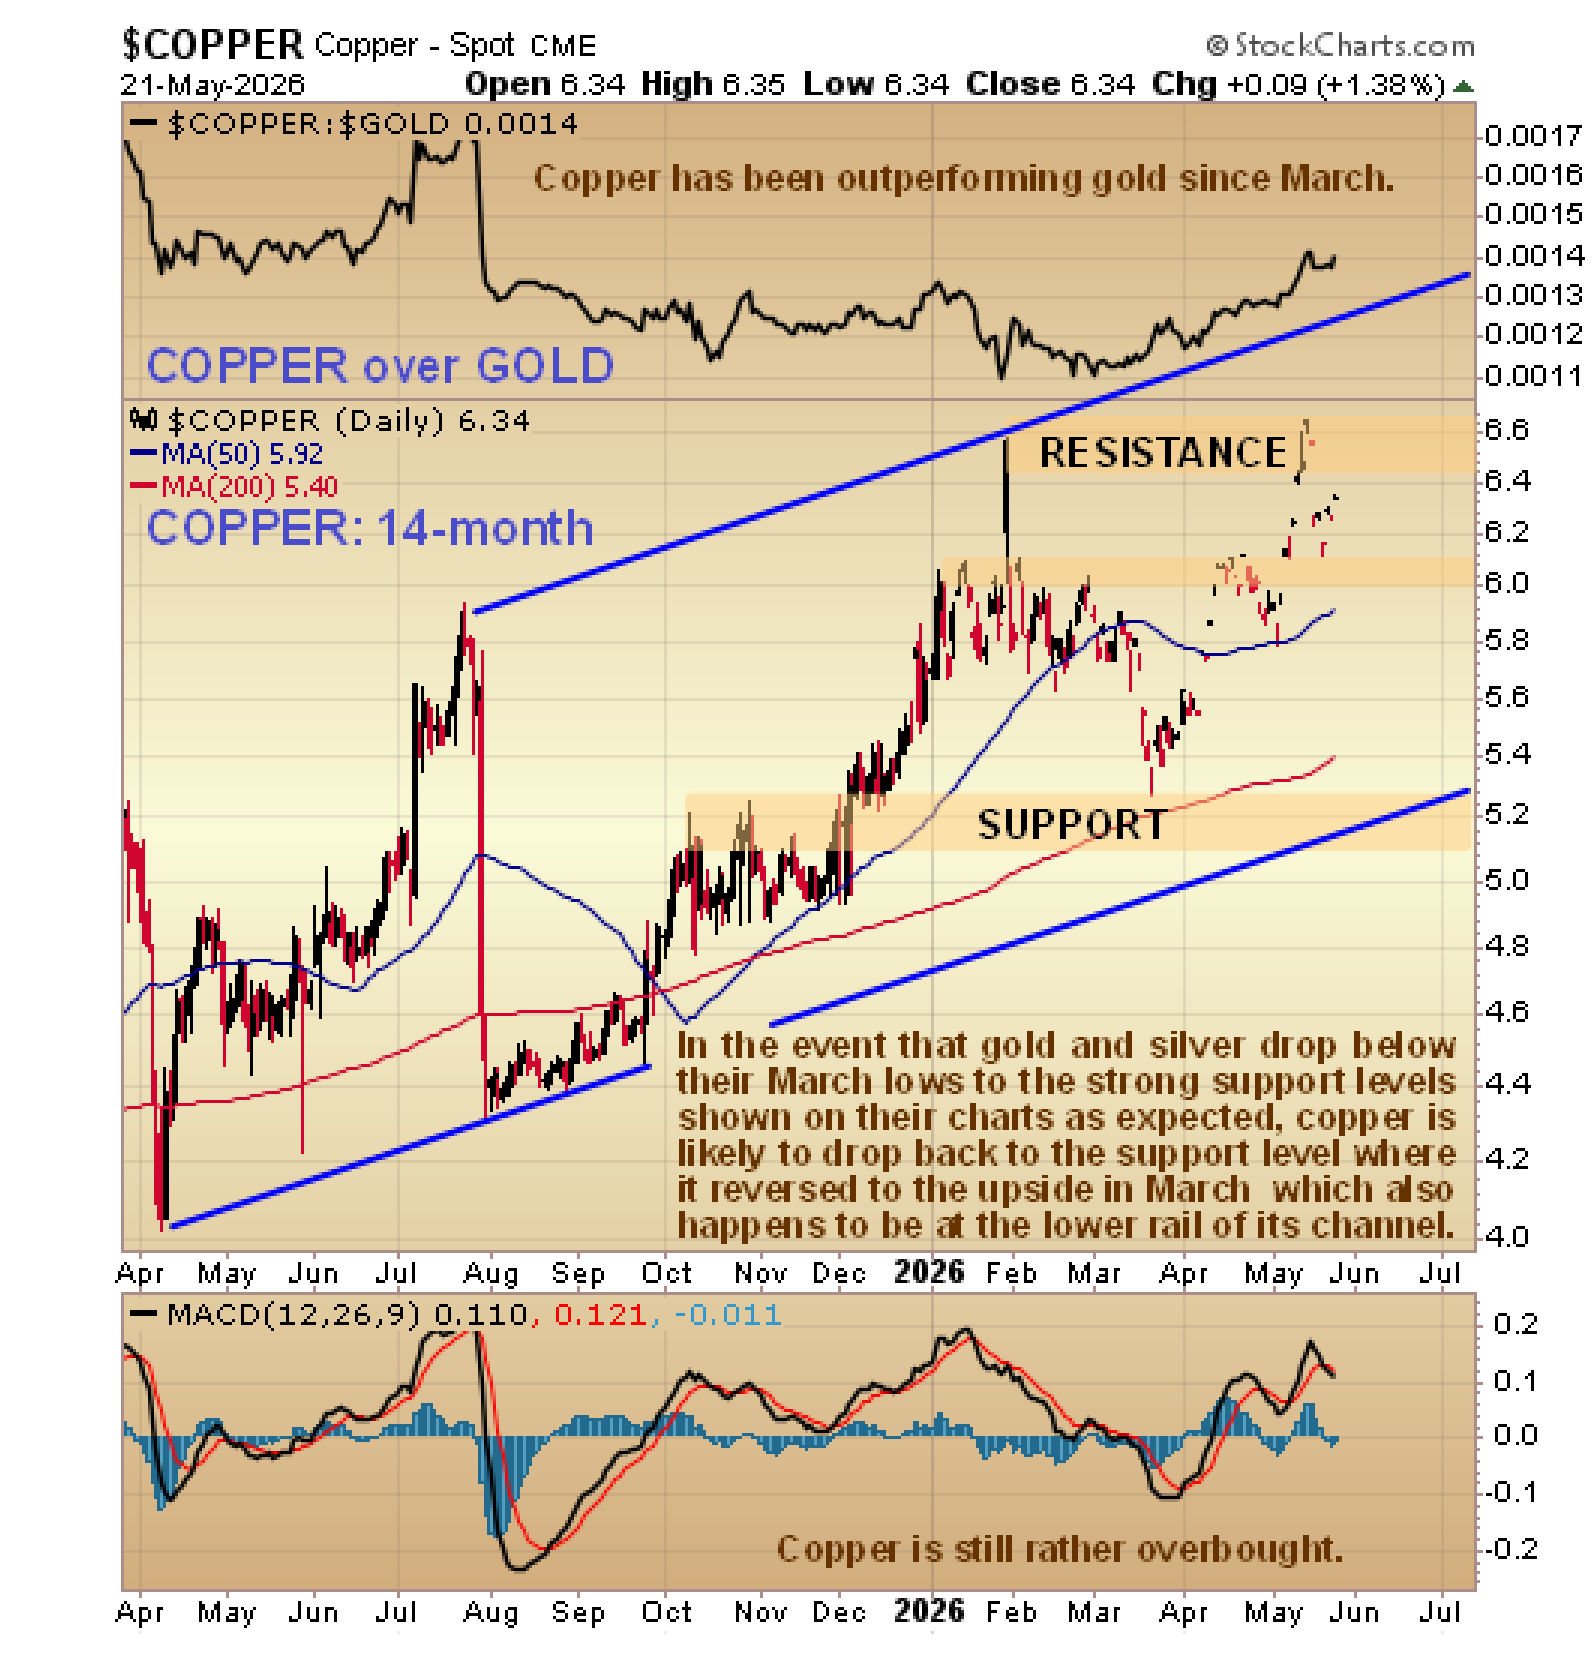
So, what about copper? Copper has performed relatively well over the past several months, outperforming gold significantly since March, as we can see on its 14-month chart below. However, it can of course be expected to suffer collateral damage if gold and silver break below their March lows. In this event it is expected to drop back across its broad uptrend channel to its lower boundary and also close to the zone of support in the $5.20 area where it too will be a strong buy…
End of update.
Posted at 8.20 pm EDT on 24th May 26.