Iran has known for more than 40 years that Israel planned to attack it – Netanyahu made no secret of their intentions - and so it prepared accordingly. When the attack came Israel and the US thought it would be a “pushover” due to their overwhelming military might, even if much of their military hardware dates back 30 years, but Iran responded with asymmetric warfare by blocking the Strait of Hormuz, the World’s oil chokepoint, and by attacking the Gulf client states and the US military bases that they host, as well as Israel itself, in part using sophisticated hypersonic missiles that can’t be stopped. So although Israel and the US were able to inflict heavy damage on Iran as one would expect given the firepower that they brought to bear, they still ended up being given a “bloody nose” with cities in Israel such as Haifa and Tel Aviv being hit hard and many US bases across the region being damaged or destroyed. This quickly brought the Gulf client states to the realization that the US couldn’t protect them as they had supposed resulting in them putting pressure on Washington and in addition Israel needed a break from being pounded by missiles. With the blockage of the Strait of Hormuz threatening severe shortages of gasoline, helium and fertilisers and much higher prices across the world which could clearly affect Trump’s chances of doing well in the mid-term elections in the Fall, the aggressor was reluctantly forced to the negotiating table. While neither of the 2 main political parties in the US care at all about the fortunes or welfare of the electorate – they are 2 sides of the same coin – Trump does care about his re-election chances and his legacy. Hence the current negotiations or at least, talks about talks. However, while a compromise Deal may suit the US, it definitely does not suit Israel, whose objectives can be simply stated as the destruction of Iran and domination of the entire Mid-East. It is therefore logical to expect it try to sabotage the Deal at some stage, which it might achieve simply be continuing to destroy Lebanon. This is why this peace Deal looks doomed, and if it is, it clearly has major implications for the oil price which is why we are following this line of reasoning to its conclusion. Put simply, if the peace deal with Iran is scuppered, then hostilities will resume and the oil price will soar, especially if Iran takes out the Gulf States’ desalination plants, rendering them uninhabitable.
In the other scenario where the peace Deal holds, what can we then expect for the oil price? Here our start point is to reflect on the fact that after the big drop in oil prices over the past month or so, they are almost back to where they were in February before the attack on Iran! This does not make any sense at all and is due to a combination of naive and misplaced optimism over the Deal, precipitous drawdown of oil reserves that are now arriving at “tank bottom”, possibly coupled with aggressive manipulation to suppress the oil price partly to avoid angering the American consumer. Now take a look at the following chart from dialogworks.com showing how much oil is being shipped through the Strait of Hormuz…
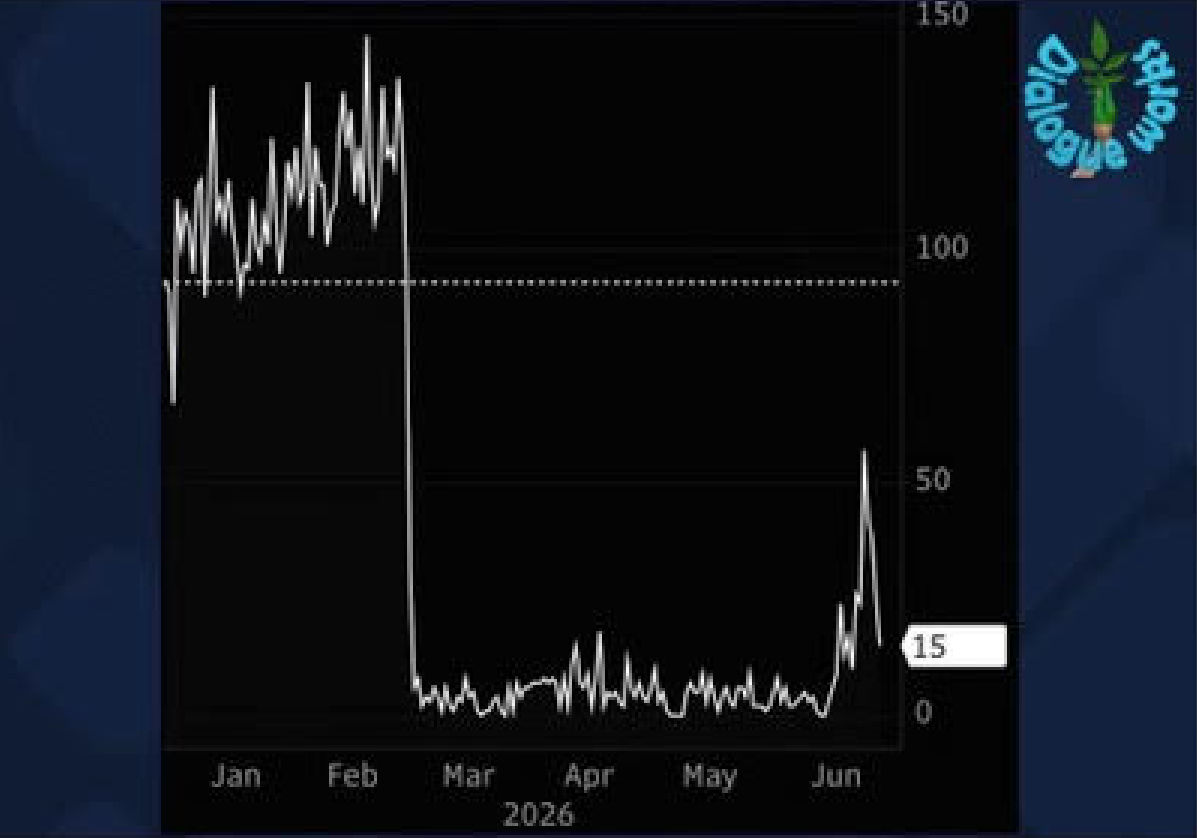
Shipments dropped off a cliff early in March following the attack on Iran and tried to recover briefly not long ago on false optimism about the Deal before dipping back again. The point is that, even if the Strait was fully opened tomorrow, it takes weeks to months for the increased supply to work through the system, and as reserves have already been fully depleted or very near to, this means one of two things over the short to medium-term, either rationing or considerably higher prices or both, a fate that cannot now be avoided. This means that oil prices are now silly cheap and set to rebound, Deal or no Deal, over the short to medium-term, regardless of later declines due to demand destruction, or anticipated demand destruction, as a result of impending recession / depression as in 2008. So now let’s see what the oil charts have to say.
We are going to look at the charts for Brent Crude and the United State Oil Fund, leaving out the charts for West Texas Light Crude on this occasion to save time, because they are almost identical to the charts for Brent, apart from a clear Double Bottom being visible this year on the Brent chart while a more messy top pattern formed in Light Crude.
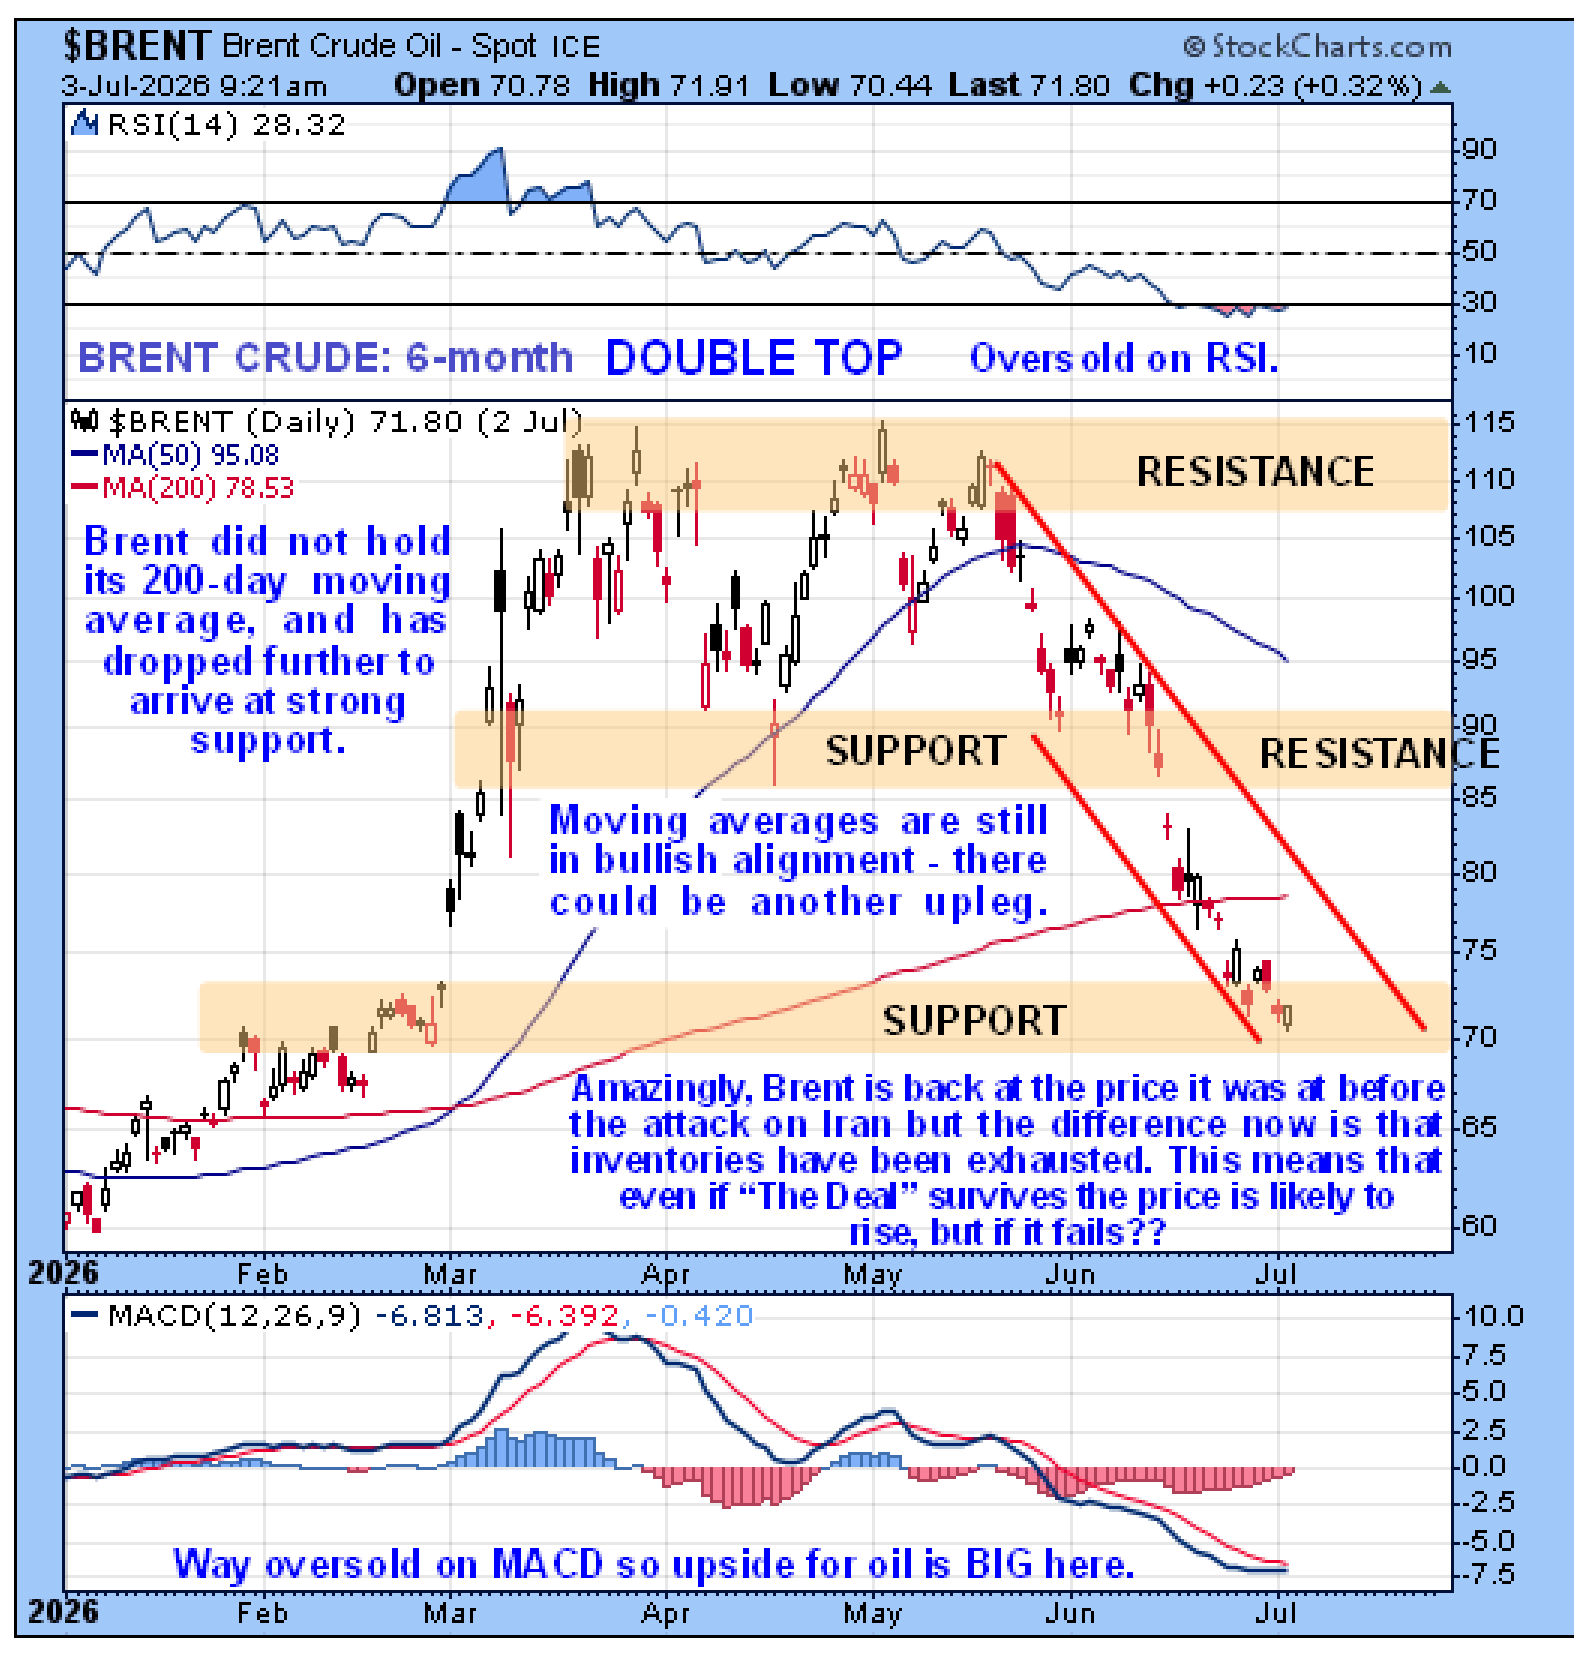
On the 6-month Brent Crude chart we can see that, after an explosive rally during the first half of March, a Double Top formed from mid-March through May above a band of support ranging from about $86 - $90 that it broke down from in the middle of June on optimism about the peace Deal. This breakdown led to a quite severe downtrend that has brought the price all the way down to strong support in the price zone that existed back in February before the attack on Iran which is truly remarkable in the circumstances. It is also now some way below its still rising 200-day moving average – we had earlier thought that the decline would halt in the vicinity of this average but it didn’t and the further decline back to support above the February trading is viewed as making it even more of a buy here, fundamentally for the reasons set out above. It is quite oversold here on its MACD and RSI indicators now which is another reason for it to reverse to the upside soon.
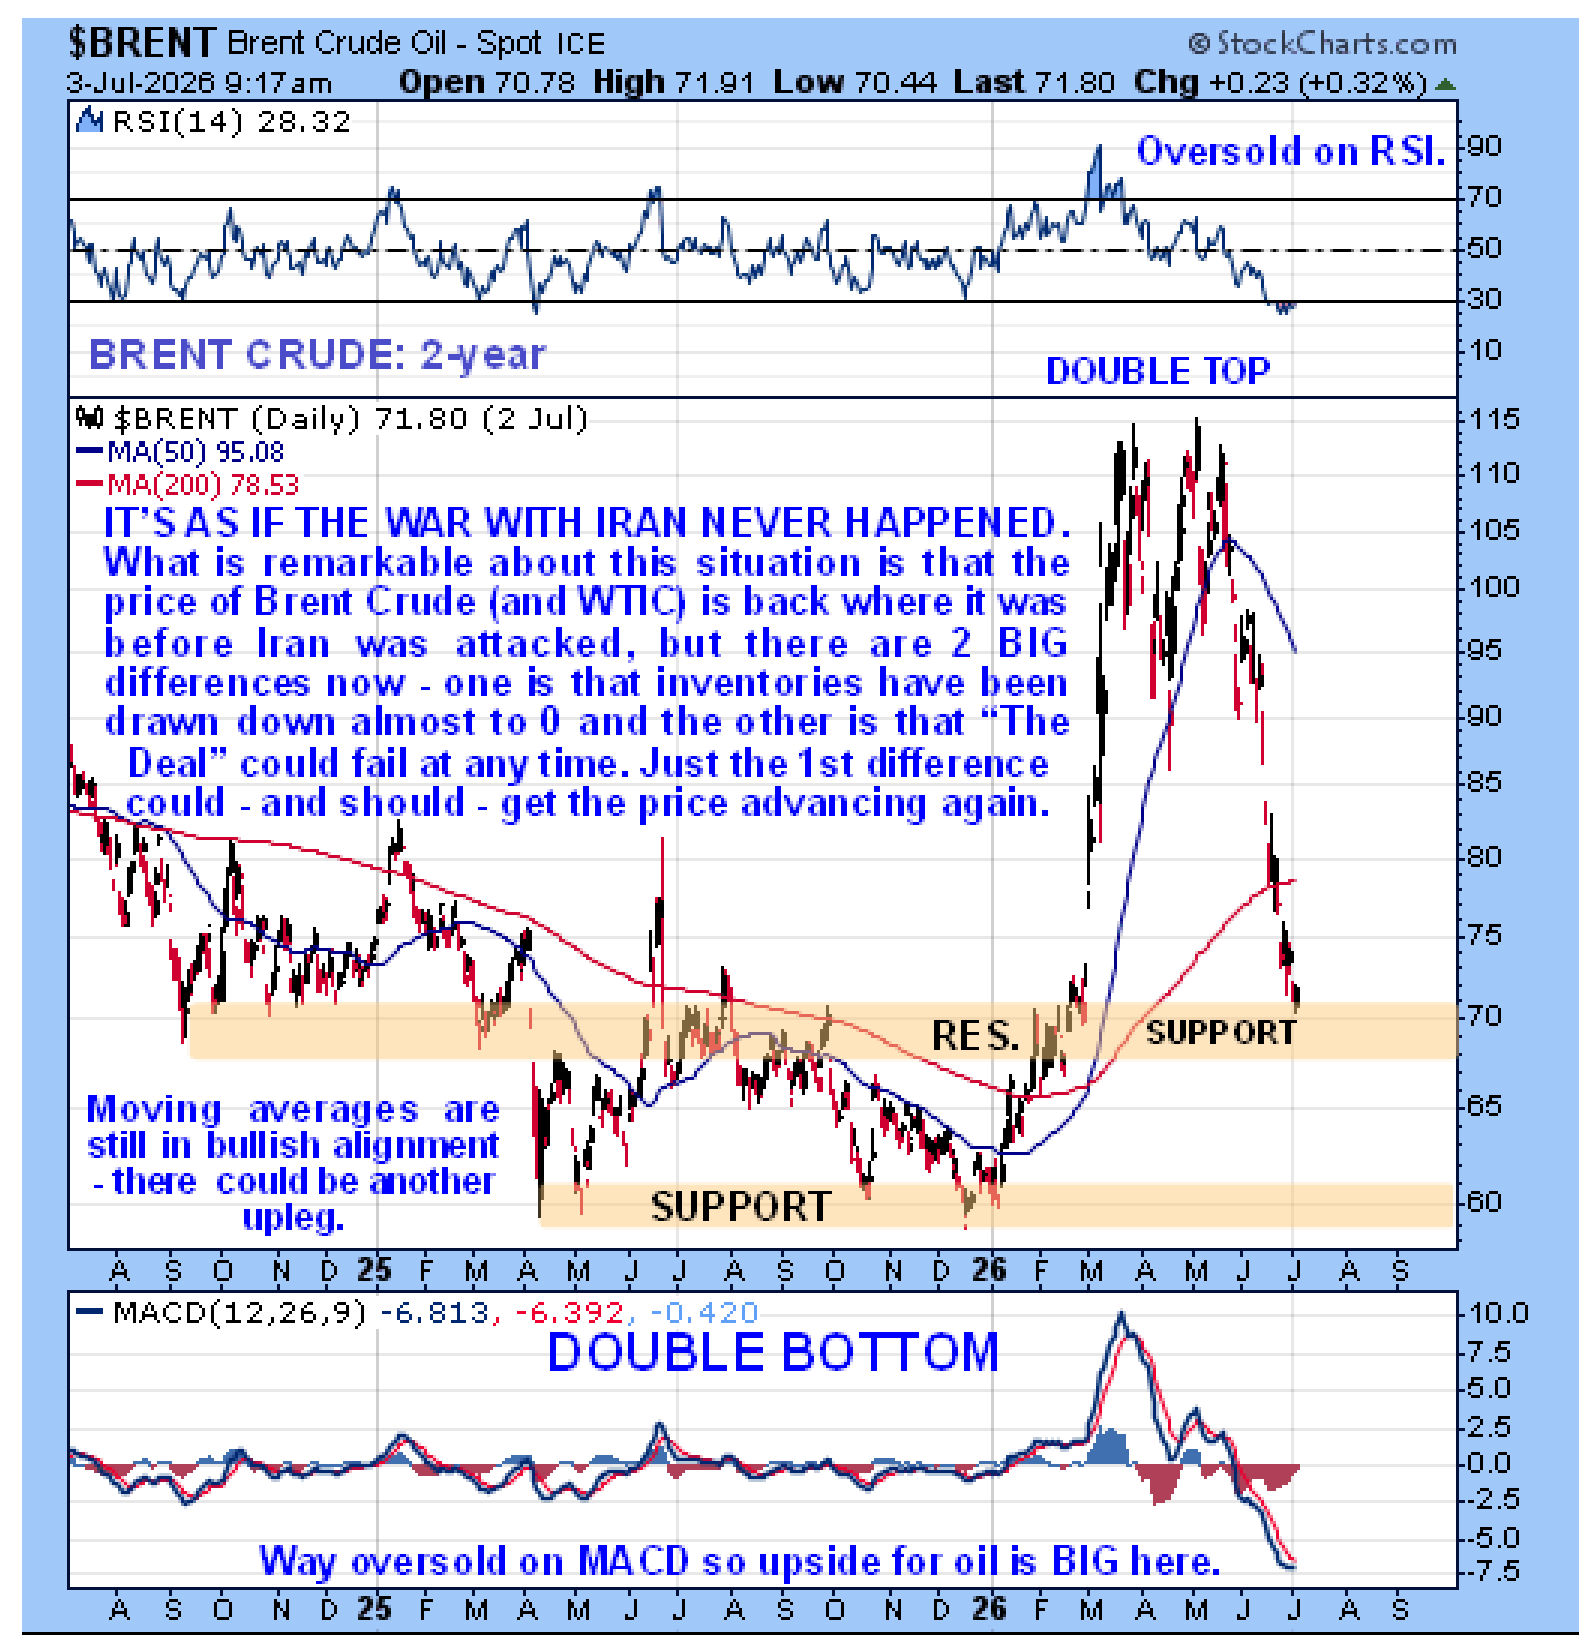
The 2-year chart for Brent Crude is illuminating as it shows us that the dramatic advance in March followed the breakout from a fine, large completed Double Bottom pattern. We can also see that it has come rattling all the way down to the strong support close to the breakout point, arriving there in a heavily oversold state, obviously a very good point for it to start higher again, and as we saw above, there is no shortage of fundamental reasons for it to do so.
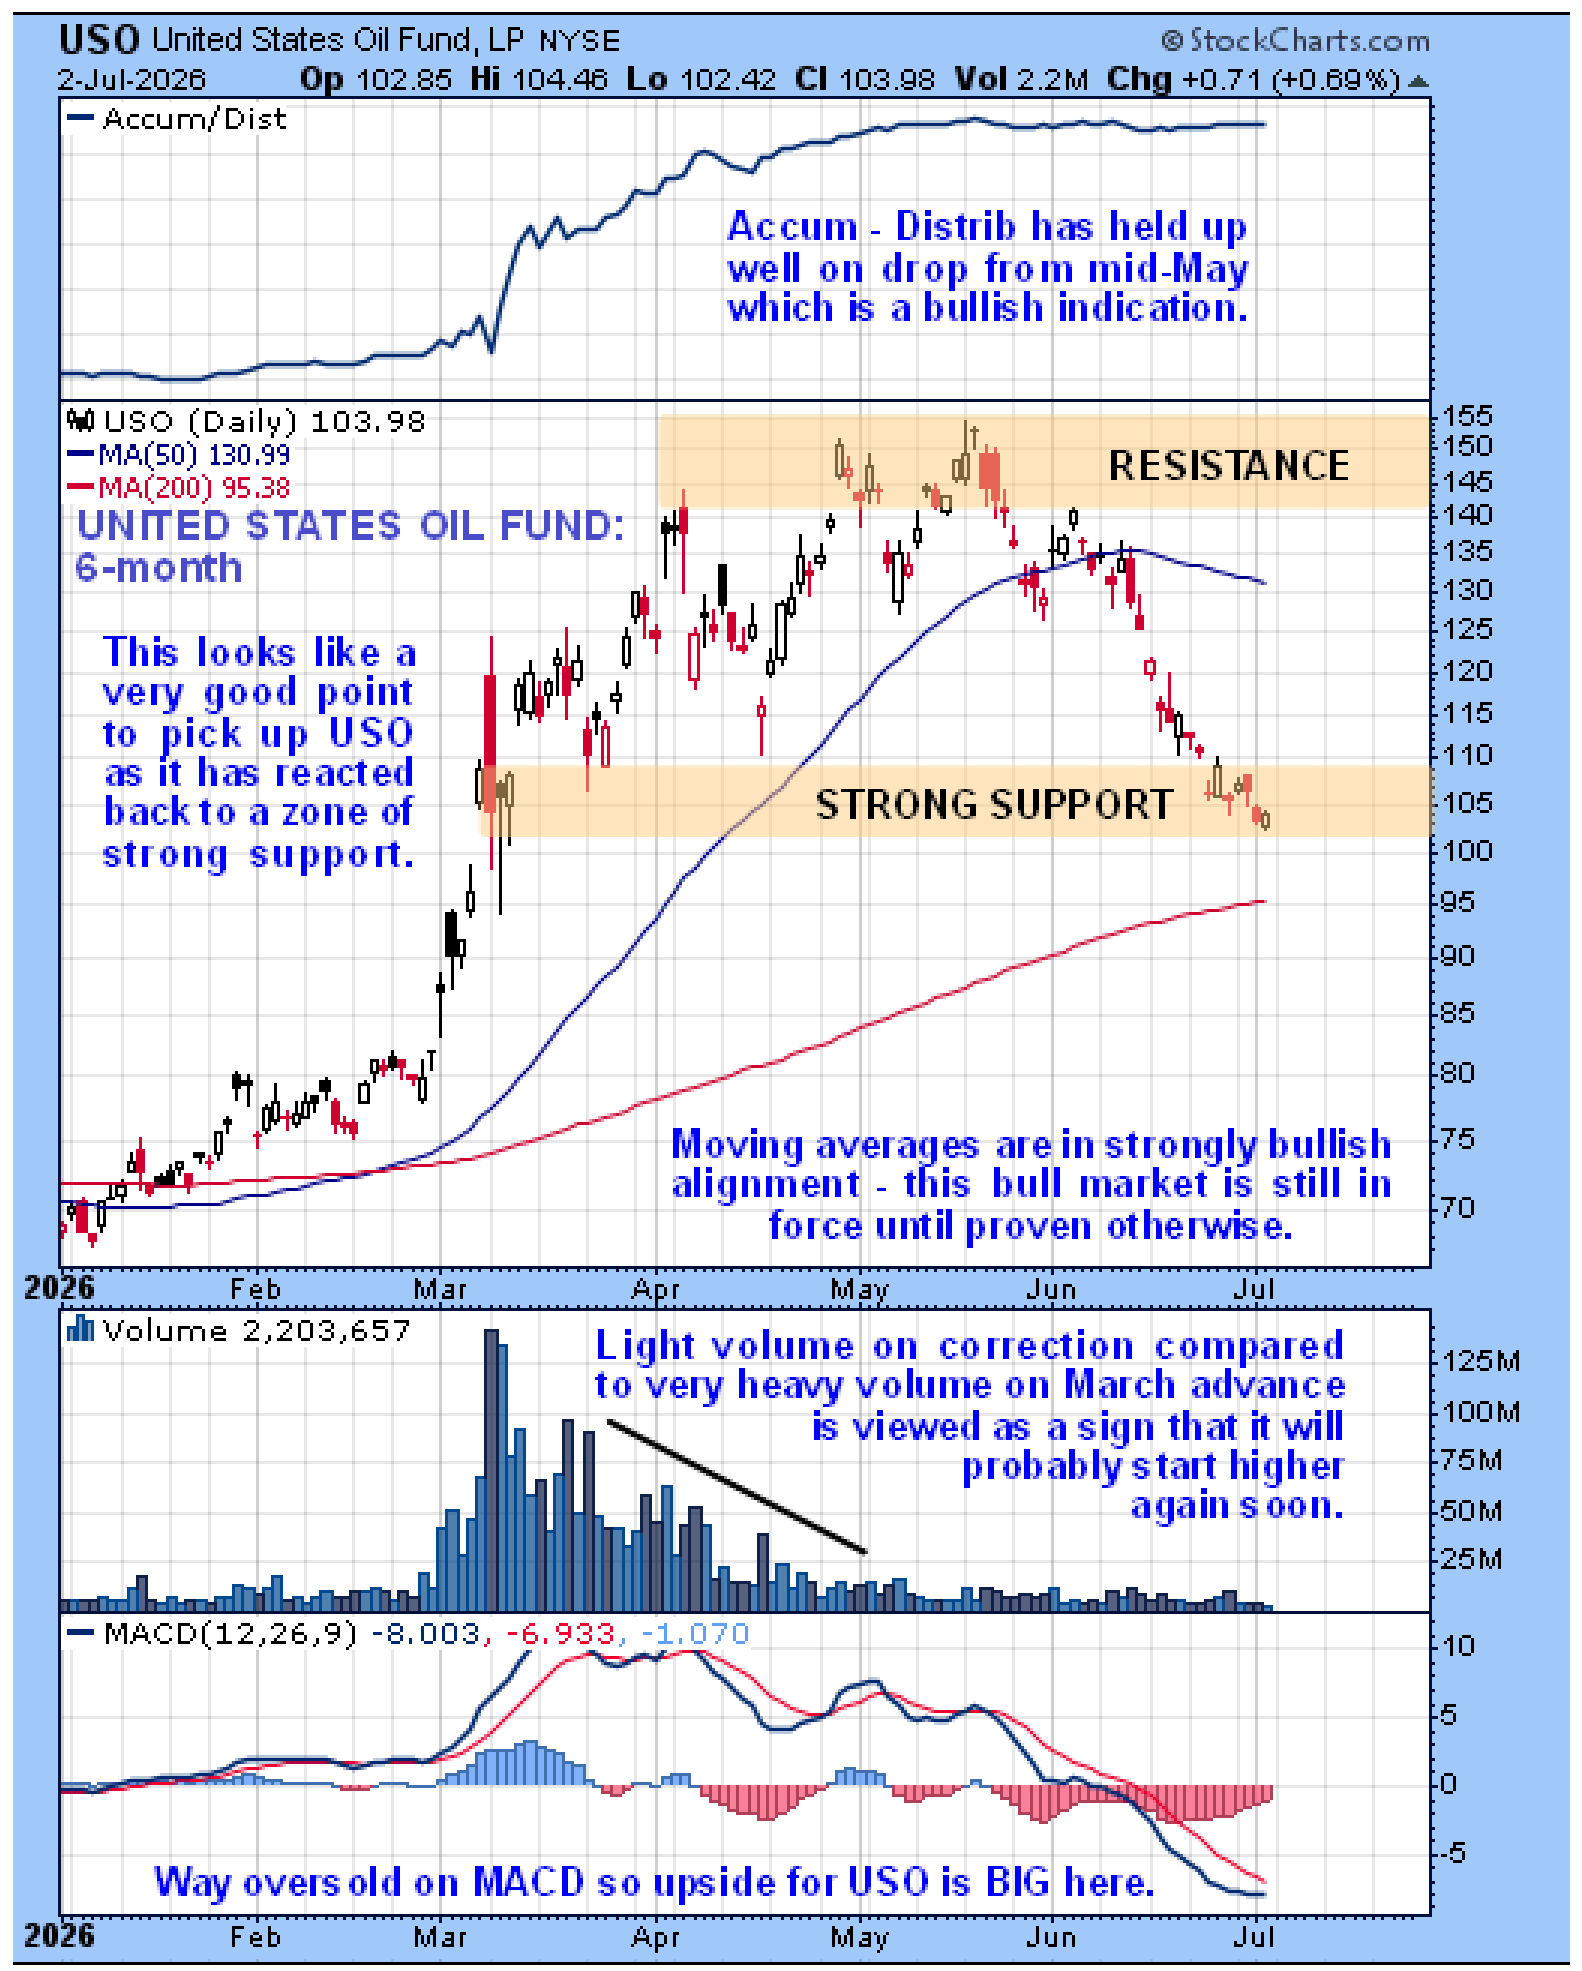
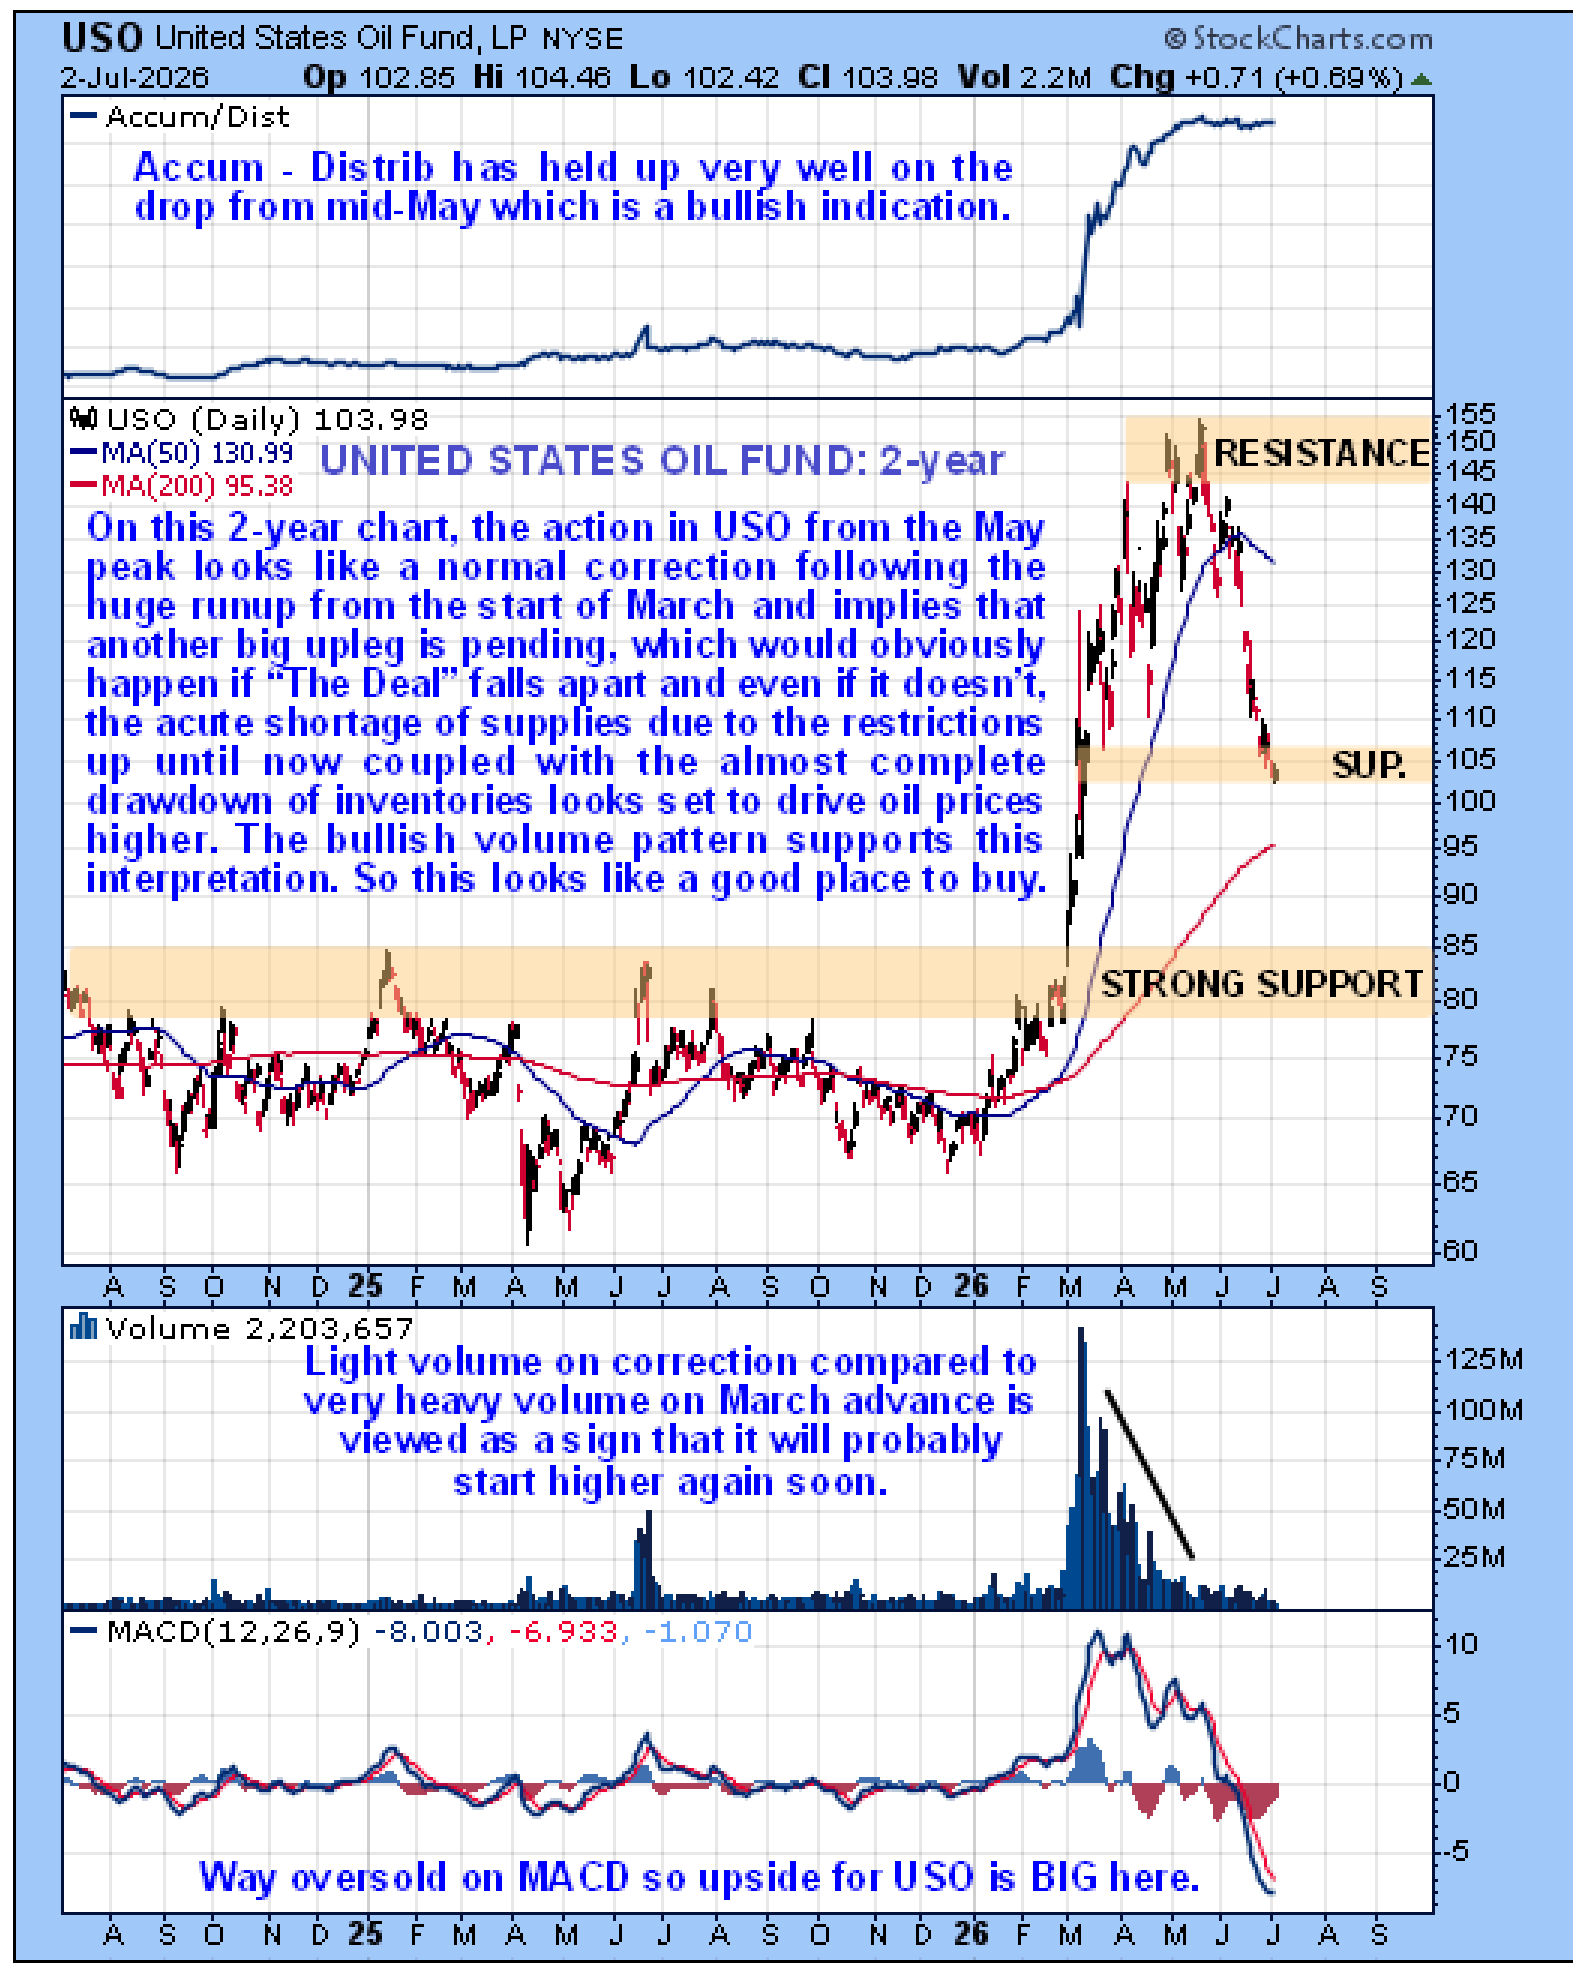
Now we will consider the outlook for the United States Oil Fund (USO) where interestingly we see that, unlike oil itself, it has not breached the support at the underside of the large pattern that has formed from early – mid March. Even if it does so it will not matter much as there is more strong underlying support near to the rising 200-day moving average. A big reason for us looking at the charts for USO, in addition to the oil charts, is that they show trading volume. Notice how, in marked contrast to when it exploded higher on huge volume in March, it has been drifting lower on comparatively very light volume which is why even now, after a substantial decline from the May highs, its Accumulation line is flirting with new highs. This is viewed as very bullish price / volume action which implies that this drop is simply a correction within an ongoing powerful bull market, a correction that will be followed by another big upleg to new highs, which furthermore may imply that the peace Deal is doomed and that hostilities will resume.
On the 2-year chart for the United States Oil Fund we can see that the big runup this Spring looks like the 1st high-volume impulse wave of a major bull market following the breakout from a large base pattern, with the low-volume retreat from the May high looking like a normal proportionate correction that will be followed by renewed advance in the form of another major upleg to new highs.
This therefore looks like a very good time to buy oil and oil related investments, such as oil futures, for those who are experienced in this area.
End of update.
Posted at 1.15 pm EDT on 3rd July 26.