Whilst we aren’t especially interested in cryptos, many of them look like they are about to start higher from cyclical lows after severe downtrends from the middle of last year appear to have run their course. This is the case with the “Big Daddy” of cryptos that we looked at a few days back, Bitcoin, and also many larger cryptos. Therefore, in the interests of “diversity”, not in the sense of our politics or social lives, but with respect to our portfolios, it is considered worth looking at some of them.
One of these cryptos that has a particularly promising pattern that is believed to be about complete is Ethereum.
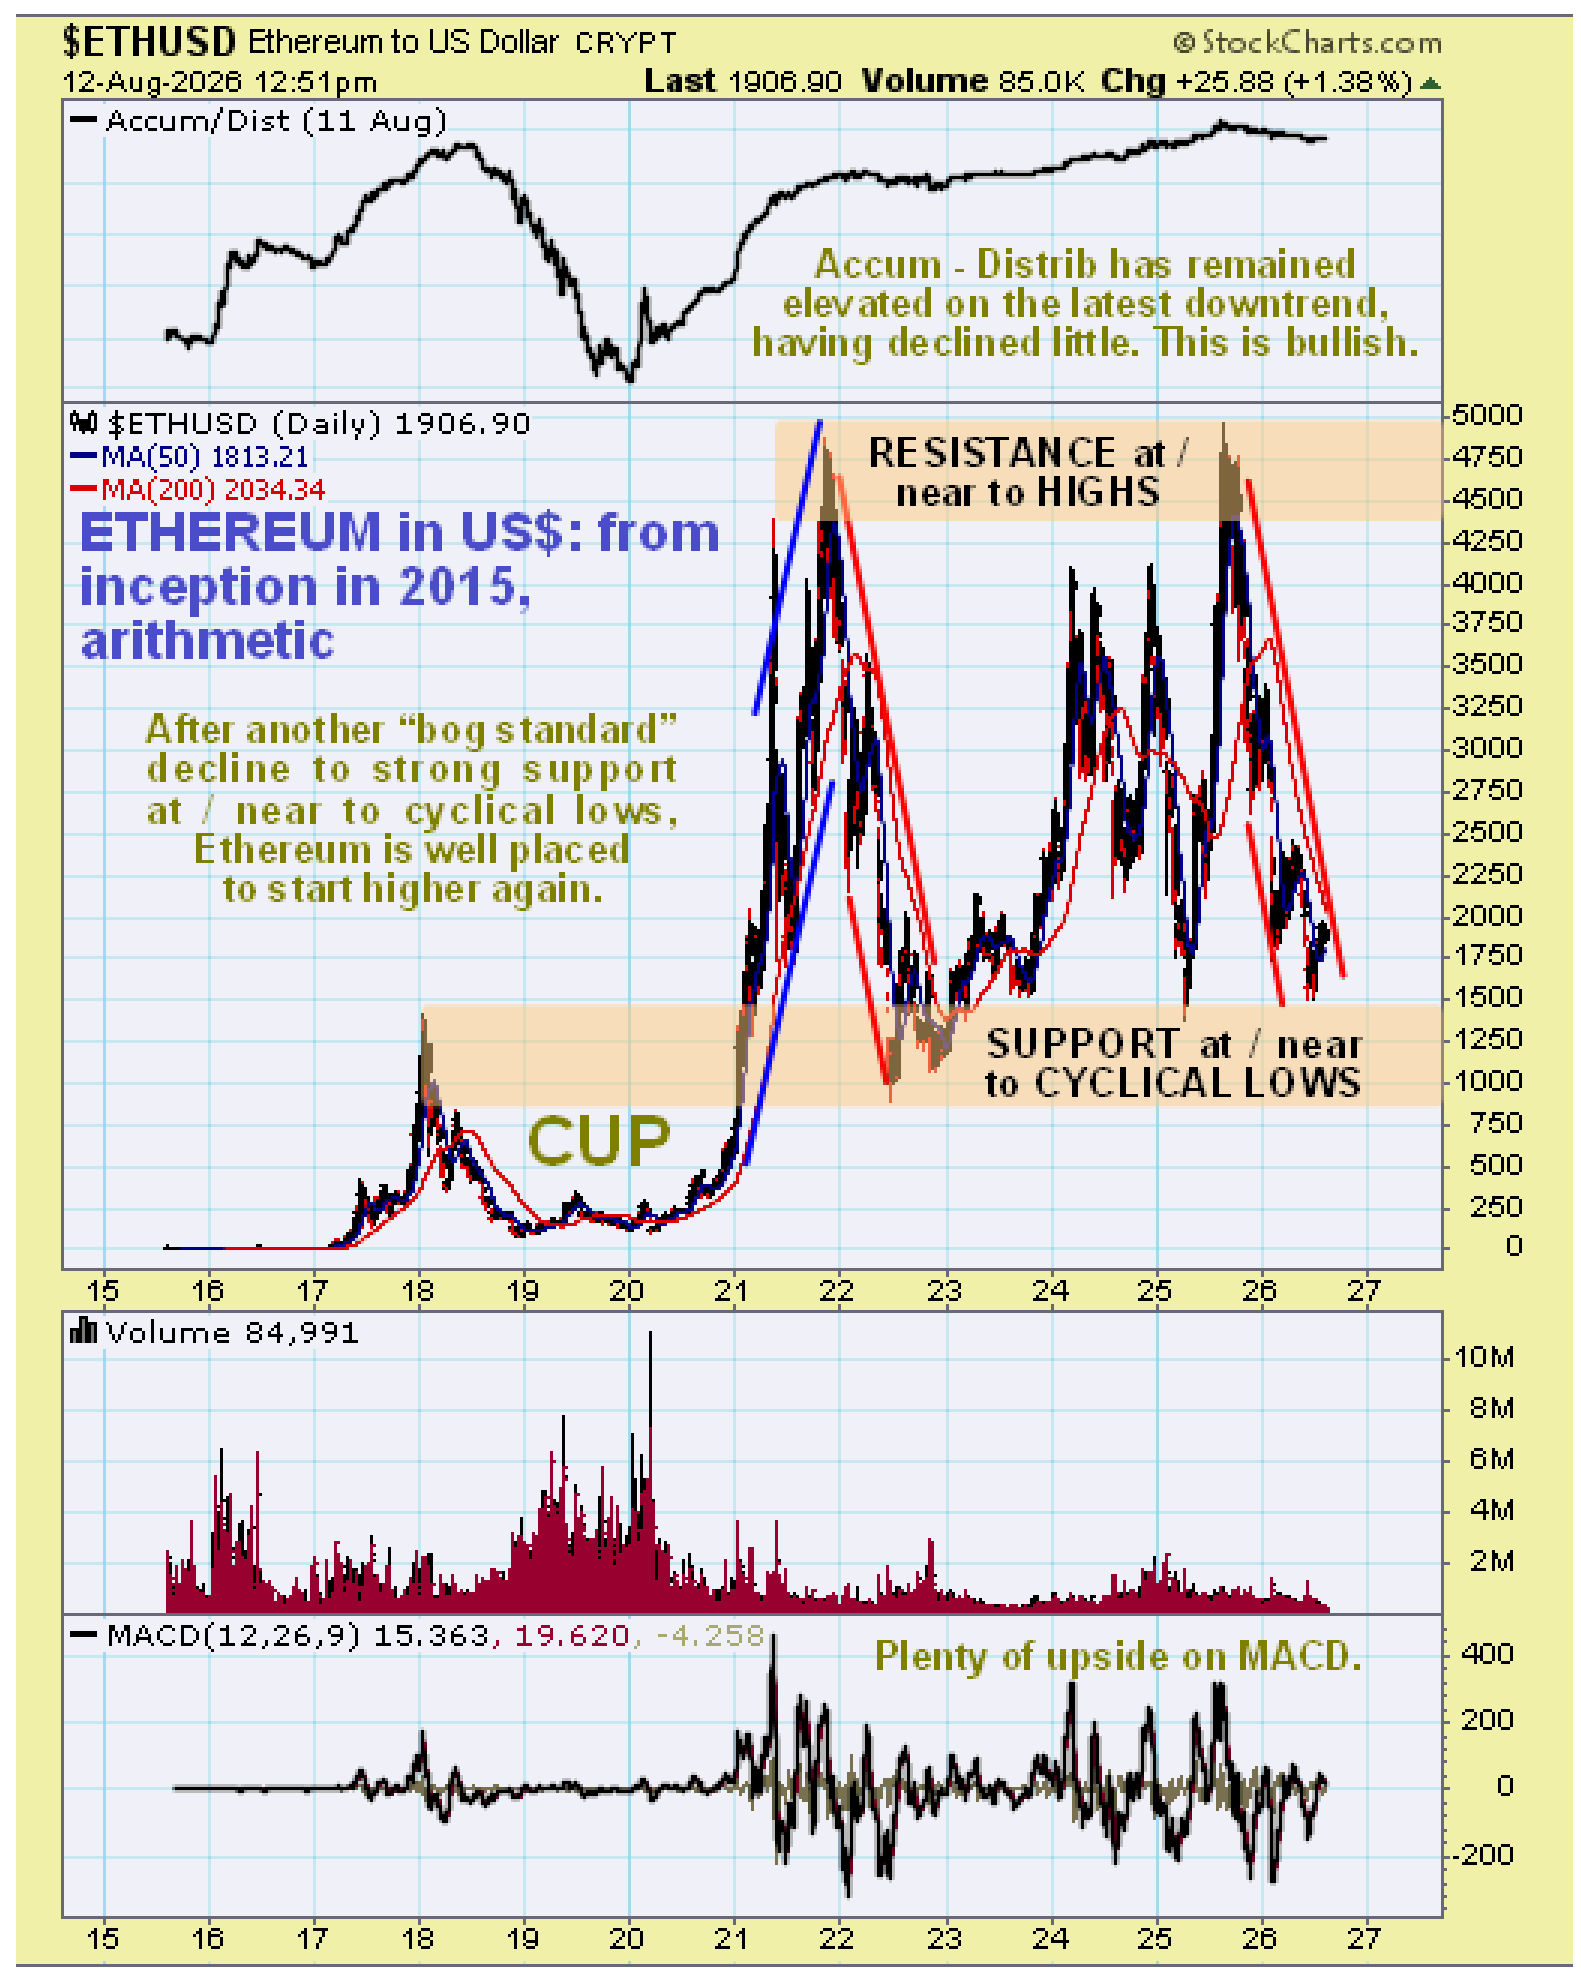
On Ethereum’s long-term chart we can see that it has dropped back hard over the past year or so to strong support approaching and at long-term cyclical lows, a good point for it turn up…
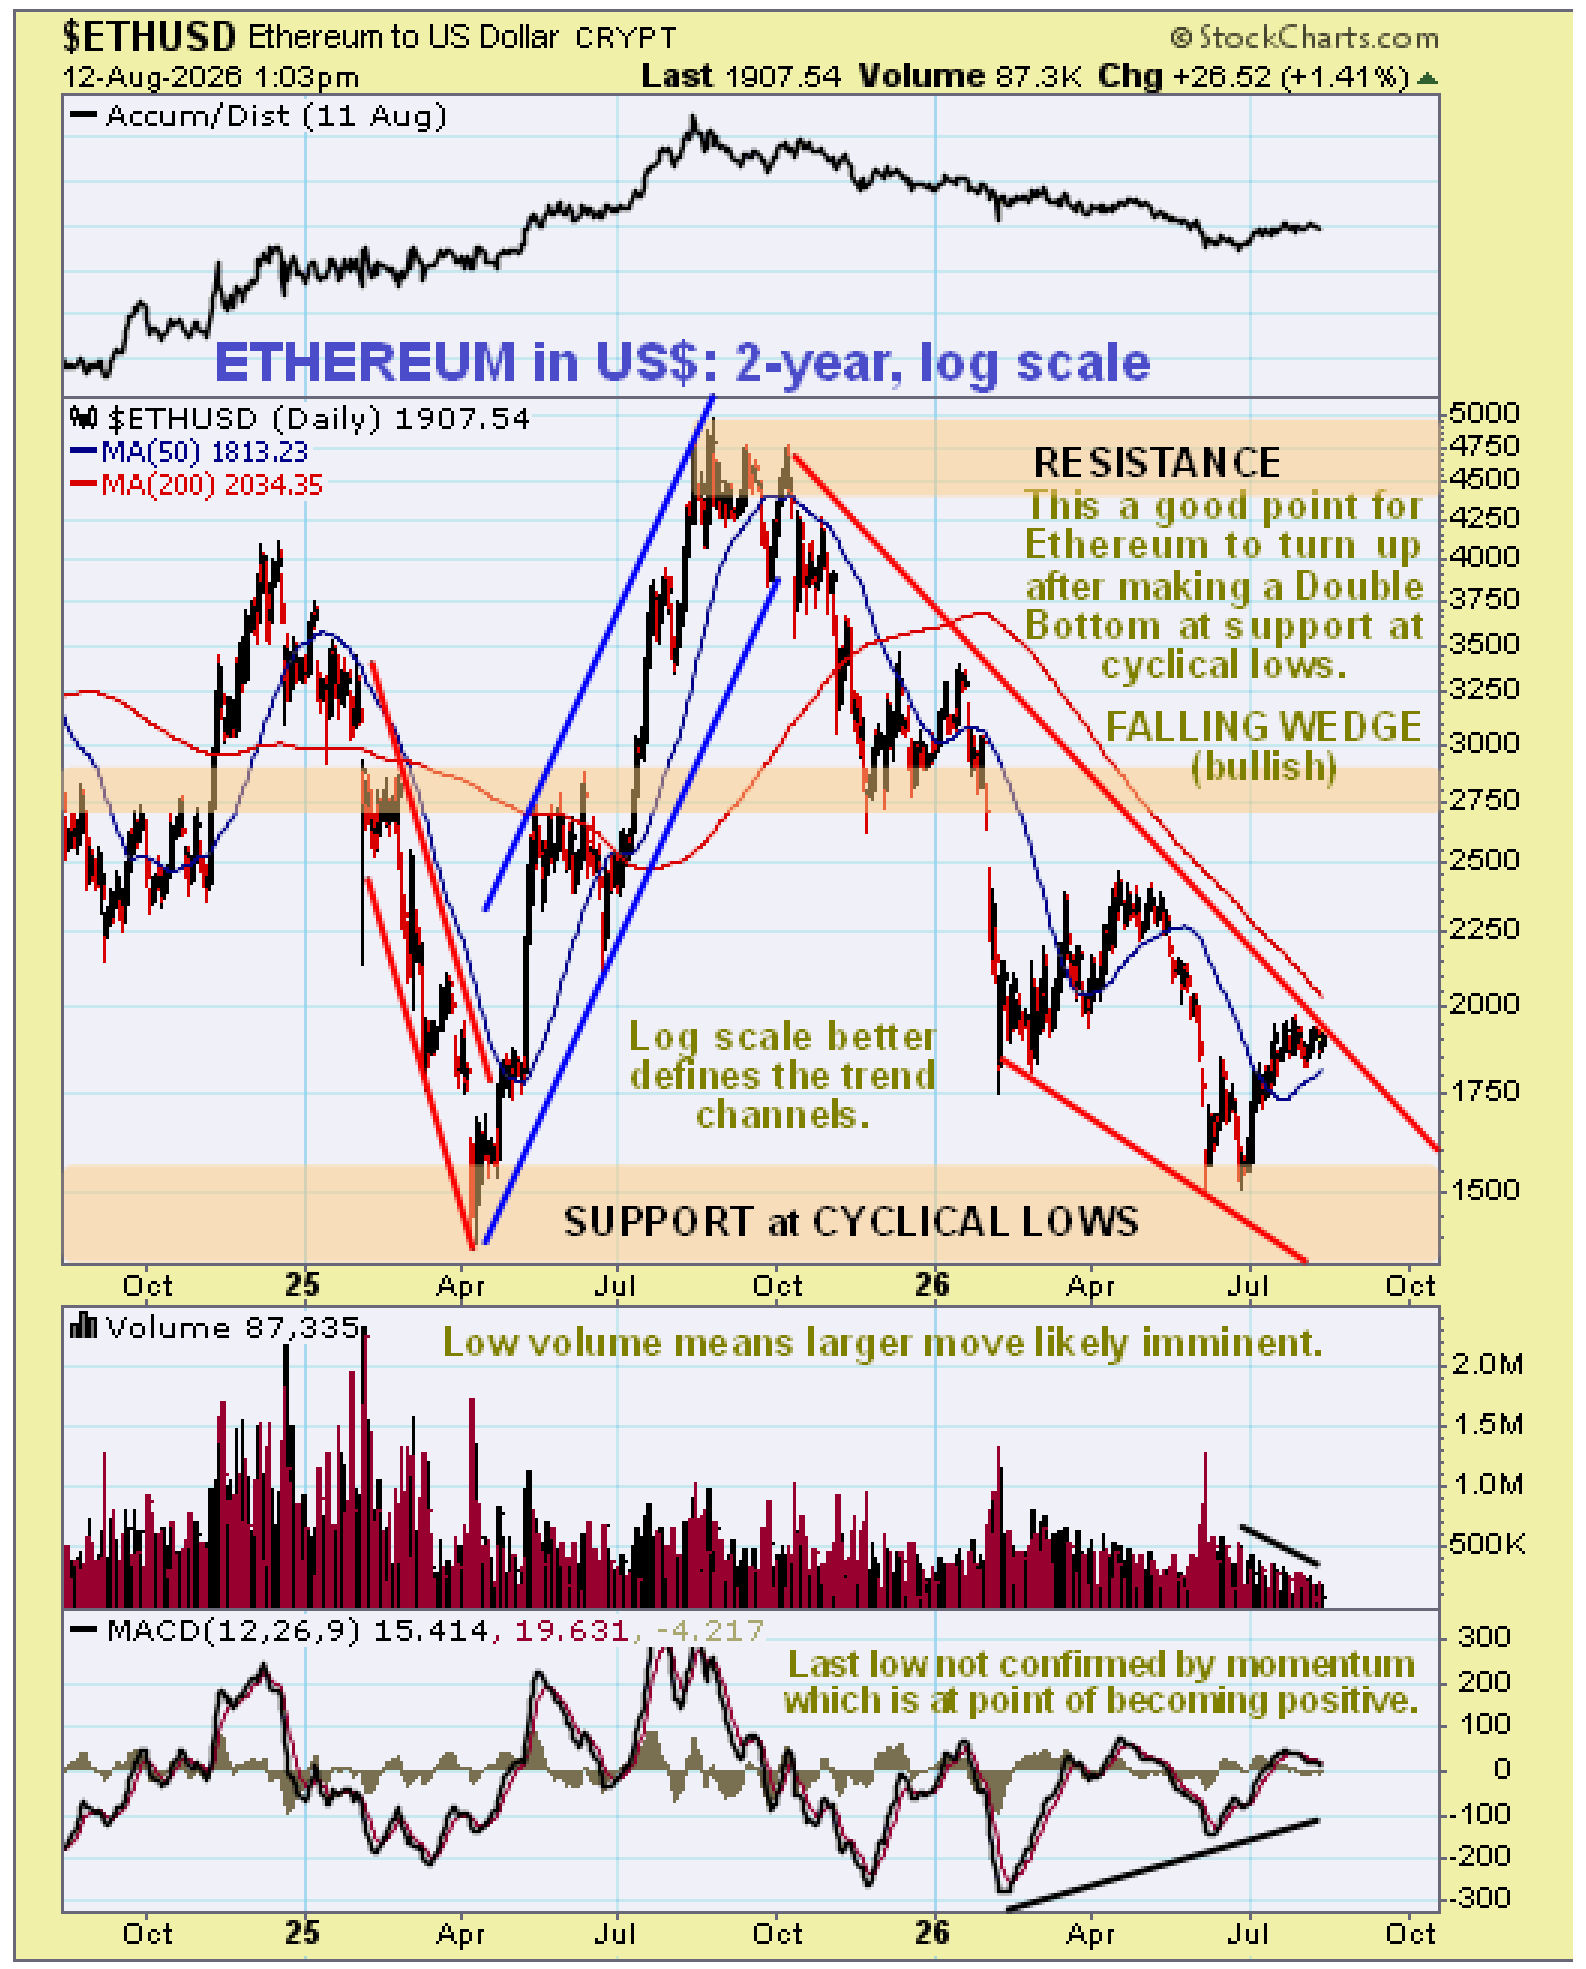
Zooming in, we can see that its 2-year log chart defines its recent intermediate trends and we can also see that the latest one from the middle of last year is looking “long in the tooth” with its rate of decline slowing as shown by the uptrending MACD indicator as it nudges the upper boundary of a bullish Falling Wedge which increases the likelihood that it is in the process of reversing to the upside…
The 3-month chart is most useful for on it we can see that Ethereum is completing a strongly bullish albeit smallish Cup & Handle base with the price having stabilised above a now rising 50-day moving average that is driving it towards a breakout above the resistance at the top of the pattern and then the 200-day moving average not far above as the Handle completes. With the price and its moving averages steadily converging, the probability of an upside breakout is rising fast.
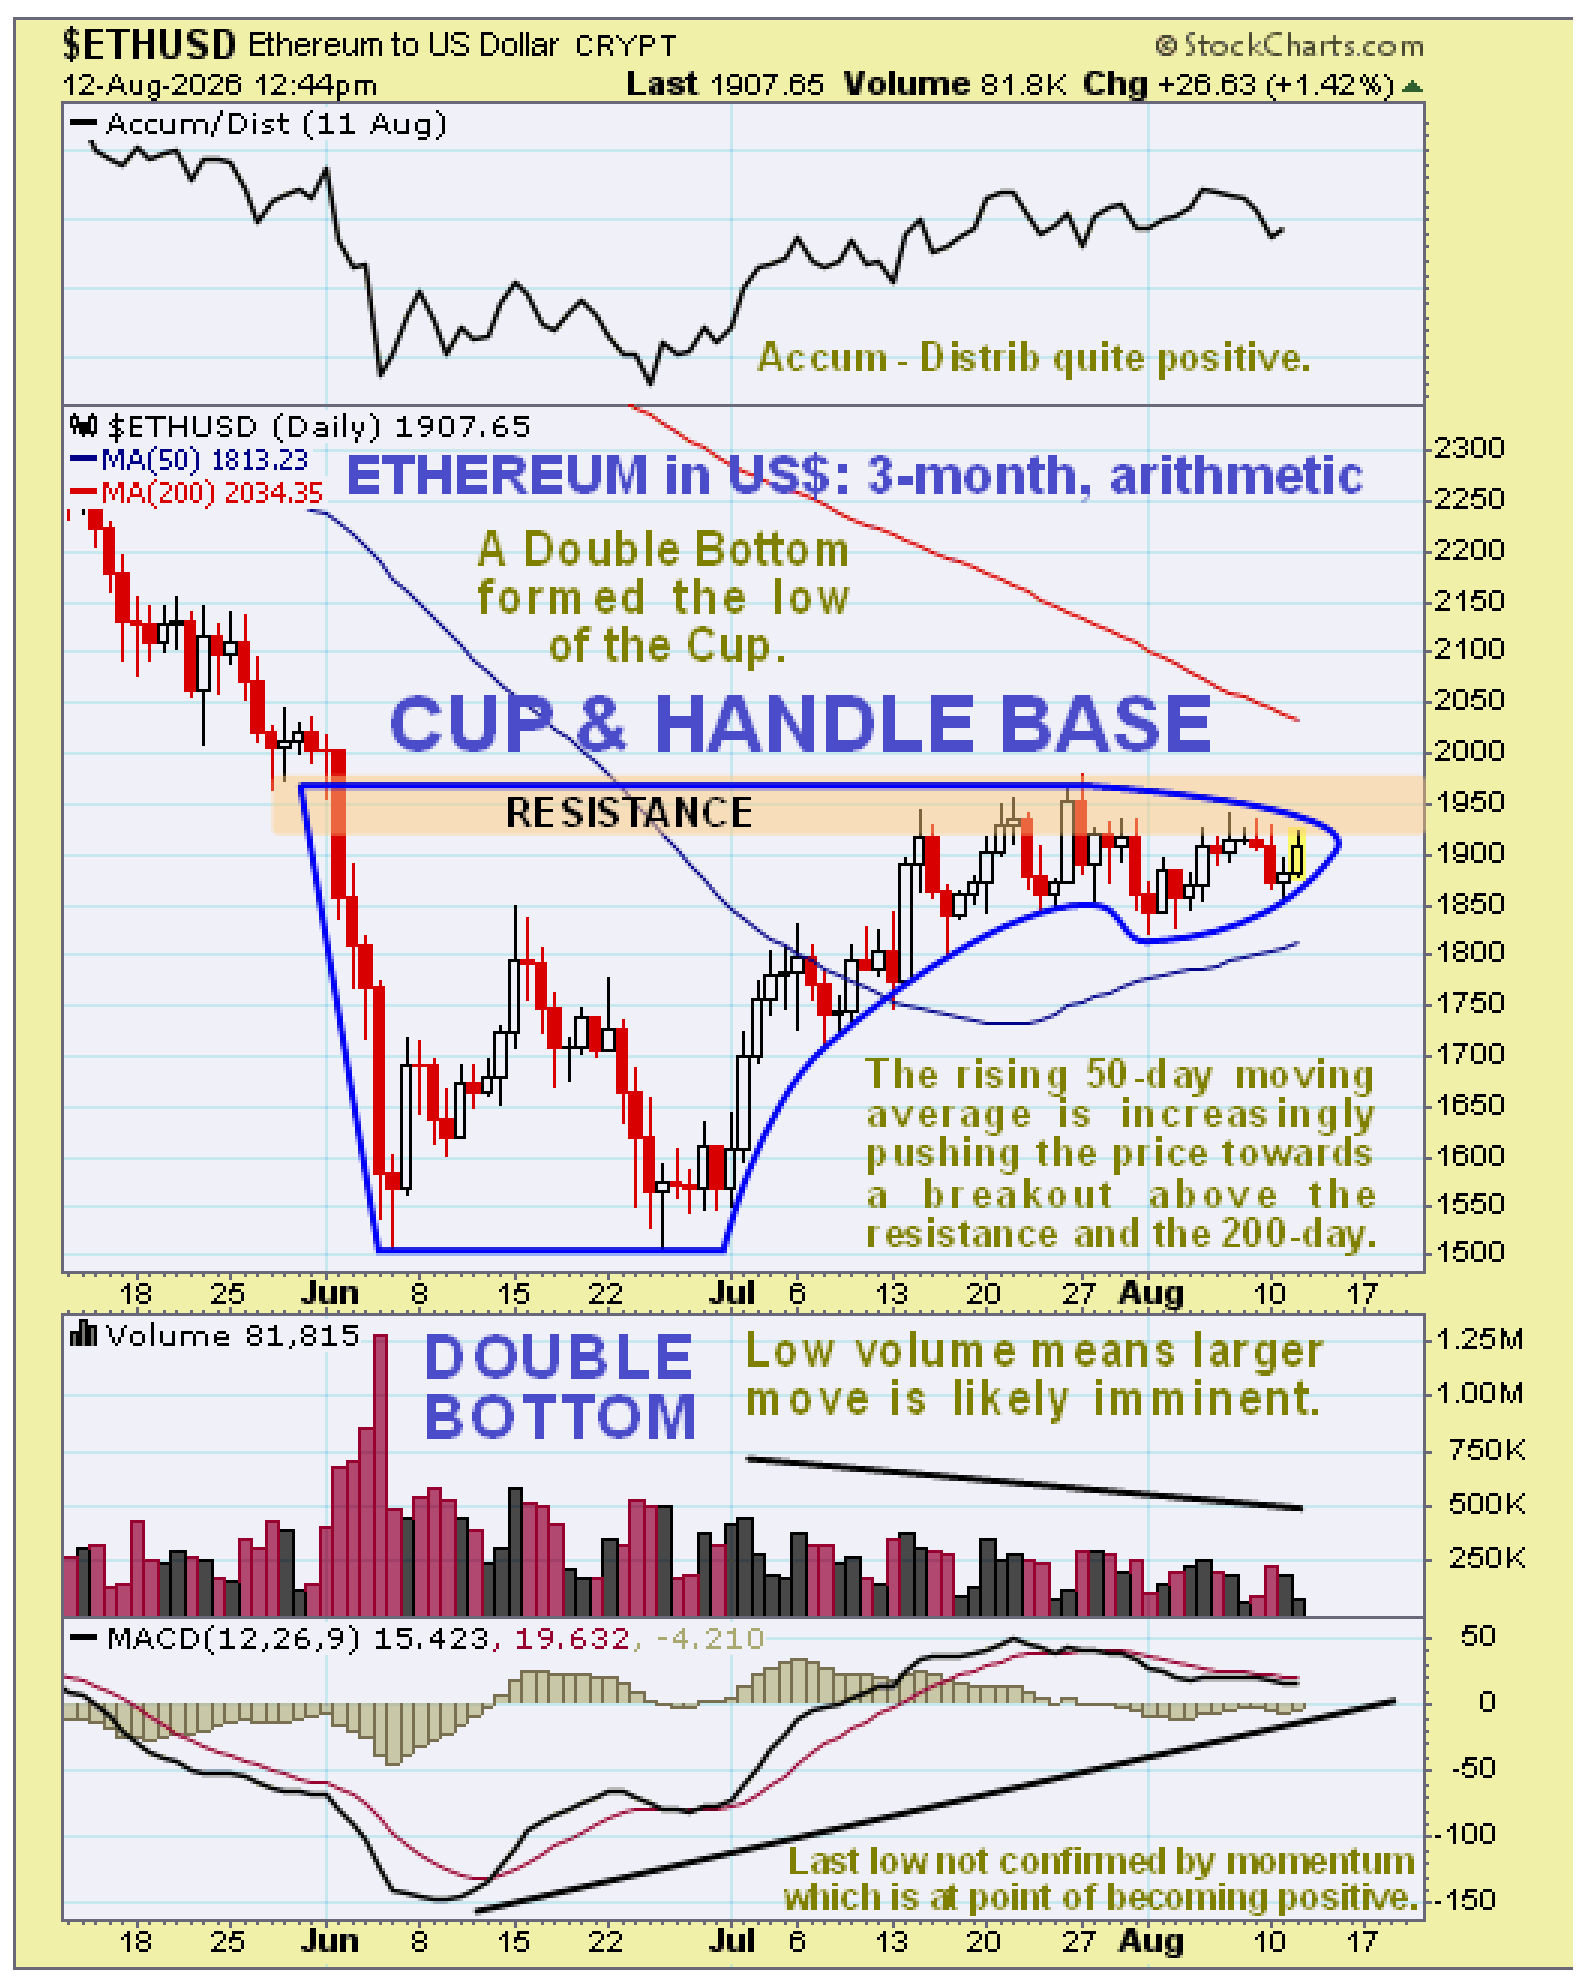
Ethereum is therefore rated an immediate strong buy. The point for a stop in case this promising pattern aborts would be below the 50-day moving average, say at just below $1800.
Ethereum crypto website
Ethereum crypto, ETH, trading at $1893.68 at 11.35 am EDT on 12th August 26.
Posted at 11.45 am EDT on 12th August 26.