We are going into the Fed meeting and statement today with some securities or commodities very extended on a short-term basis. This commonly leads to them flipping in the other direction if for no other reason that they are extremely overbought or oversold on a short-term basis. So we have oil very overbought (and for good reason) and Treasuries very oversold, which means that interest rates are very overbought. We can see this on the 6-month chart for the 10-year US Treasury Yield for last night when it closed with a bearish “gravestone doji” candle…
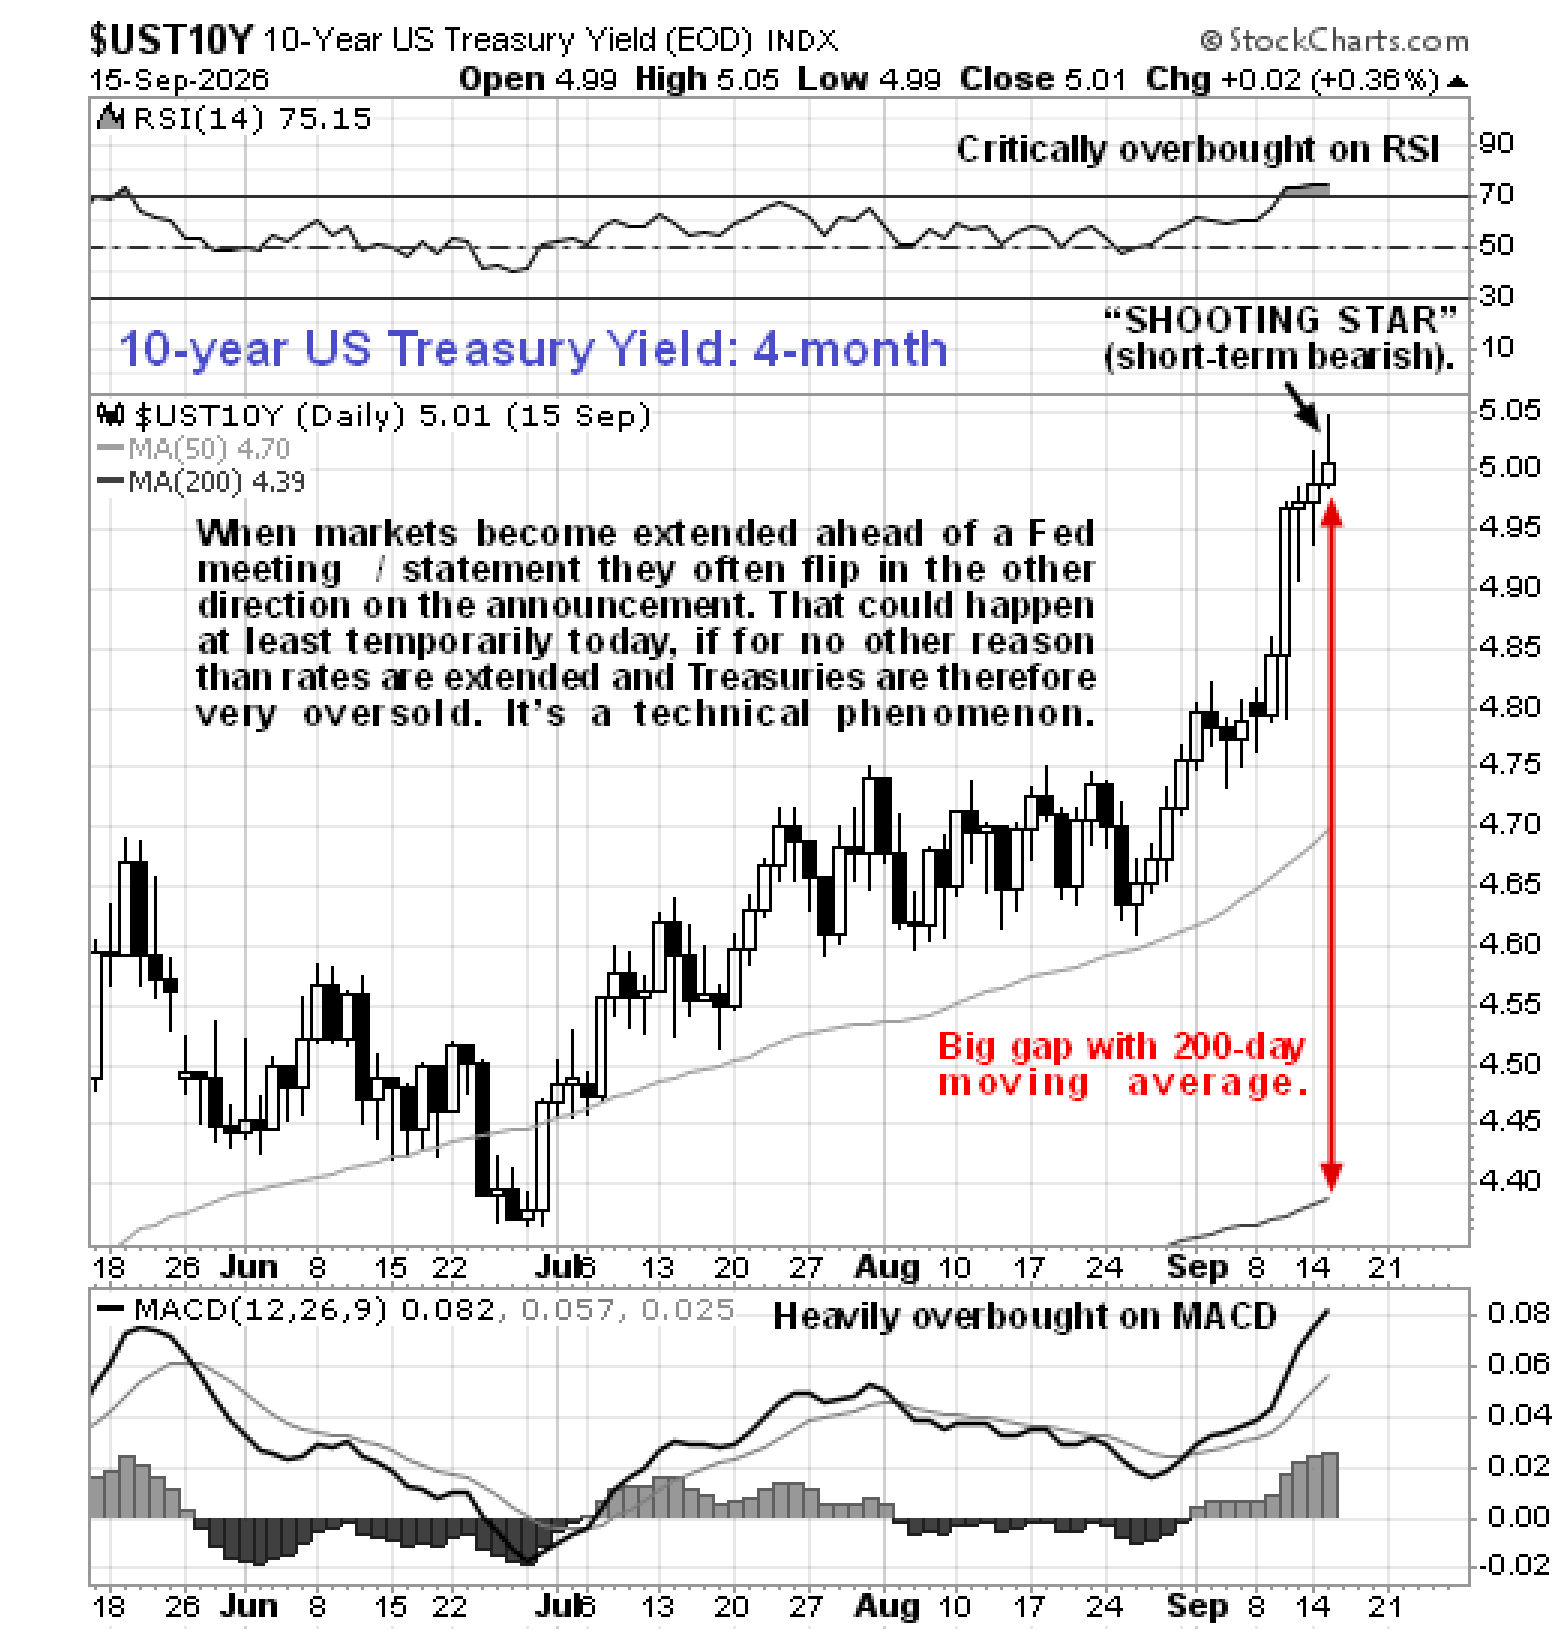
If rates do back off soon after the Fed meeting, despite a “baked in” quarter point rise, then it could trigger a relief rally in stocks and commodities, including gold and silver.
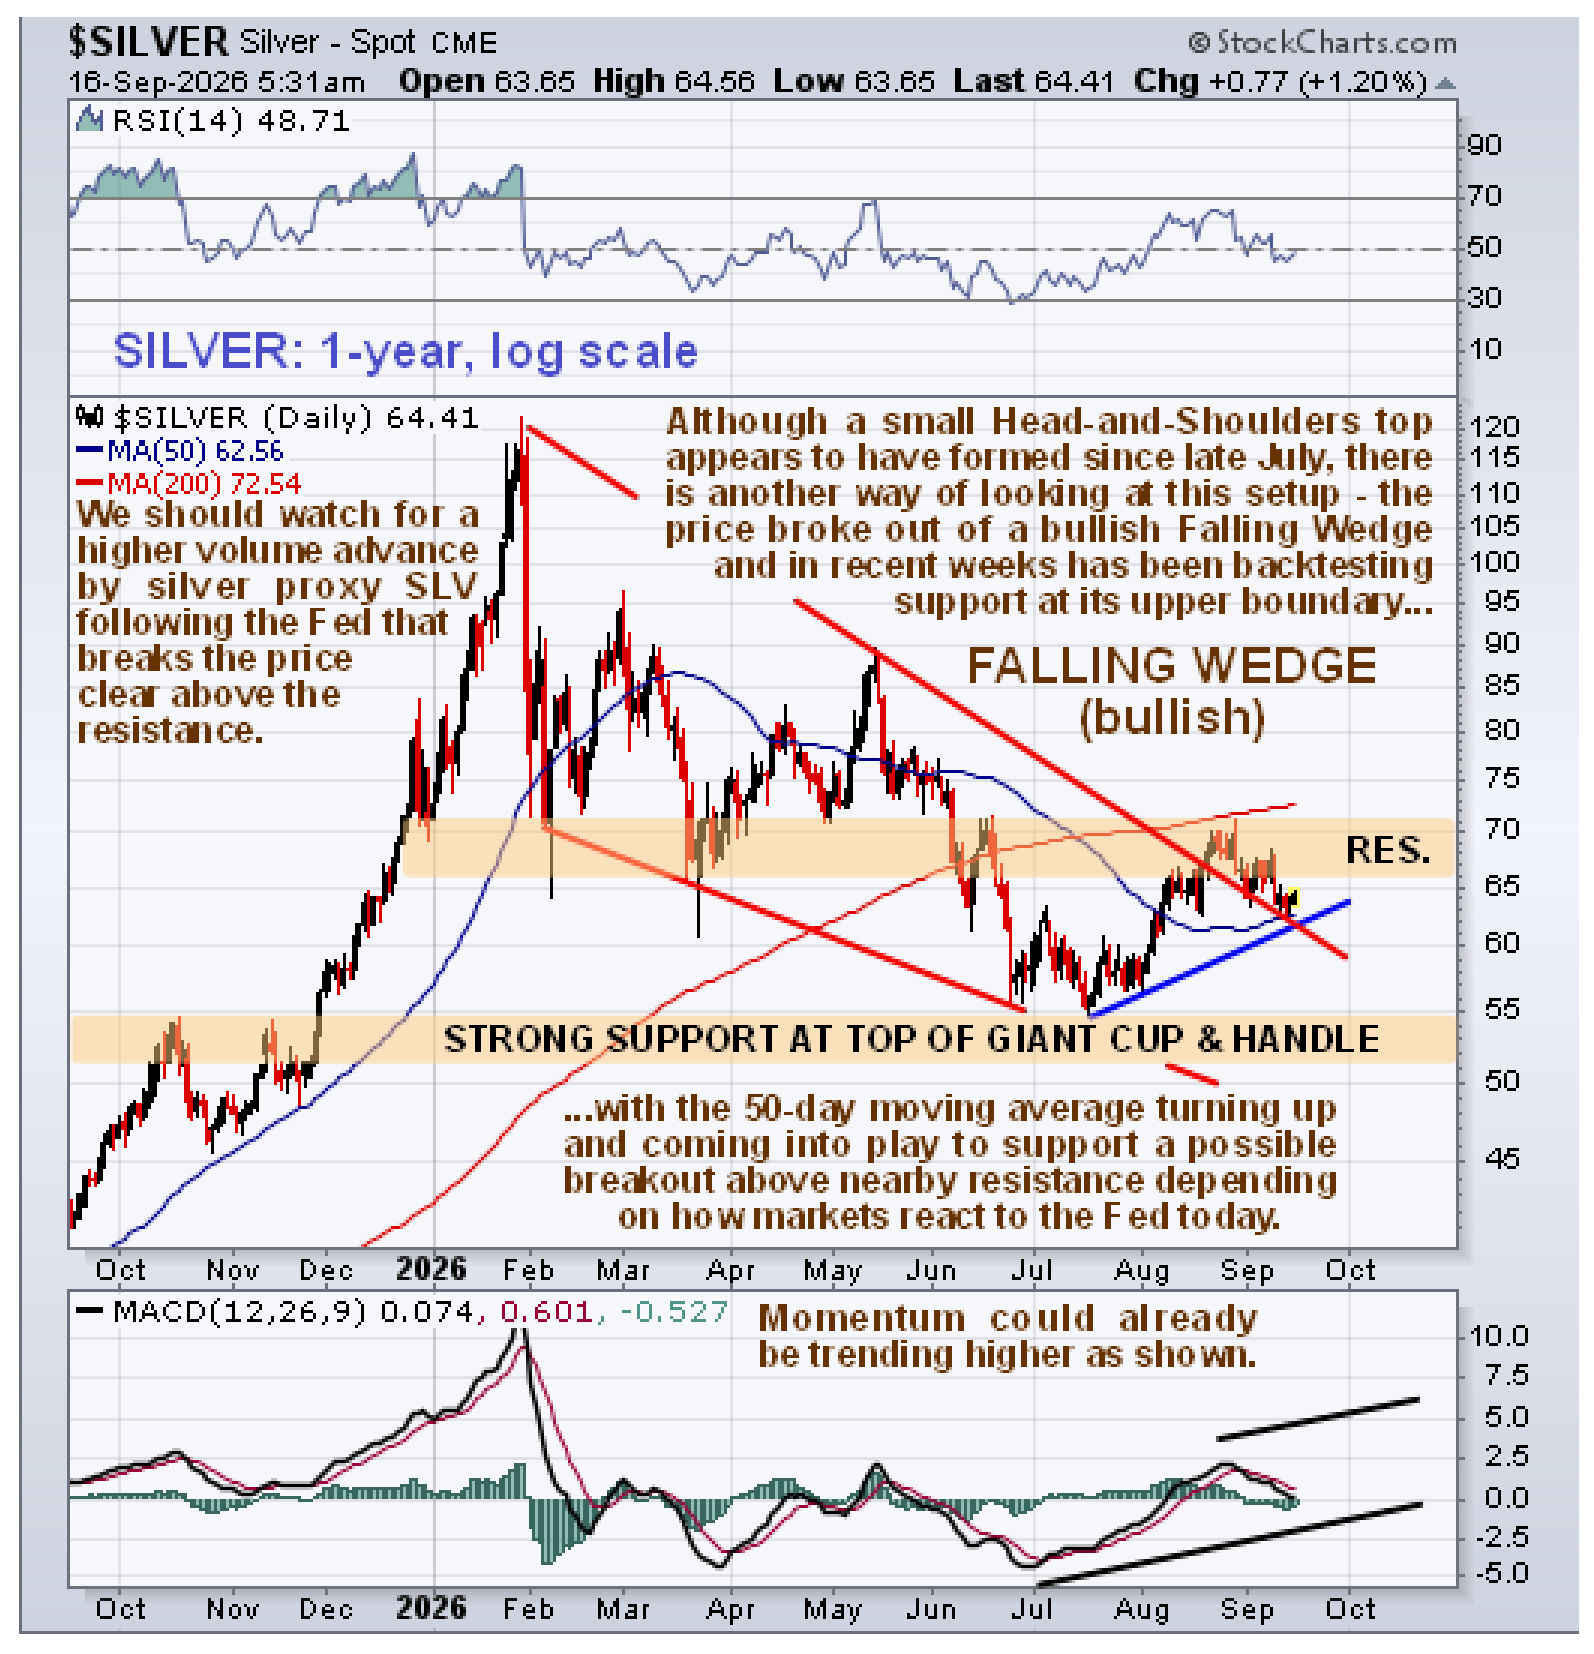
You may recall that we had identified a small bearish looking Head-and-Shoulders top in both gold and silver on shorter-term charts. However, the picture looks very different when we zoom out. On silver’s 1-year chart the picture looks considerably more positive for although it could yet break lower depending what the Fed announces (recent volume on the SLV chart is negative), this chart shows that silver may have been backtesting the upper boundary of the bullish Falling Wedge channel that it broke out in the middle of last month and if this is true then it could soon break out above the nearby resistance to enter a significant new intermediate uptrend.
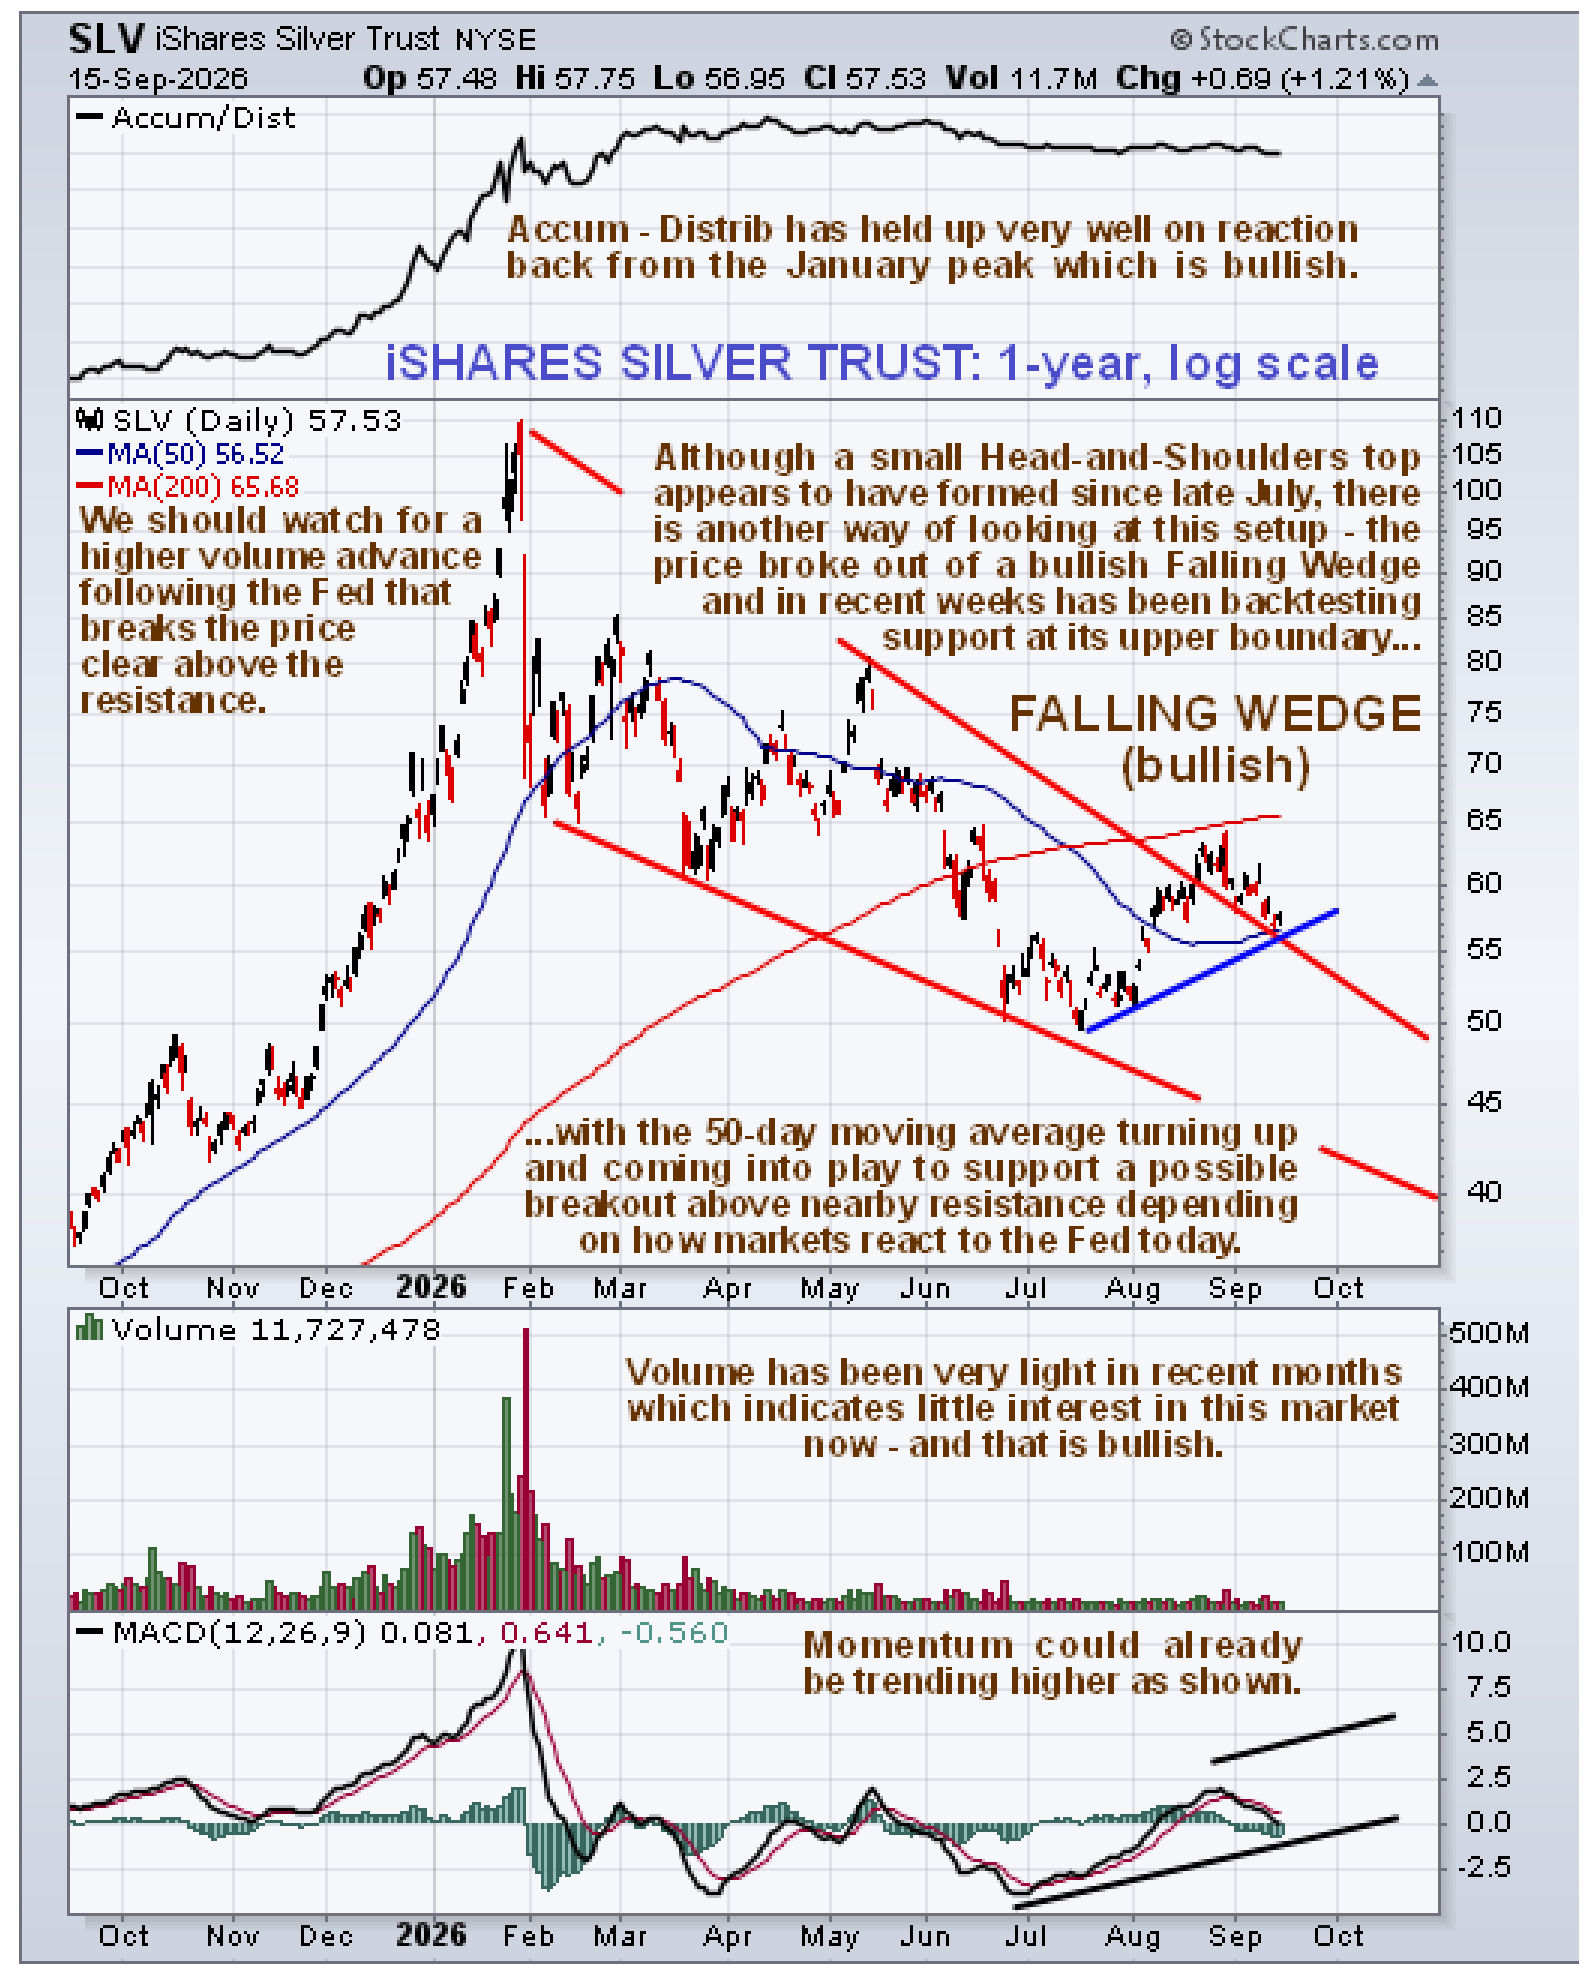
The 1-year chart for reliable silver proxy iShares Silver Trust looks about the same, but on this chart we can see that the volume pattern looks positive because it has been light for months which denotes a lack of interest that is interpreted as bullish and this is reinforced by the Accumulation line which has remained elevated as silver has corrected back from its January peak, a positive sign.
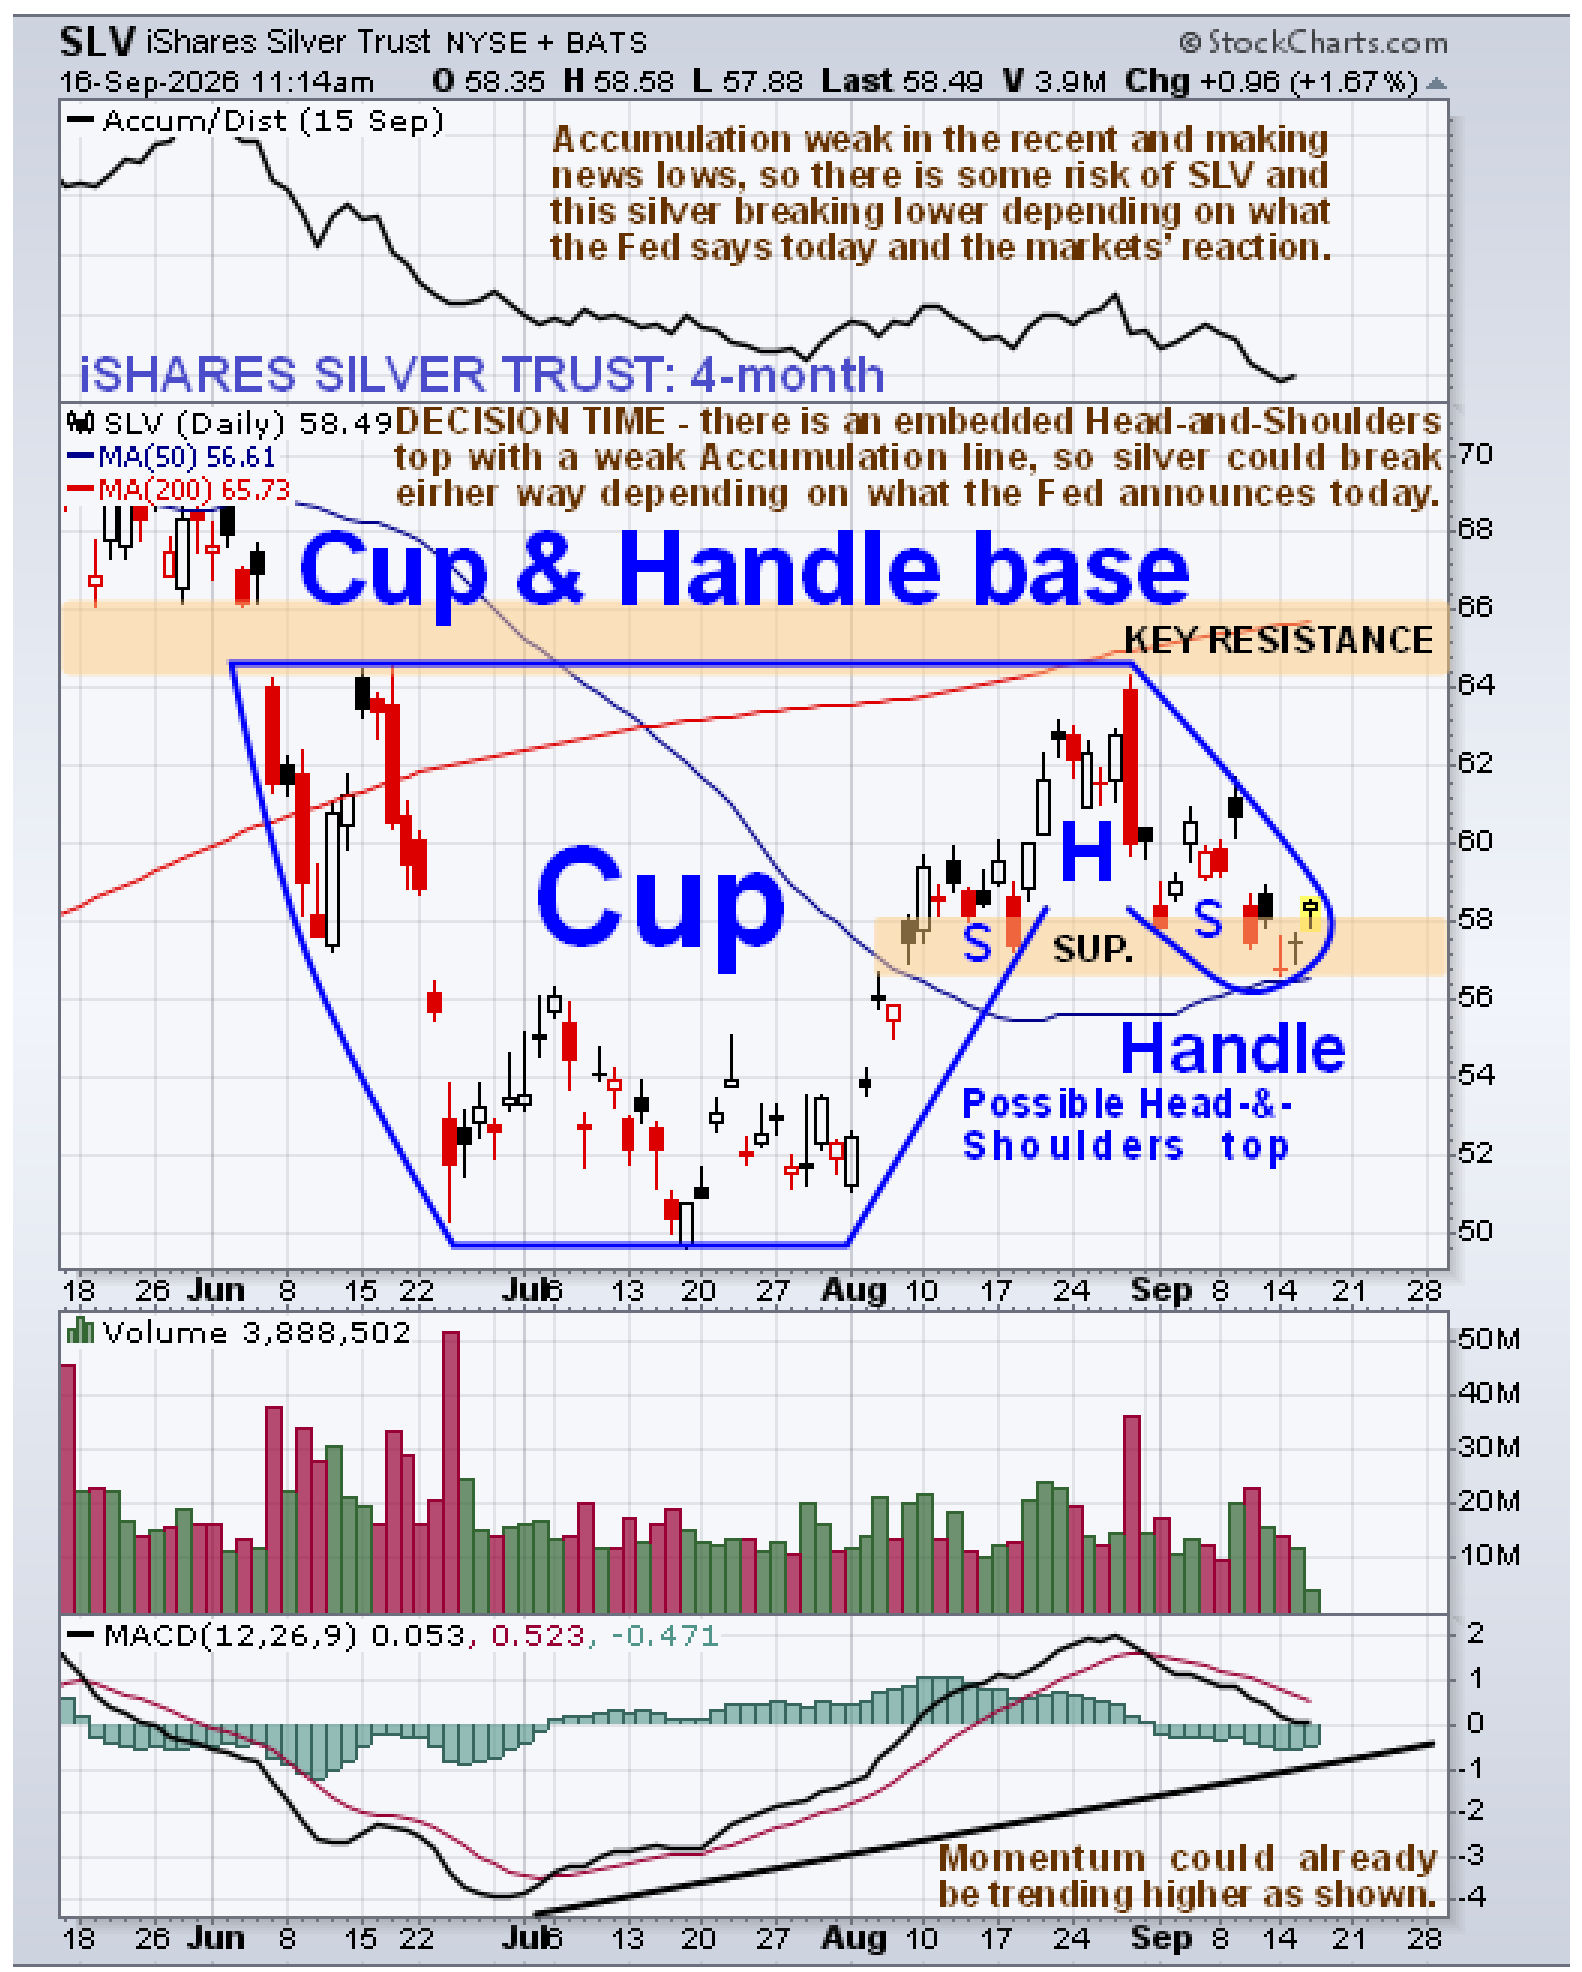
Another very positive factor worth highlighting is the fine Cup & Handle base that has formed in silver and in SLV since June that is best seen on a 4-month chart and which looks most encouraging. However, this is an either / or situation that could break either way, as made clear by the small H&S top that is embedded within this pattern, which reflects the fact that the new direction will be determined by what comes out of the Fed today. The recent rather negative volume in SLV as revealed by the Accumulation line does not assist in judging the outcome. Silver will be “out of the Woods” and on its way once it (and SLV) break out clear above the resistance at the upper boundary of their respective Cup & Handle base patterns.
So, let’s see how the market reacts to the Fed today, keeping in mind that there are sometimes wild swings in both directions for a short period before a new trend emerges.
End of update.
Posted at 1.35 pm EDT on 16th September 26.