The dollar is getting ready for a sizable rally, and that means that gold and silver are going to be knocked back again. Longer-term however, the outlook for the Precious Metals could scarcely be better, as we will see.
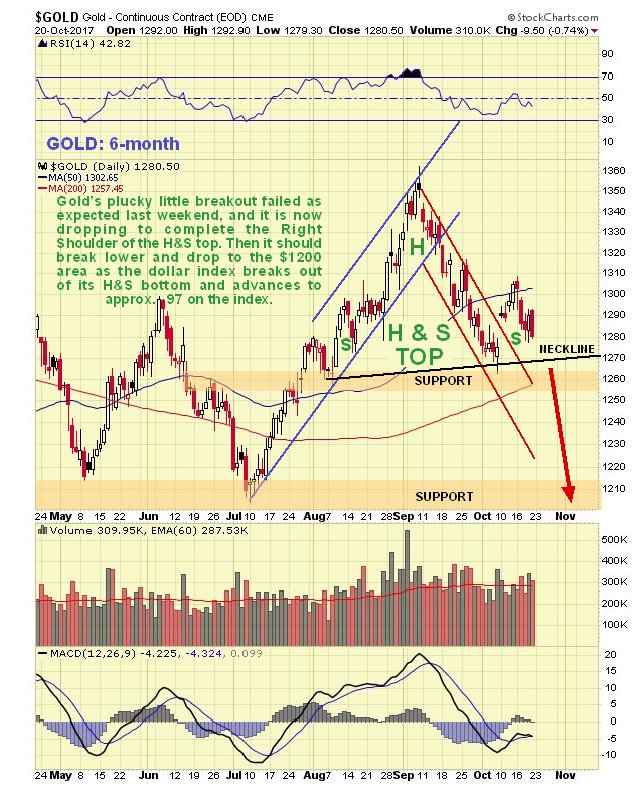
In last weekend’s update it was pointed out that gold’s gap breakout from its steep downtrend shown on its latest 6-month chart below was probably false and that it was expected to drop back as the dollar advanced, which it duly did last week. Bearing in mind that the dollar has about completed its Head-and-Shoulders bottom, it is now clear that a parallel Head-and-Shoulders top is completing in gold as shown on the chart. This chart projects a breakdown beneath the nearby support level to be followed by a drop targeting the quite strong support in the $1200 - $1215 area.
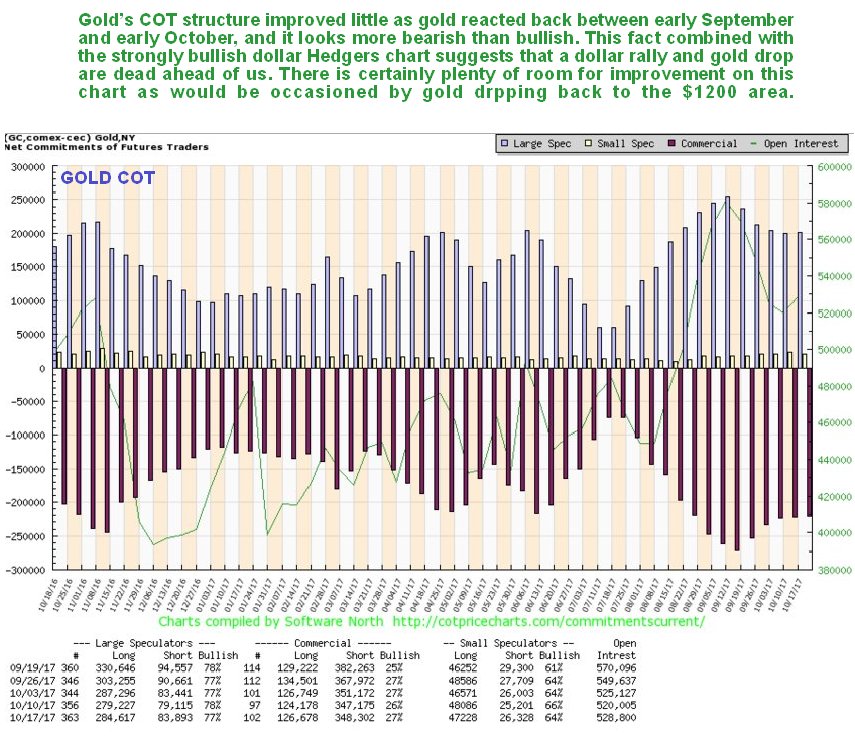
Gold’s latest COT chart still looks more bearish than bullish, with a lot of room for improvement, such as would be occasioned by a drop to the $1200 - $1215 area…
Click on chart to popup a larger clearer version.
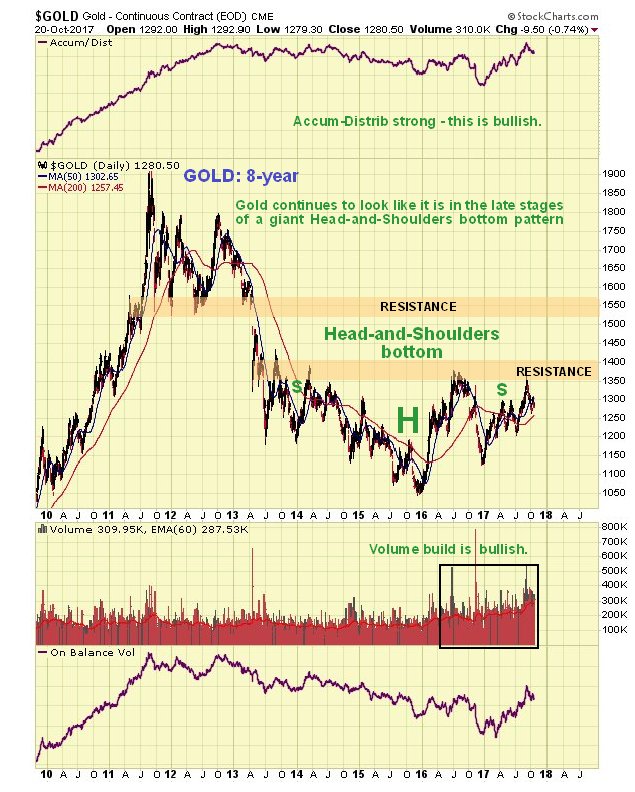
On gold’s 8-year chart it continues to look like it is in the late stages of a giant Head-and-Shoulders bottom pattern. The buildup in volume over the past 20 months certainly looks positive, especially over the past several months, all the more so because it has driven volume indicators higher, notably the Accum-Distrib line, which is not far off making new highs – exceeding its level at the 2011 peak. Once gold breaks above the resistance level approaching $1400 it will be on its way, although it will then have to contend with another important band of resistance in the $1510 - $1560 range. A near-term retreat by gold to the $1200 - $1215 area in the face of a dollar rally will not damage this long-term technical picture.
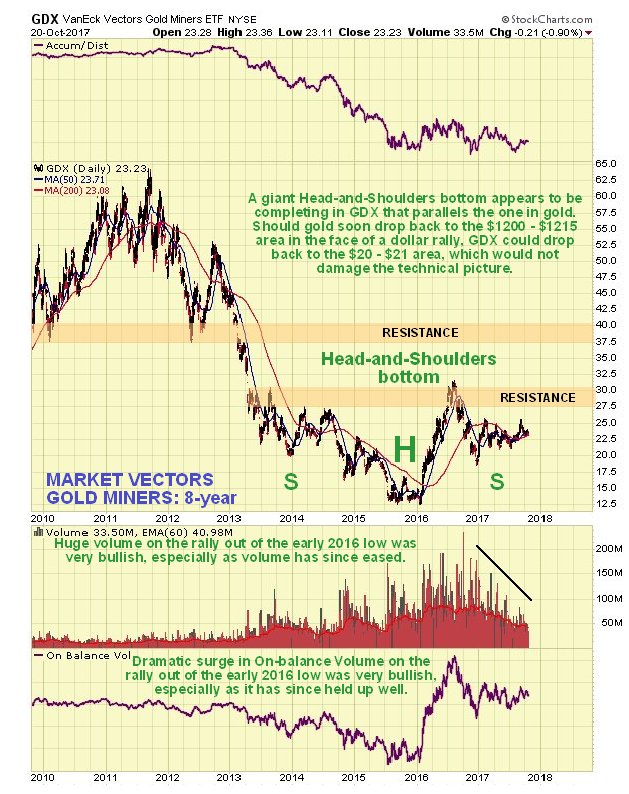
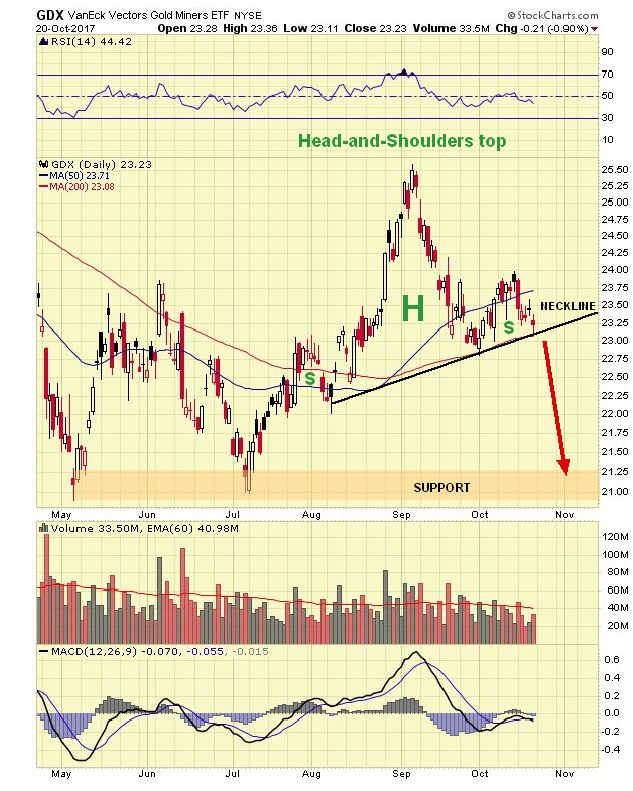
The Market Vectors Gold Miners, GDX, which functions as a gold stocks index, is marking out a giant Head-and-Shoulders bottom that roughly parallels the one completing in gold itself. A near-term decline to $20 - $21 in GDX will be viewed as presenting another important buying opportunity for the sector. The volume pattern during the build out of this base pattern is very bullish, with big volume on the rise out of the low (Head) of the pattern, tailing off steadily as the Right Shoulder has formed.
The latest 6-month chart for GDX shows an upsloping Head-and-Shoulders top completing which parallels the one completing in gold itself. This pattern targets strong support in the $20 - $21 area following the expected breakdown…
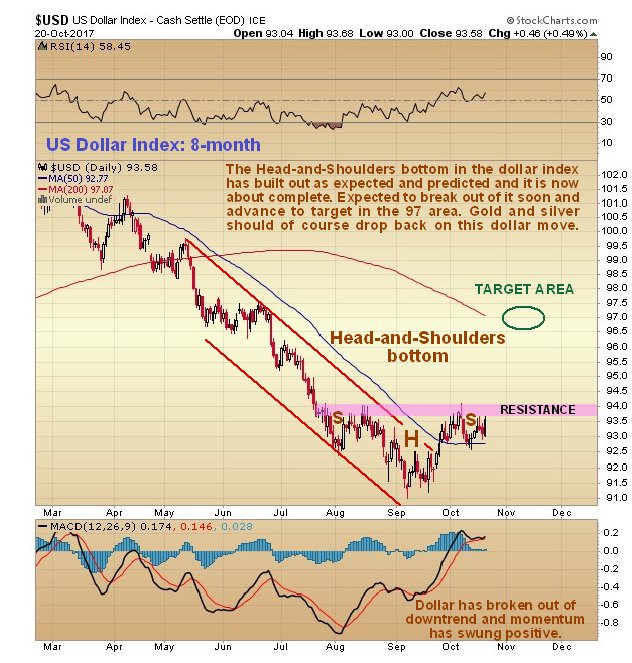
Over the past several weeks the dollar has behaved exactly as predicted in recent updates, as it has dropped back to complete the Right Shoulder of its Head-and-Shoulders bottom, and last week started to advance towards the upper boundary or “neckline” of the pattern in readiness for the upside breakout and advance. This Head-and-Shoulder bottom targets the 97 area as shown, near to the falling 200-day moving average…
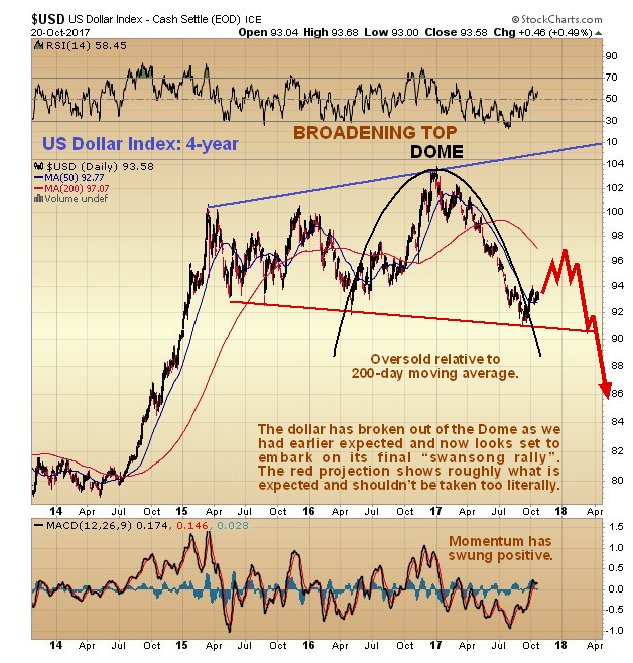
Our prediction made many weeks ago that the dollar would rally off the lower boundary of its big bullhorn pattern shown on the 4-year chart below to break out above its restraining Dome has proven to be correct, and a projection has been drawn on this chart showing roughly what is expected to happen. As we saw above on the 8-month chart, the base pattern now approaching completion targets the 97 area approx. This is the “swansong rally” – the dollar’s last rally before it “hands in its dinner pail”, and should present a wonderful last opportunity to accumulate the better gold and silver stocks, before the dollar does an about face, and breaks down from the large Broadening Top pattern into a severe decline.
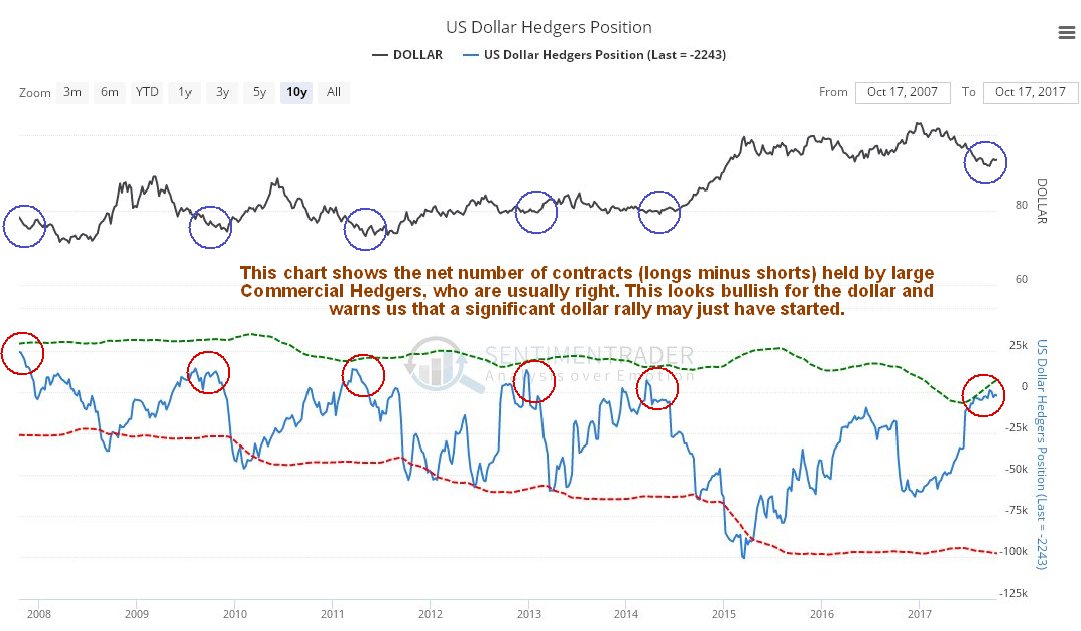
The Hedgers chart has been warning for weeks that the dollar will reverse and rally, as has been pointed out repeatedly. The latest chart shows that the rally is still ahead of us – which is congruent with the dollar having completed a valid Head-and-Shoulders bottom.
Click on chart to popup a larger clearer version.
Chart courtesy of www.sentimentrader.com
Finally, it is a matter of conjecture what will drive a dollar rally over the medium-term, but one possibility is an escalation of the Catalonia crisis, with the Madrid government attempting fascist style repression of the Catalonian’s drive for independence leading to conflict. Both Madrid and the European Union have an interest in crushing the Catalonians, since both profit from centralization of power. Thus to whatever extent the Catalonians are successful, it will inspire other would be breakaway regions across Europe, further undermining the European Union and thus putting pressure on the euro, hence a dollar index rally, as the dollar index is made up approximately 57% of the euro.
End of update.