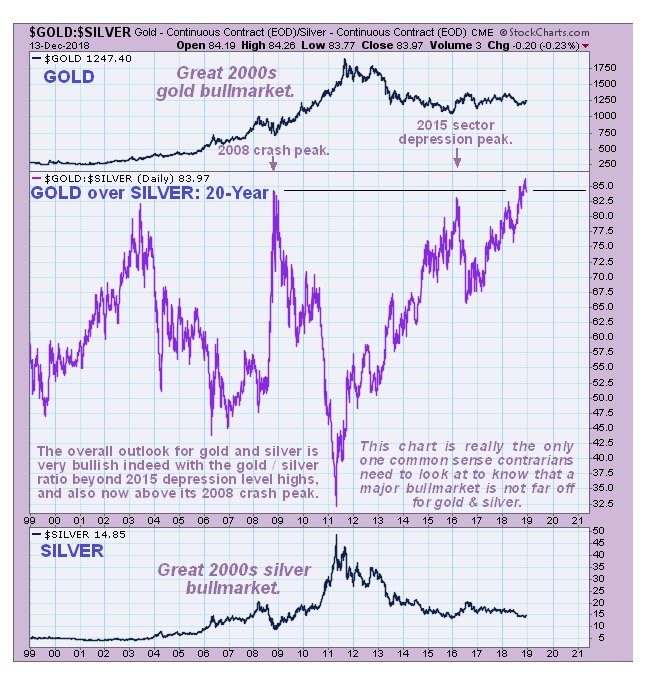
We are going to start this update on a positive note by pointing out that the gold to silver ratio recently reached a 24-year record extreme as shown by the 20-year chart for this ratio below, which alone is a sign that the sector is close to a bottom and also that a major new bullmarket is likely to start before much longer. However, there is the small matter of a looming market crash and the collateral damage it could on inflict on most everything, including the PM sector, to take into account.
Critical to gold’s fortunes around the time of the market crash is what happens to the dollar around that time. Back during the 2008 crash, as we know, the dollar rallied sharply due to a flight to cash coupled with a move into the dollar to buy Treasuries. This time round it may not be so straightforward because global bondmarkets are in deep trouble due to careening deficits and the attendant risks of outright bankruptcy and default, and there is a projected severe shortfall in demand for Treasuries. This is a big reason for the Fed raising rates ahead of the competition, the European Union and Japan etc, in order to create a rate differential so that funds continue to flow into Treasuries, and in order to prop up the dollar, because if the dollar drops significantly there will be less reason for foreign investors to buy Treasuries since they will fear a loss of principal if a dollar downtrend sets in. Another pressing reason to raise rates is to create “wiggle room” to lower them again once the markets crash and they need to firefight the situation.
The reason that the Fed is caught between a rock and hard place, to use a hackneyed old expression, is that they have to raise rates much more than have already to create the desired wiggle room, but because of the towering deficits, the markets will crash long before they reach their rate target, especially as they are draining liquidity with their QT (Quantitative Tightening) program, with the clamor for relief then forcing them into emergency QE, which will have to be on a gargantuan unprecedented scale, a development that will usher in the last and inevitable stage of the fiat endgame, as the economy is vaporized in a firestorm of hyperinflation. If you complacently think this only happens in banana republics like Venezuela and Zimbabwe you better think again, because it can happen anywhere that banana republic economics is employed, and sadly that includes pretty much all of the Western World, thanks to the completely irresponsible descent into fiat, which is paper money that is unbacked and intrinsically worthless.
With the above in mind we will attempt to figure what the Fed will do with rates at its upcoming meeting this week. Some think it will chicken out of raising them again according to its planned schedule, in order to avoid crashing the markets, but if it does this the dollar is likely to tumble, undermining future demand for Treasuries, and here we should note that the Treasury market is far more important to the US than even the stockmarket, because the Treasury market is the “parking lot” for a stupid world that has spent decades swapping goods and services for piles of worthless paper. The way this works is that the US pays for goods and services from other countries by printing up heaps of dollars, which these countries then process into Treasuries, foolishly thinking that they are like “money in the bank” – just wait until the US springs the ultimate swindle trap on them by inflating them away into oblivion, so that they one day realize that their Treasury horde is nothing more than a pile of stinking garbage, which will mean that they have been working for decades to keep the US supplied with goods and services in exchange for nothing. If they really wanted to put “money in the bank” then they wouldn’t be buying Treasuries at all, they would be buying gold, and to be fair countries like China and Russia have woken up to this reality and have been stashing away gold in recent years as fast as the fiat entranced Western world will sell it to them.
One of the bizarre ironies of the situation in recent years is that the buying of Treasuries by foreign countries has enabled the US to finance an all-powerful military machine which they then use to threaten anyone who doesn’t conform to their dictates. It’s rather like you walking up to some thug on the street, handing them a big stick and then bending over and saying “Please sir, beat me.” However, the penny is finally starting to drop, which is why the race is on, with countries that want to remain independent like China and Russia scrambling to beef up their militaries, and starve out their oppressor, or would be oppressor so that it can no longer afford its giant military machine, by de-dollarizing, and stashing away gold as fast as they can, so that someday they can back their currencies with it. Needless to say, the oppressor is not going to take this lying down, which is why a major war or wars are likely before too much longer, and in many ways the global situation is similar to the mid - 1910’s or the 1930’s. Some potential flashpoints are already obvious, chief amongst which are the South China Sea, Taiwan and the Ukraine.
So, since dollar dominance in support of the Treasury market is much more important to the US than even the stockmarket, it seems likely that the Fed will stand firm and stick to its rate rise program, and the stockmarket can do as it pleases. Only when things get really extreme is it likely to ride to the rescue with emergency QE, which will lead to hyperinflation and a massive reset where all the debts are wiped clean simply because they become worthless and holders of Treasuries end up with what they deserve – nothing. Gold will do a moonshot. The alternative to a stealth default by hyperinflation is an outright default on many debts, and the reason why the former option is preferable to the powers that be is that is it takes longer.
There are times in life when being frightened can save your wealth and it can sometimes save your life. Egon Von Greyerz has written a string of lurid and terrifying essays on what is heading our way. While the complacent and insouciant majority easily dismiss him as simply “talking his book” because he herds people into gold which is his business, or say that “even a stopped clock is right twice a day” because he has been talking along these lines for years, that does not mean that he is wrong. On the contrary, he looks more right with each passing day, and his warnings should be taken seriously.
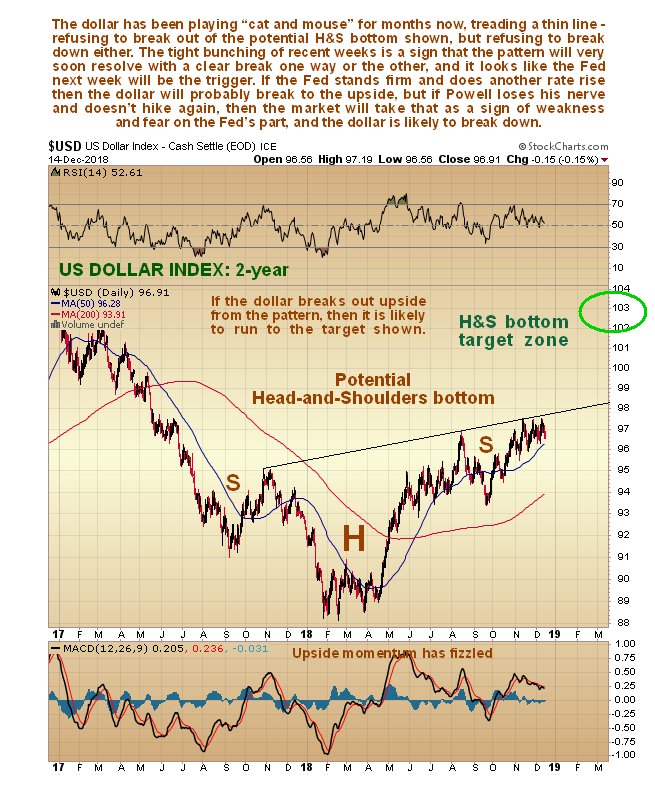
Next week’s Fed meeting promises to be a pivotal one when we find out if they are going to “stay the course” and keep with their program or bow before pressure and fold. If they do the former then our take is that the markets could plunge and the dollar advance quite sharply, if the latter the dollar will break down and gold and silver should rise sharply. Just how finely balanced this situation is can be seen on the latest 2-year dollar chart where we see that it has been in an undecided unresolved state for about 6 months now, bumbling sideways beneath the neckline of a potential Head-and-Shoulders bottom. Fluctuations have become very tight in recent weeks, implying that a big decisive move is in the works, and the Fed is likely to trigger it next week. If the Fed stands firm the dollar is likely to break out upside, which should trigger a quite rapid run to the 102 – 103 area, if they turn yellow, then the dollar will break down and the pattern abort.
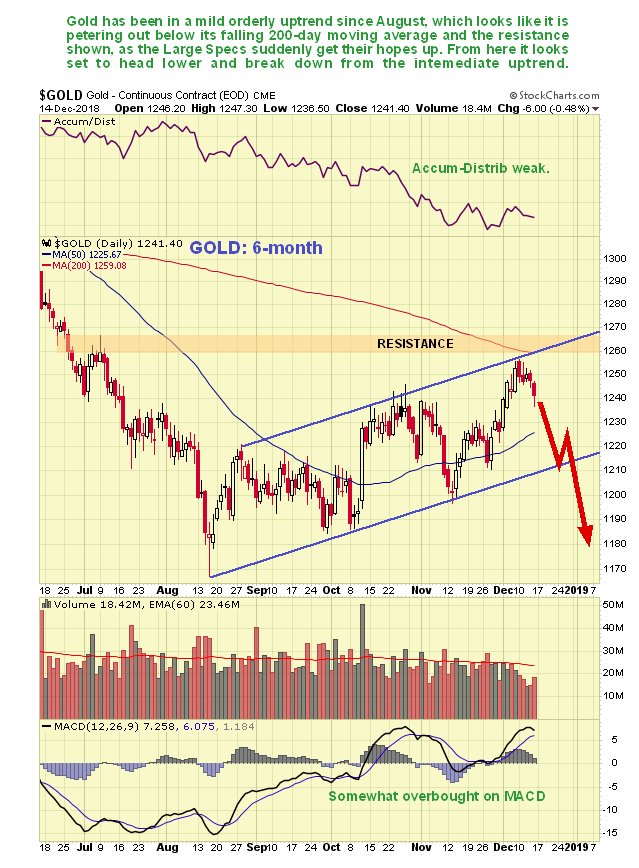
There were signs of weakening in the Precious Metals markets late last week suggesting that the Fed will “stick to the plot”. Let’s now look at the latest charts. Starting with the 6-month chart for gold, we see that, having been in a modest uptrend since mid-August, it reached a trendline target about a week ago, beneath resistance and beneath a falling 200-day moving average, 3 negative factors which succeeded in pushing it lower again by late last week.
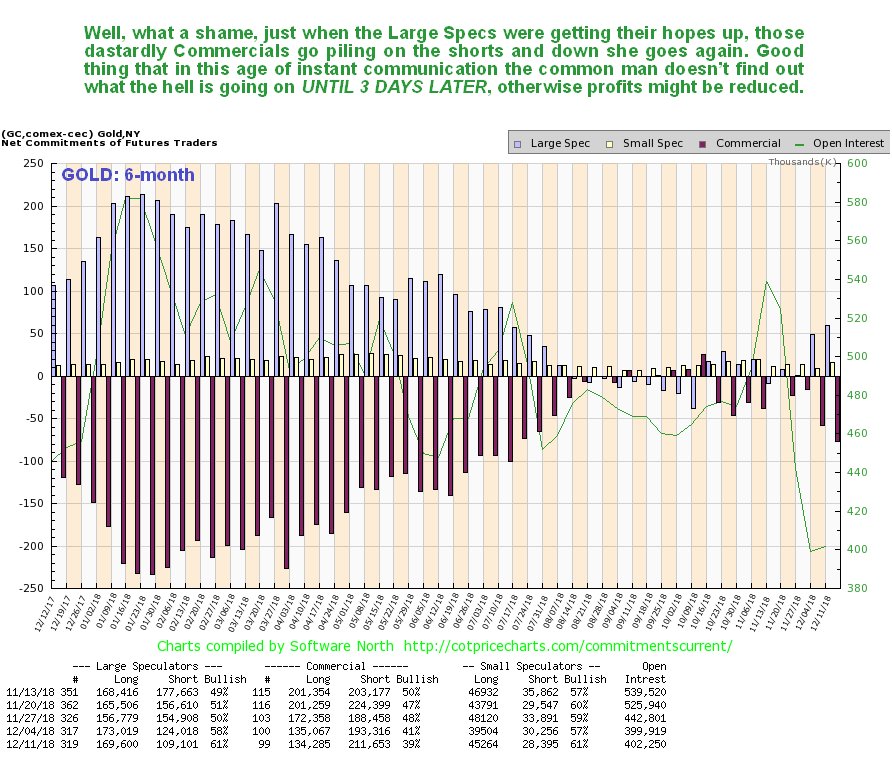
COTs for gold had looked bullish until just 2 weeks ago, but then the Commercials started piling on the shorts again as the Large Specs came out of hiding. Good thing for the Smart Money that in this age of instant communication, it takes 3 days, i.e. as long as it took to get to the moon in 1969, to release the COT data – after all, one wouldn’t want the ordinary investor to know what’s going on under the hood, would one? – that would definitely reduce the edge. Whilst still far from flat out bearish, the marked deterioration over the past two weeks has opened up the risk of a drop again, and it is interesting to note that silver’s latest COT showed quite severe deterioration.
Click on chart to popup a larger, clearer version.
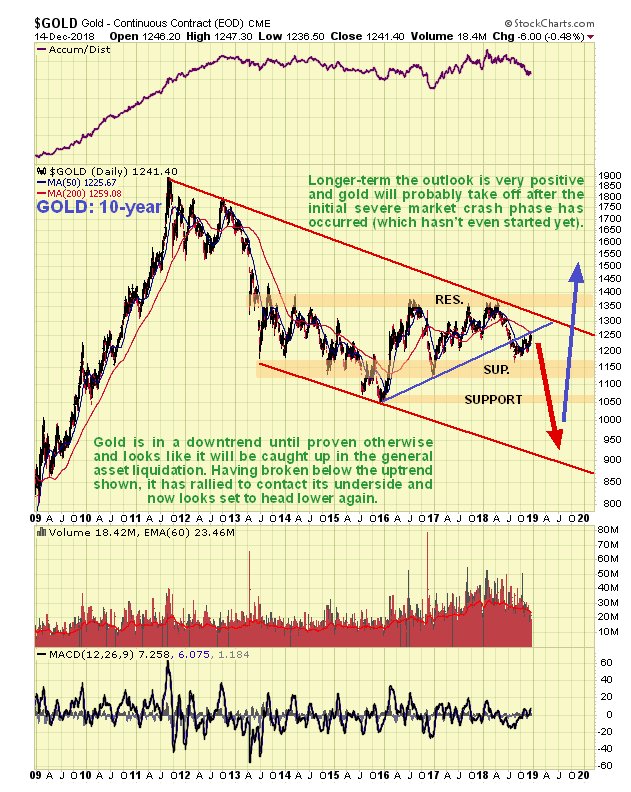
Whilst we initially passed off the rather sharp drop into August of this year as the price dropping back to form a Right Shoulder of a Head-and-Shoulders bottom, this drop rather spoiled the pattern as it involved a breakdown beneath the uptrend line shown on the 10-year gold chart, and with a broad based market crash drawing ever closer the risk is that all commodities get sucked into it, especially if the dollar breaks higher again. In light of this the fact that gold is starting to roll over again having just risen to touch the underside of the failed uptrend line, and the weakening accumulation line, looks rather ominous, and the worst case is that if the dollar rallies as the stockmarket crashes, it could get caught up in a general maelstrom and wind up back at the lower boundary of the large prospective downtrend channel shown, which would put it at about $900. That should of course mark the end of it and a violent reversal to the upside and explosive advance should follow as the world’s Central Banks rush to man the pumps with the biggest QE program ever, which should right the ship temporarily before it eventually founders ignominiously on the reefs of hyperinflation.
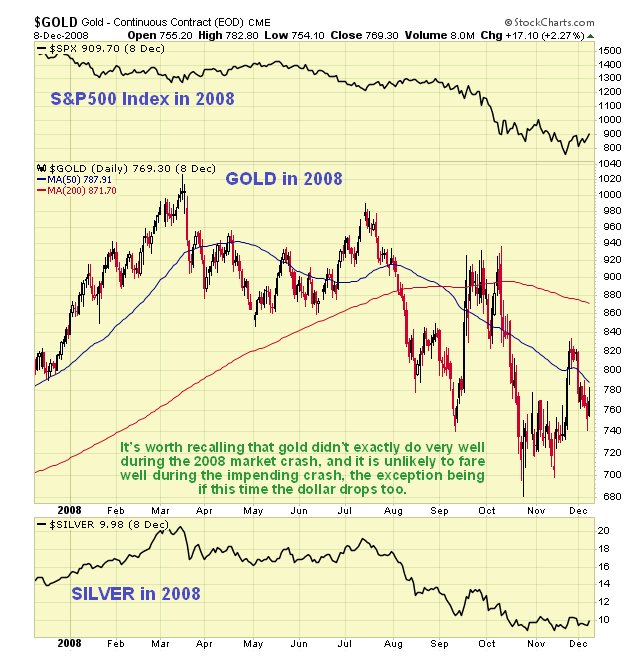
We will now remind ourselves what happened to gold during the 2008 crash, with a chart from that time. As we can see it wasn’t an impressive performance, but its decline was more a function of a rising dollar than a falling stockmarket…
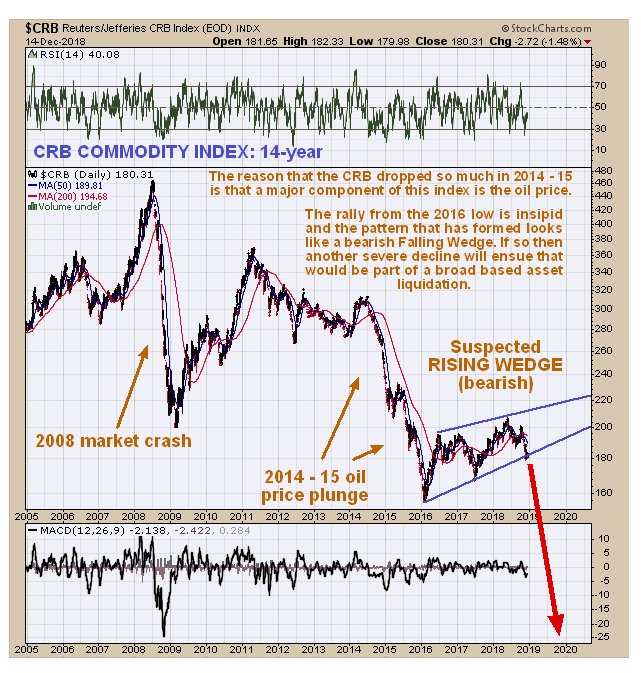
Logically, if the economy tips into recession / depression, we would expect demand for base and industrial metals – and commodities generally – to contract, and it doesn’t look like gold and silver will be granted a “get out of jail free” card. This next chart shows the dire performance of commodities generally during the 2008 crash, and how they are setting up for another plunge, with this CRB index on the point of breaking down from a giant bearish Rising Wedge, that started to form back early in 2016.
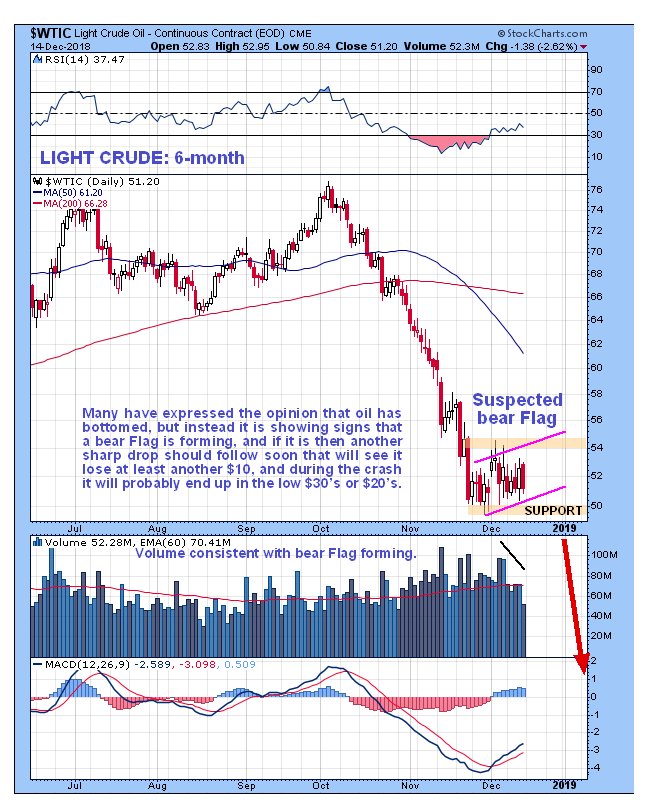
With oil being an important component of the CRB index, it is worth taking a quick look at the oil chart to see what is going on there. Whilst some have opined that it is basing here, it looks much more likely that it is instead forming a bear Flag, and, since these Flags “fly at half-mast”, if it is we can expect another steep drop very soon, which suggests another heavy drop in the broad stockmarket soon
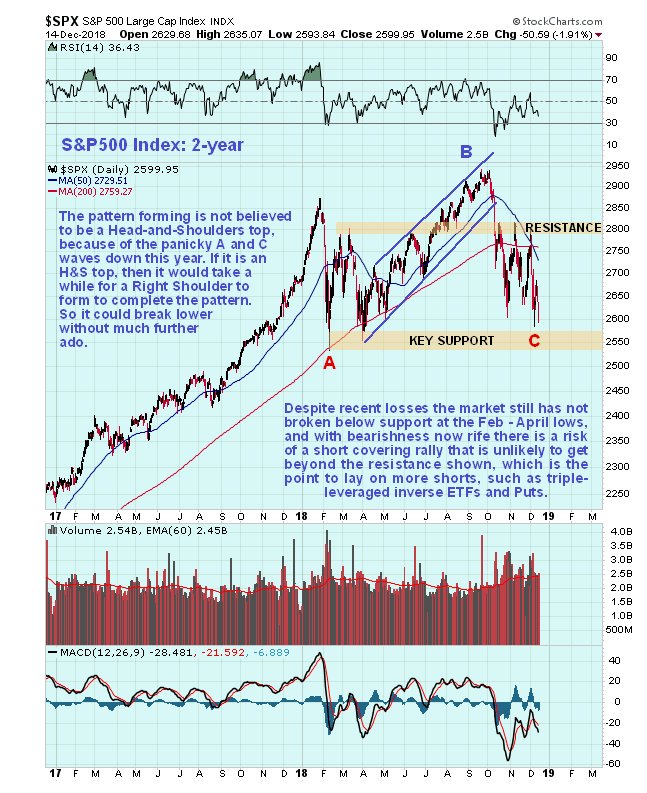
As for the stockmarket, the key point to note is that it is still marking out a giant top area, and the bearmarket proper, which is likely to begin with a crash phase, won’t start until it has broken above the lows of last February and April. Whilst it remains above these lows a rally back towards the highs – which probably wouldn’t get beyond the resistance in the 2800 area - is possible.
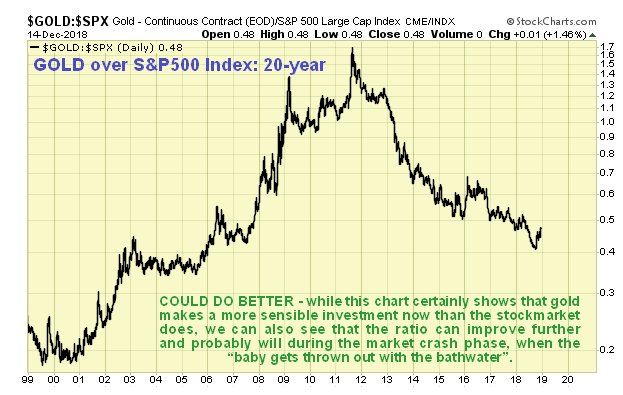
The last chart shows gold compared to the stockmarket (S&P500 index). On this chart we can see the gold is good value now relative to the stockmarket, but also that this ratio could become even more favorable, which would be likely to happen during a market crash.
End of update.


