For those who expect gold to keep going up nonstop the past few weeks have been disappointing, but for more experienced investors and traders who like to “keep one foot on the ground” the pullback of the past few weeks across the sector is a blessing – let me proceed to show you why.
On the latest 6-month chart for gold we can see that it broke out to new all-time dollar highs and then above the “magic” $2000 level early this month, a development that brought forth a plethora of bullish articles and prognostications as you would expect, sucking in the less experienced at a top as usual. Gold’s action in doing that was actually very bullish, but as it did it at the end of a steep unbroken rally that resulted in it becoming extremely overbought, it needed to stop for a rest, and it has taken a rest over the past few weeks.
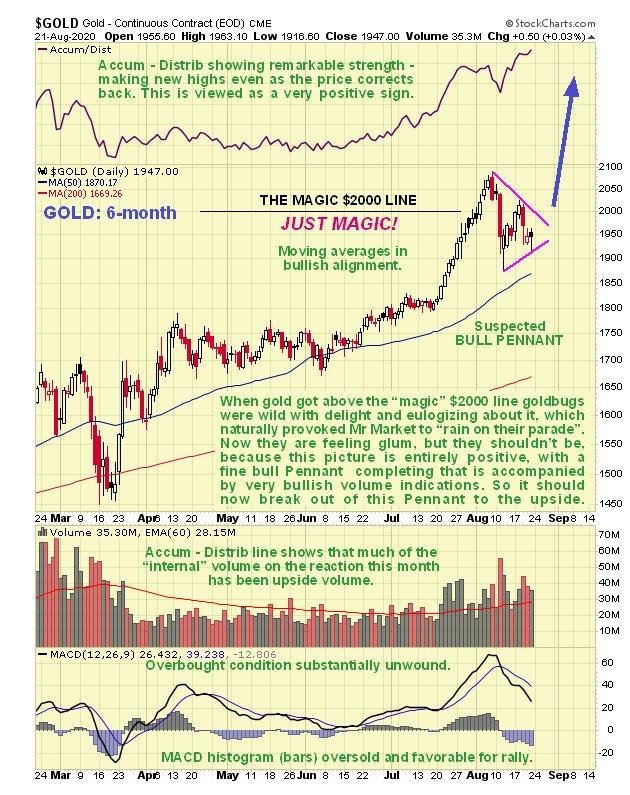
Gold’s corrective action since its early August peak is actually as bullish as its breakout to new highs and above $2000, for we can see that the reaction has taken the form of a fine bull Pennant that has gone a long way towards working off the earlier overbought condition. No technical damage whatsoever has been caused by the 2 declines within this Pennant – on the contrary, it has been accompanied by a very bullish volume pattern, which is why the Accumulation line, shown at the top of this chart, has risen to new highs as the Pennant has formed, which is a most auspicious indication. With the price now not far above its rising 50-day moving average, the MACD histogram (blue bars) well into a negative reading and the Pennant closing up, the time looks right to gold to break out upside into another upleg and here it is worth noting that many PM stocks are on the point of upside breakouts, which is why we have been piling into them in recent days.
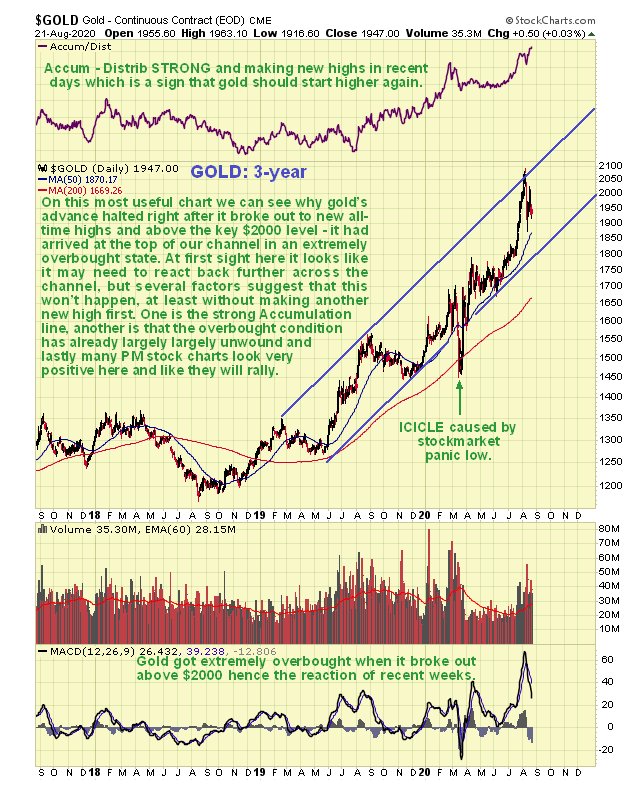
The 3-year chart is also very useful as it enables to see, in addition to gold being very overbought at the time, exactly why its advance stopped where it did a few weeks back. The parallel uptrend channel shown, which we used in the last update to predict a gold surge to new highs, also gave us a target area at its top rail, which as you can see was in the $2050 area which was about where the advance stopped. Superficially it looks like gold could continue to react back across the channel near-term, but that is considered unlikely for several reasons. One is the strong volume pattern and Accumulation line advancing to new highs which points to further gains soon. Another is that the earlier overbought condition has already substantially unwound, as shown by the MACD indictor, and finally the charts of many PM stocks show them wanting to go up sooner rather than later. One possible scenario here is that gold advances again to make new highs at the upper rail of the channel and then has a somewhat larger correction or more lengthy period of consolidation, although we should bear in mind that, having broken out to new highs, gold’s rate of ascent could steepen considerably so that it busts out above the top restraining trendline of the channel, which is quite possible given the extraordinary fundamental conditions that now prevail which include manic unprecedented money creation.
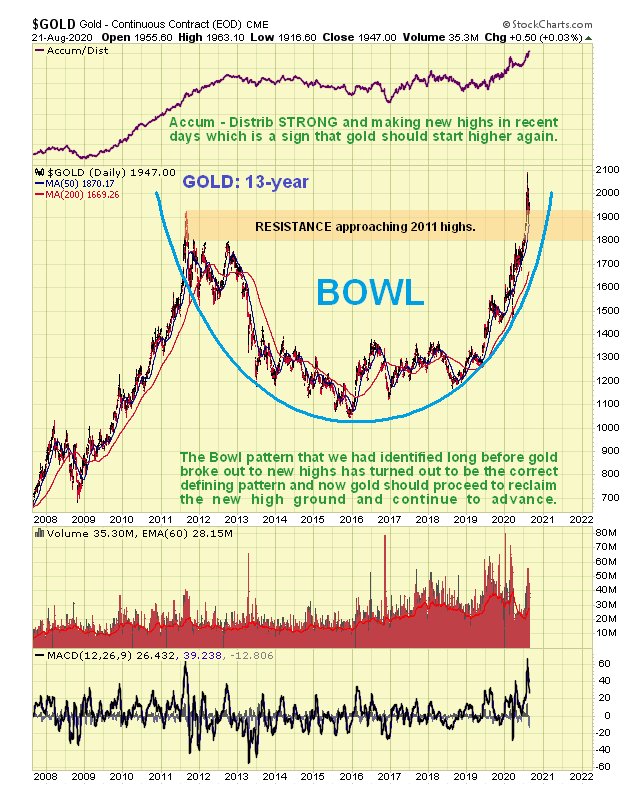
The 13-year chart shows gold’s momentous breakout to new highs, with its increasing steep rate of advance driven by the now steeply ascending right side of the giant Bowl pattern. This is now a very dynamic pattern so gold should soon reclaim the high ground that it slipped back from over the past several weeks.
Now let’s consider some other factors that should assist gold in its continued ascent.
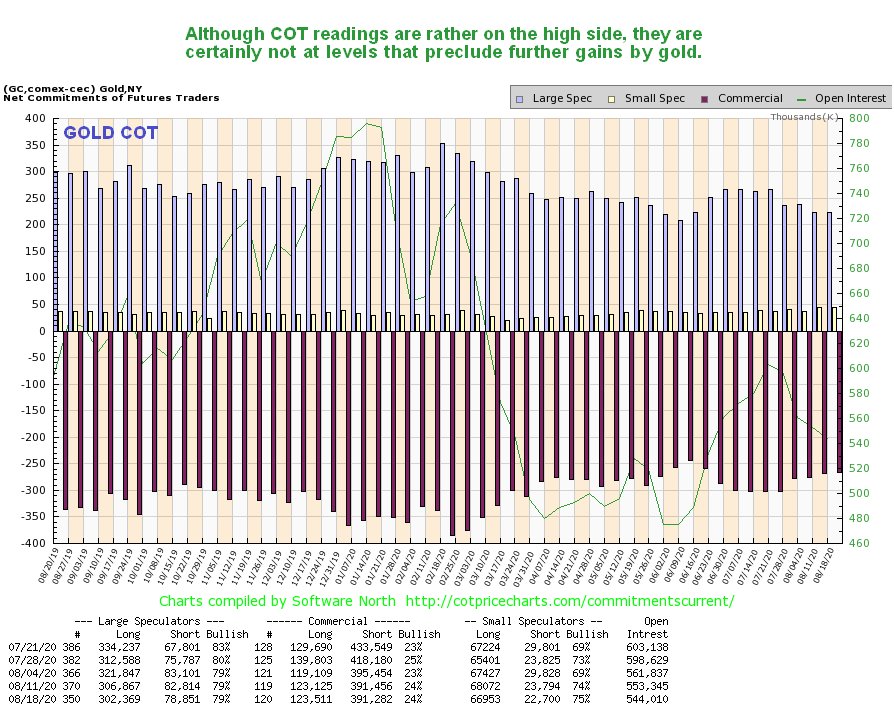
Gold’s latest COT chart shows readings that, while somewhat on the high side historically, are certainly not at the sort of extremes that will prevent it making further significant gains over the short to medium-term…
Gold’s latest optix or optimism chart shows that sentiment towards it has moderated substantially during the correction / consolidation of the past few weeks, restoring immediate upside potential…
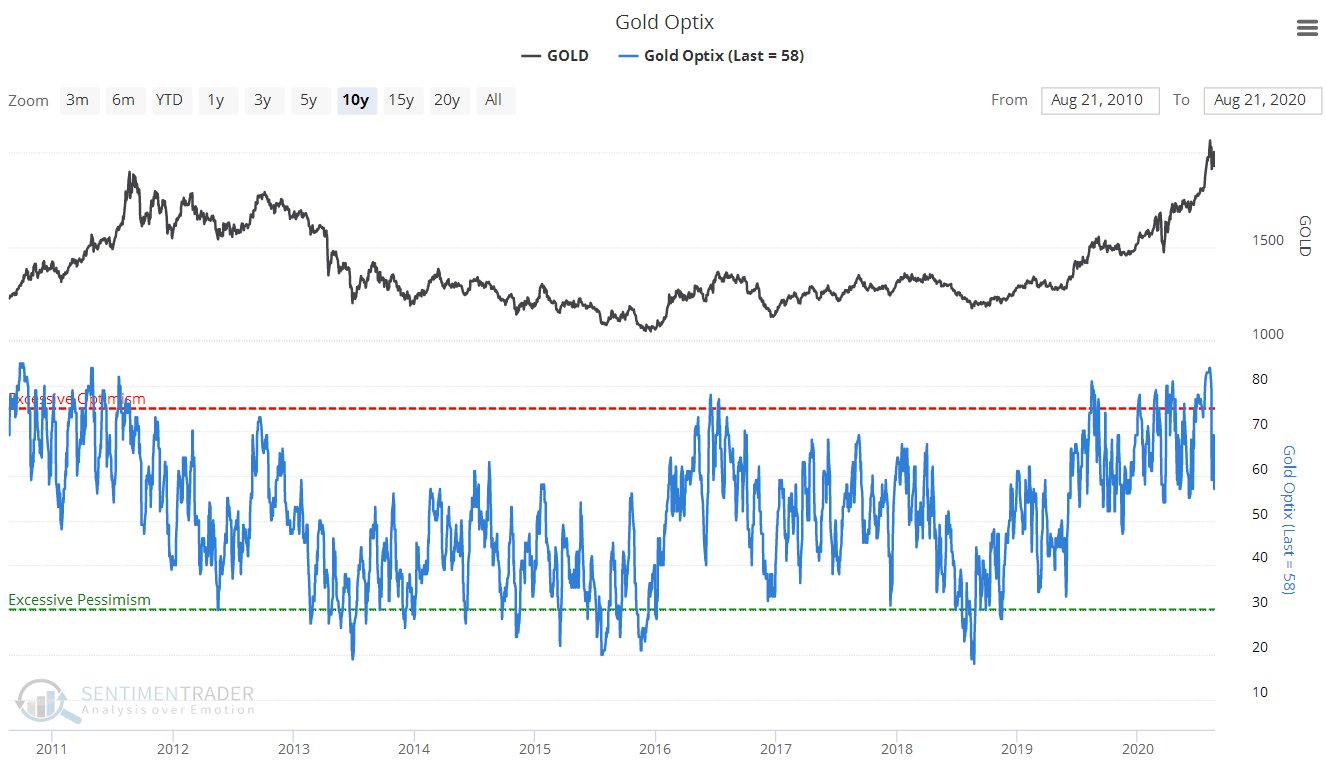
Chart courtesy of sentimentrader.com
Gold’s risk levels have dropped a lot over the past several weeks too, from a reading of 9 at the peak to the current 4…
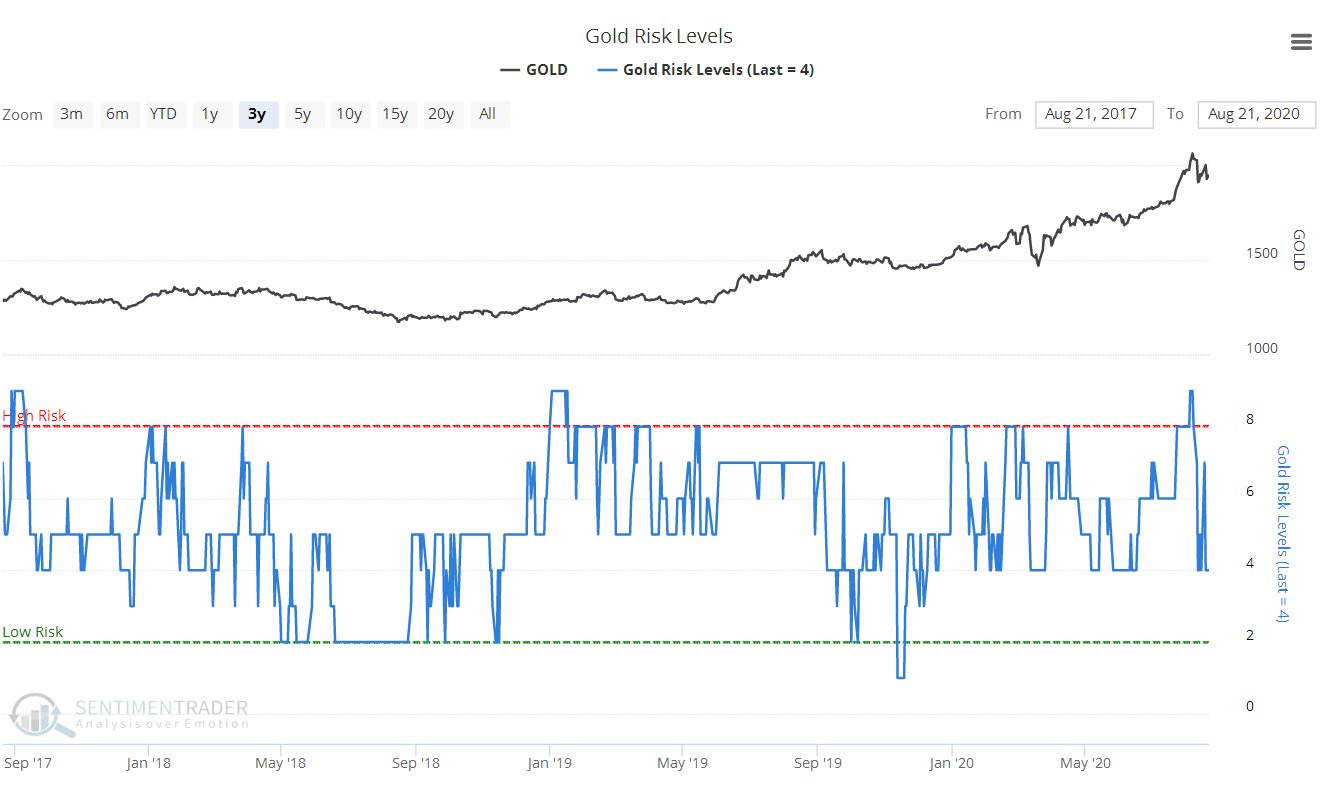
Chart courtesy of sentimentrader.com
In dropping back over the past several weeks, gold was actually moving contrary to its highly favorable seasonal factors – August and September are seasonally its best months of the year – but this was only because it rose so much during the 2nd half to July to become extremely overbought…
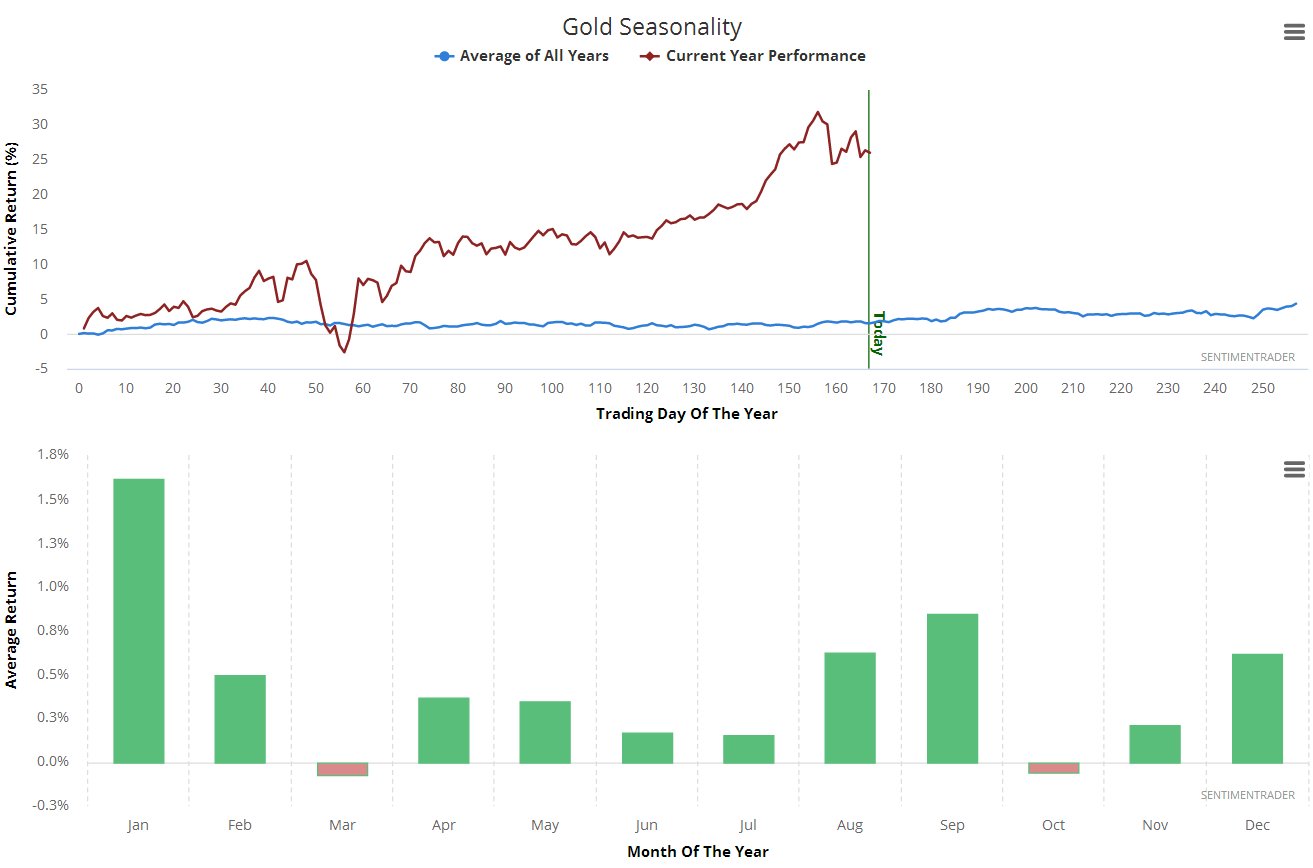
Chart courtesy of sentimentrader.com
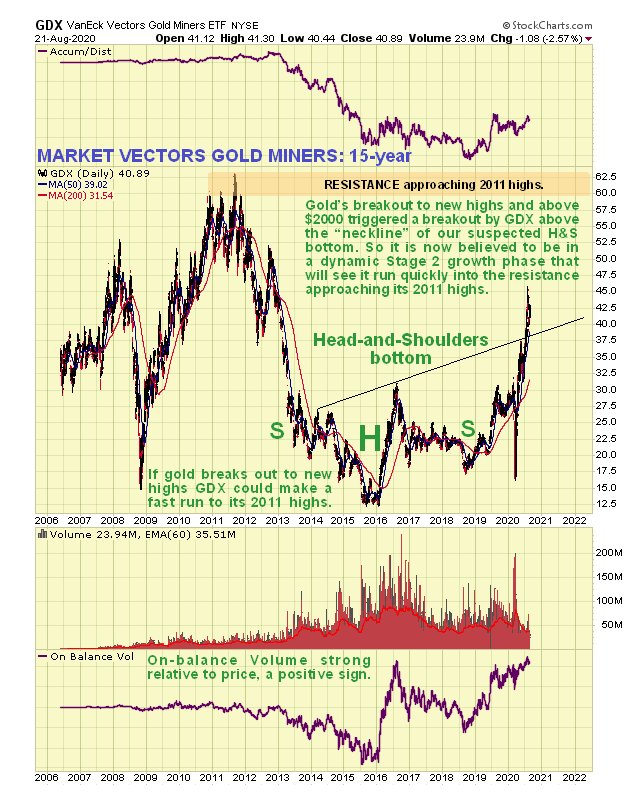
Alright, so what about Precious Metals stocks? On its long-term 15-year chart we can see that, having broken above whatever resistance there might have been at the upsloping boundary shown of a suspected giant Head-and-Shoulders bottom, GDX is now in a dynamic Stage 2 advancing phase that should see it run quickly into the resistance approaching its 2011 highs.
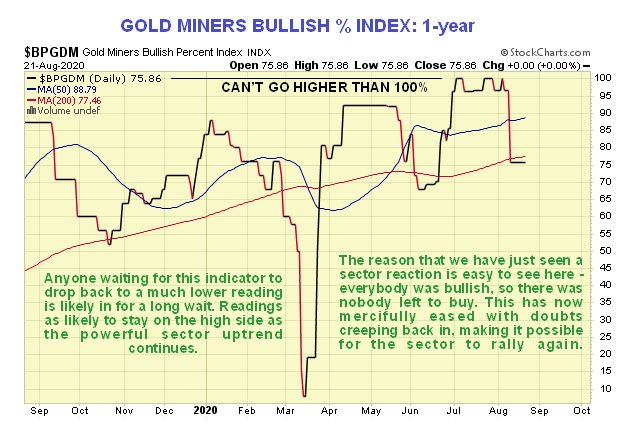
The sector reaction of the past few weeks has significantly moderated the Gold Miners Bullish Percent Index which had reached its maximum extreme reading of 100% during July and into the start of this month, which meant that a correction was almost inevitable. Now it has dropped back to a much more comfortable 75% which is still high, but moderated enough to permit renewed advance….
We’ll finish by taking a quick look at the dollar.
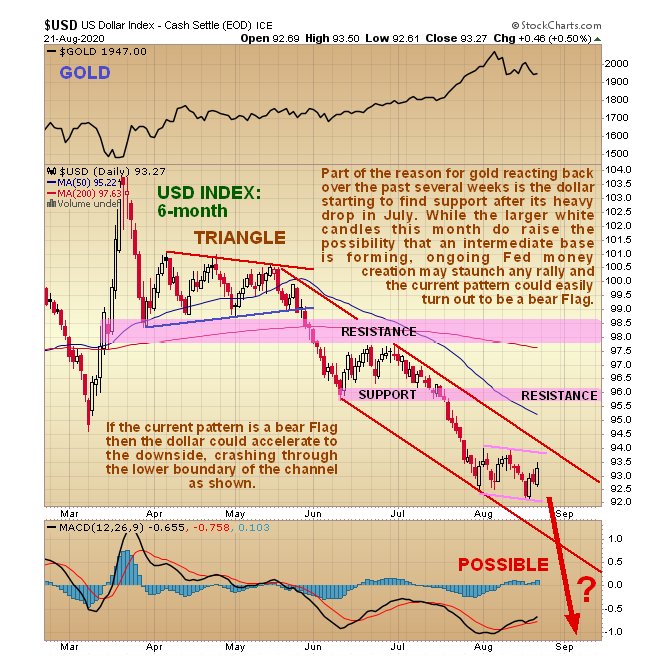
One big reason for gold backing off in recent weeks is that the dollar index has been finding some support here after its steep drop during the 2nd half of July, with some largish white candles suggesting that an intermediate base might be forming, as we can see on the latest 6-month chart for the dollar index below. However, the fundamentals for the dollar remain grim with the prospect of continuing massive money creation by the Fed, so instead of the pattern from late July being an intermediate base, what could instead be happening is that a running, or skewed, Flag is forming that could be followed by another steep drop that crashes it through the lower boundary of its downtrend. Needless to say, this would probably “light a fire” under gold.
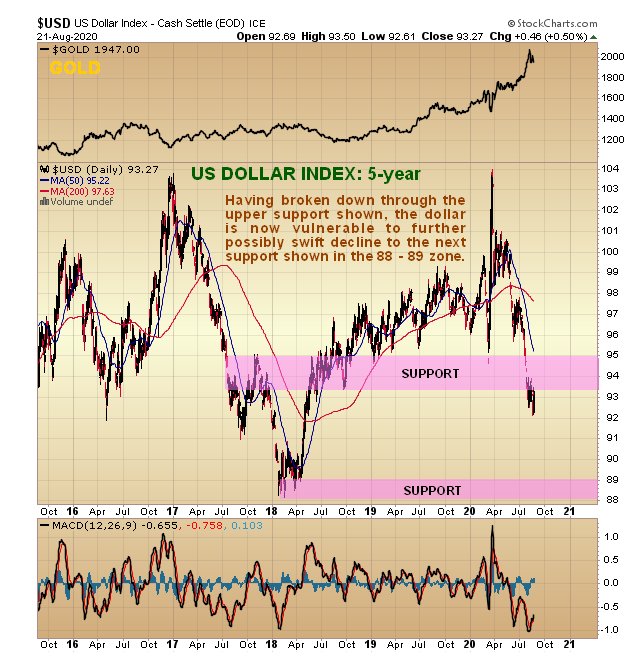
It was mentioned in the last update posted on the 19th July that a potential Flat-bottomed Broadening Formation might be completing in the dollar index, which is bearish, and that is what it now appears to be, as the index has broken down through the support level at the lower boundary of the pattern, which has weakened the dollar and created a setup where it could drop, quite possibly quickly, to the next support level shown on the chart in the 88 – 89 zone, which would energize gold to rise sharply and substantially to another new high.
End of update.