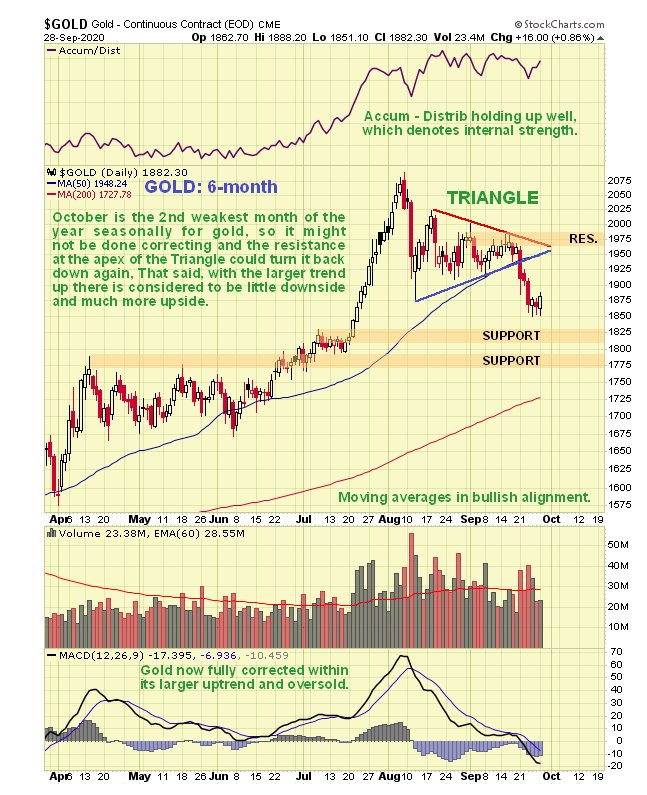
In the last Gold Market update we had thought that it might break out upside from the Triangle that was forming, mainly because of its positive Accumulation line coupled with favorable seasonal factors, but instead, after moving sideways for a while, it broke down, as we can see on its latest 6-month chart below. The good news is that no technical damage was incurred because of this breakdown, as gold is well above important support and well above its rising 200-day moving average. So the fact is that that this drop has actually improved its technical condition by completely unwinding its earlier overbought condition.
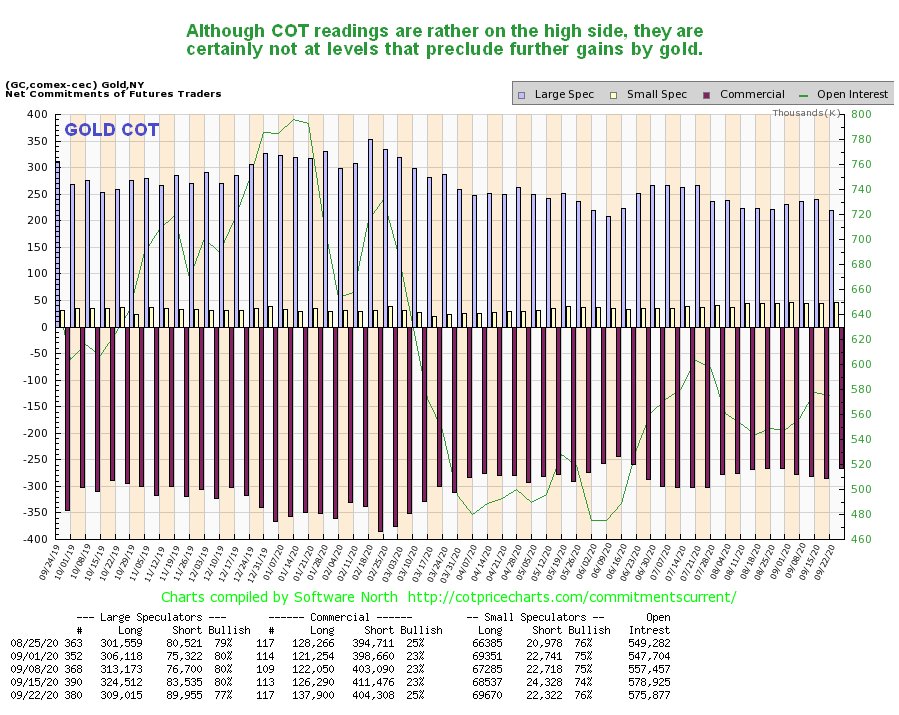
While the latest gold COT chart shows that readings are still somewhat on the high side, they are certainly not at levels that preclude another upleg…
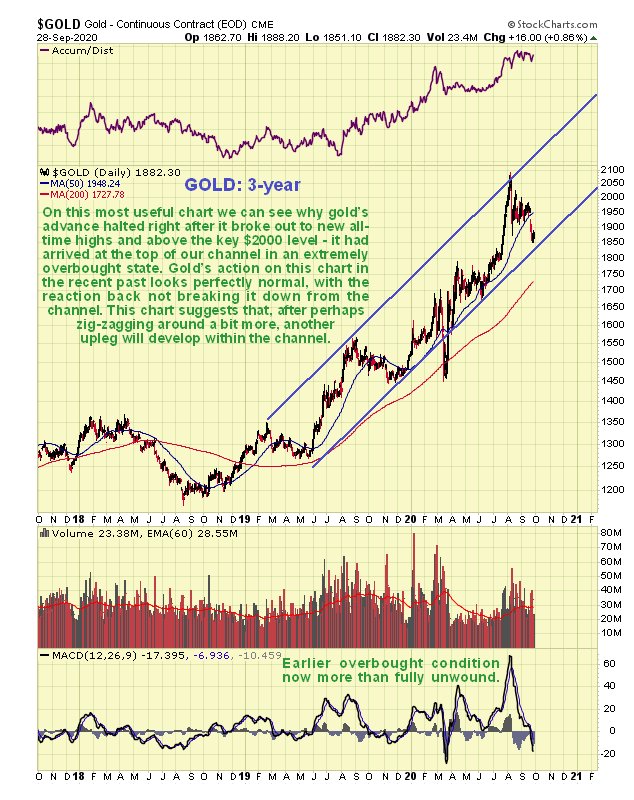
On the 3-year chart we can see why it was probably for the best that gold didn’t break out upside from its Triangle, as that would have resulted in the uptrend becoming steeper and probably unsustainably steep. Instead, we can see that it seems to want to remain in the uptrend channel that we earlier delineated. So it is interesting to observe that the break lower over the last week or two did not result in it breaking down from its uptrend channel, instead it has approached its lower boundary which is a good place for it to turn higher again, and that’s what seems to be happening.
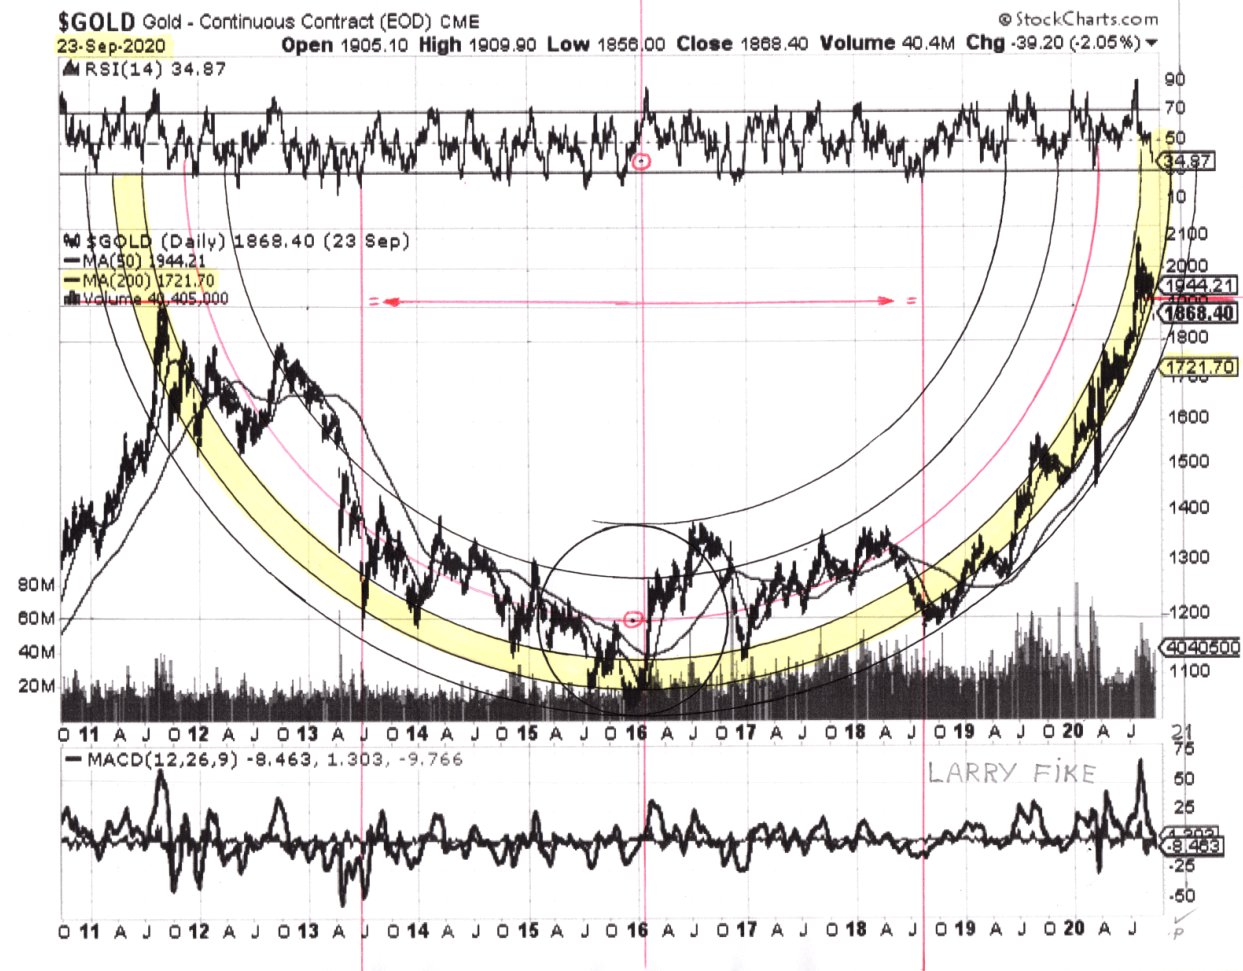
On the latest 13-year chart we can see that gold is being propelled higher rapidly by the now steeply rising right side of its Cup base that has already driven it to new highs, and as long as the Cup boundary is not breached it should continue to ascend swiftly. Given that we are in a rapidly changing economic situation with Fed money creation going exponential as they race to stave off economic implosion, this pattern could drive a spectacular vertical ascent by gold, but at the same time we take note of the fact that, should the price breach the Cup boundary, we could see a lengthy period of consolidation with a Handle forming to complement the Cup, so the pattern ends up as a classic Cup & Handle base.
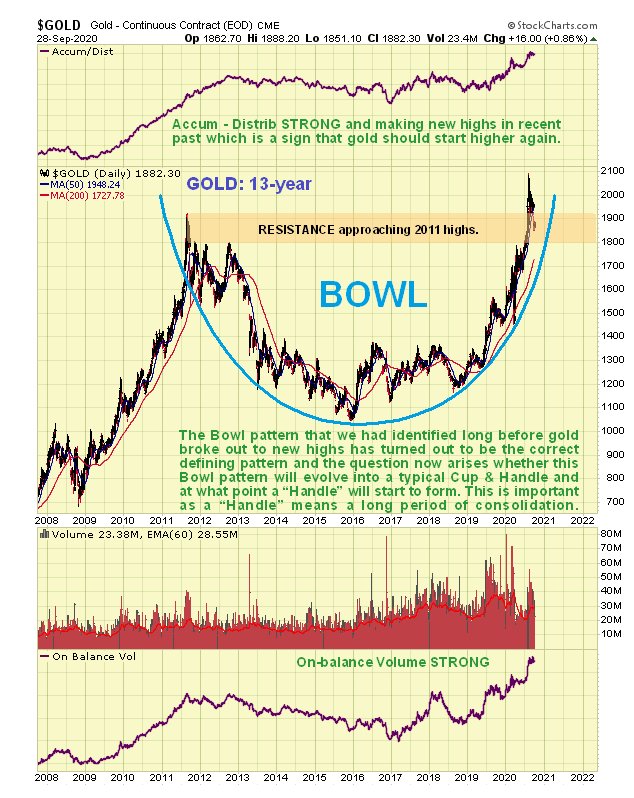
Larry’s latest gold chart suggests it will either slingshot much higher very soon, or break down from the hemispherical Bowl pattern and run off sideways for some time to form a Handle consolidation.
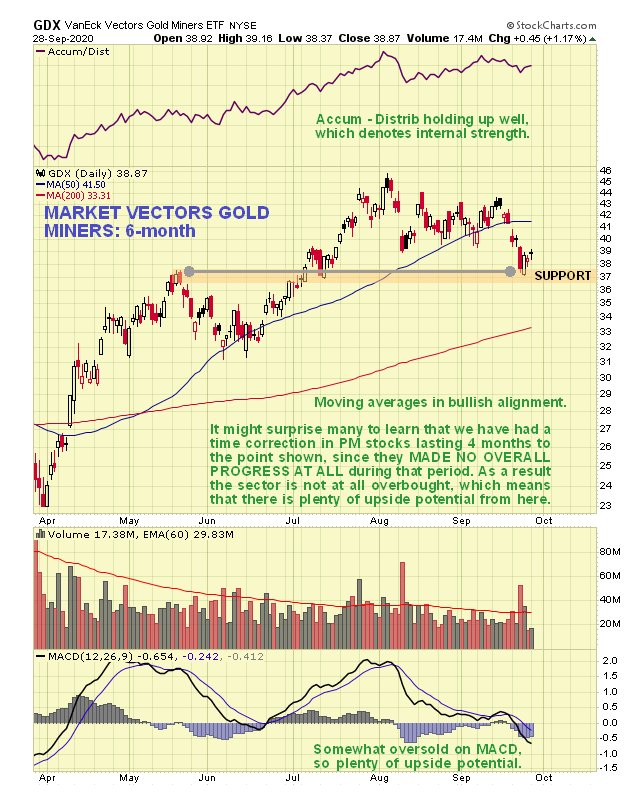
If gold looks set to take off higher again, then what about gold and silver stocks? The latest 6-month chart for GDX shows that they should too, with it looking like it is completing a corrective phase from its early August highs, and the chart looking overall positive with the Accumulation line holding up and moving averages in bullish alignment. On this chart it is interesting to observe that a time correction has been in force across the sector for 4 months now, with GDX having made no net progress from mid-May to its low a few days back. So there is now “plenty of gas in the tank” for a sizeable upleg, should it decide it wants to make one.
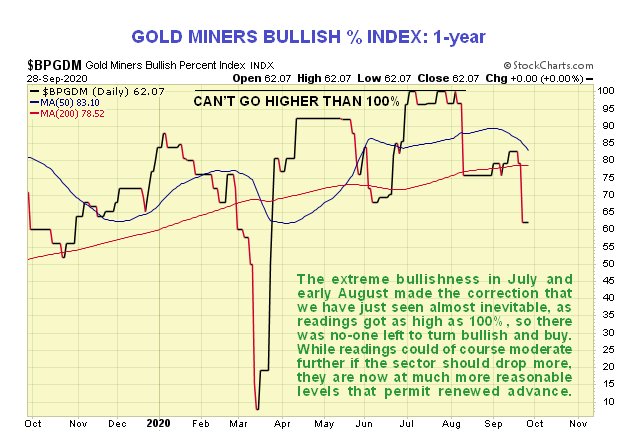
The latest Gold Miners Bullish % Index shows a considerable improvement in sentiment over the past week – far too many people had been bullish, but this has now moderated substantially, and while there is still room for improvement, this index has certainly moderated sufficiently to permit another sizeable upleg to begin.
The latest Gold Risk Levles chart shows that risk for longs has moderated greatly since its early August peak…
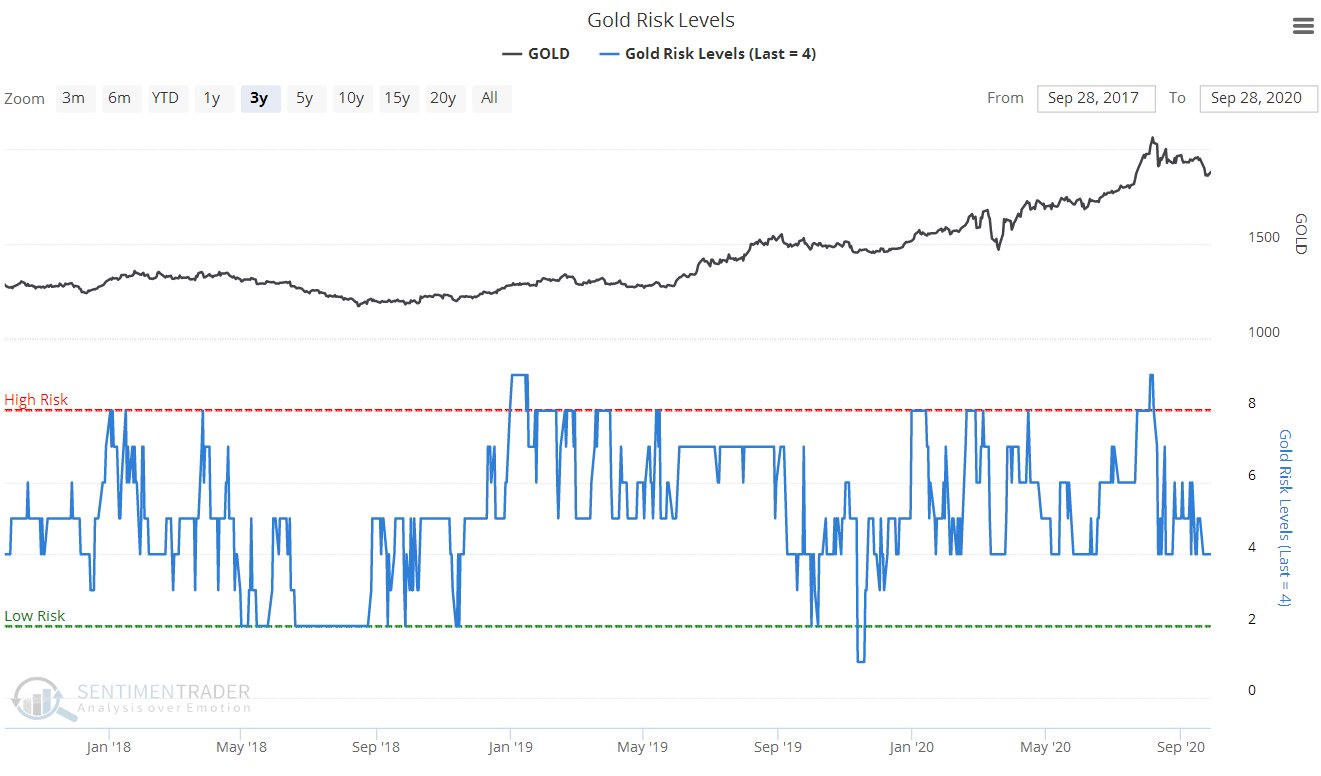
Chart courtesy of sentimentrader.com
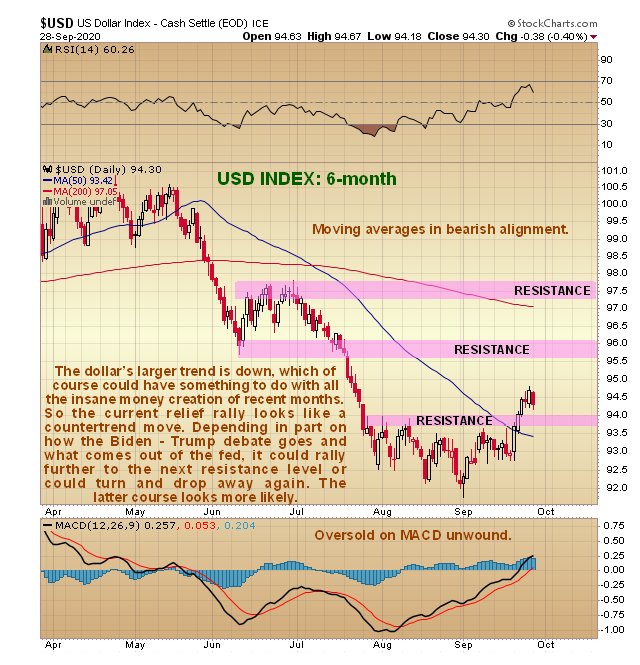
The larger trend of the dollar is down and therefore the modest rally of the past week or so is regarded as a bearmarket rally, despite it breaking above a line of resistance at 94 on the index, as we can see on its latest 6-month chart below. This “achievement” does open up the possibility of the countertrend rally running to the next significant resistance level in the 95.60 – 96 zone, although it is thought more likely that it will roll over and drop away again.
End of update.