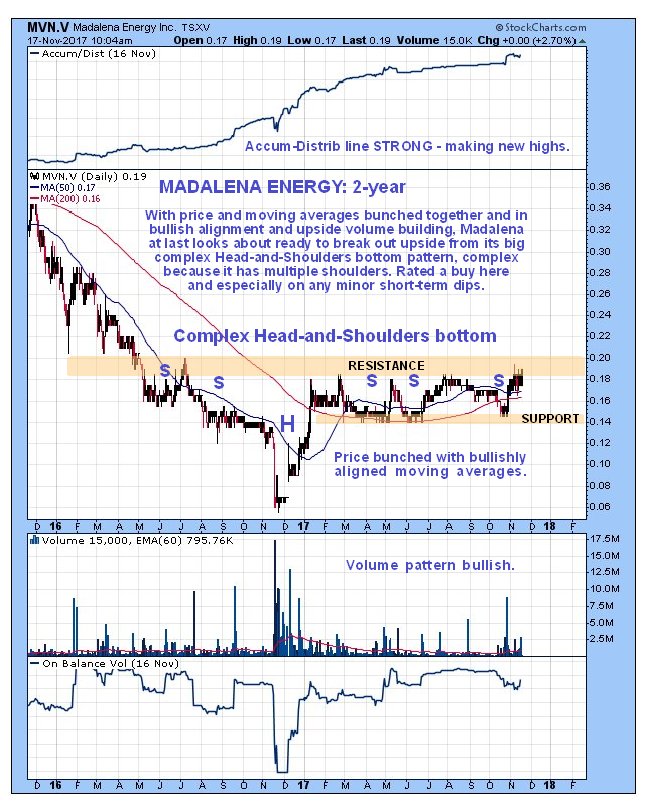
There has been rather a dearth of oil stocks on the site in the recent past, and this one is intended to redress the balance. Madalena Energy is one we should certainly keep an eye on, for as we can see on its latest 2-year chart shown below, it looks like it is readying to break out of a sizeable Head-and-Shoulders bottom. This Head-and-Shoulders bottom is labeled “complex” because it has two Left Shoulders, and, up to now, 3 Right ones, and it is highly likely that the 3rd one will prove to be the last, because the current bunching of price and bullishly aligned moving averages and the positive volume pattern suggest a high probability of an upside breakout soon. An interesting point to observe is that the current run at the resistance at the top of the pattern is the 6th and with the Accum-Distrib line continuing to advance there is a something of a “pressure cooker” effect, increasing the probability of an upside breakout, and because this resistance level has turned the price back so many times, once it does get above it we are likely to see a period of vigorous advance.
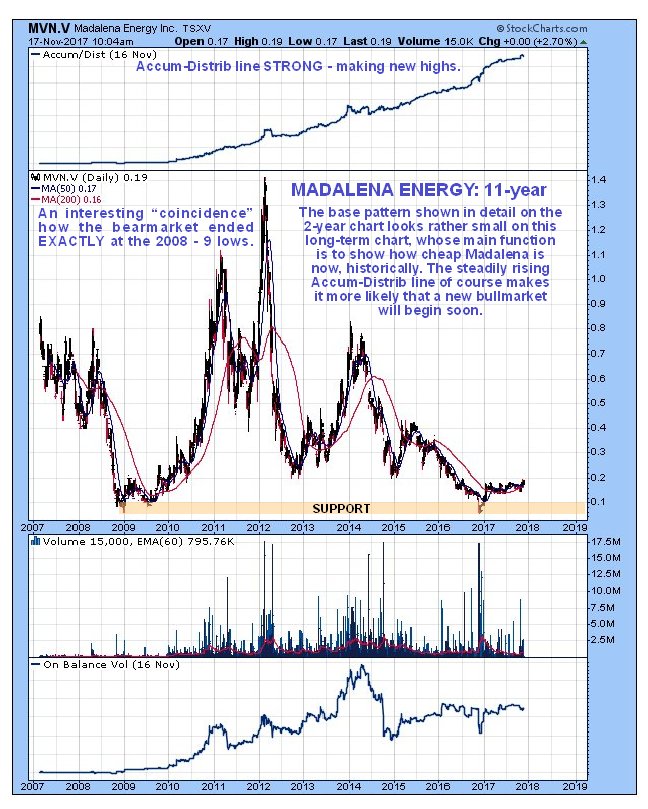
The long-term 11-year chart, which is not of much use technically, does at least provide the perspective that enables to observe several additional points. One is that, in the larger scheme of things, the base pattern is big enough, but hardly huge. Secondly, this chart really does make clear that Madalena is cheap now, on a historical basis, and finally, the steadily rising Accum-Distrib line, which looks rather more dramatic on this chart, makes it more likely that a new bullmarket will begin soon.
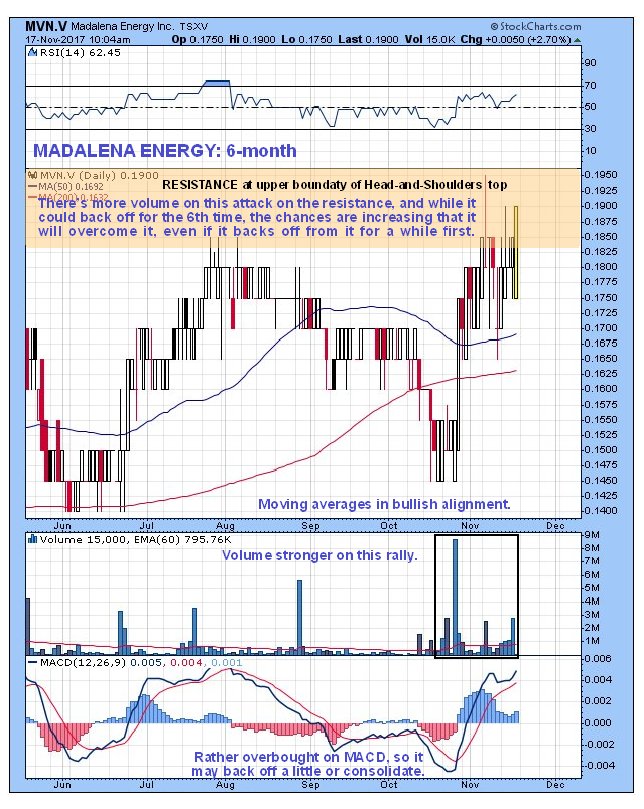
The 6-month chart enables us to see recent action in much more detail, and this chart alerts us to the possibility of a minor reaction or a period of consolidation over the short-term, as it makes clear that the price has run up sharply in recent weeks to become rather overbought. On the other hand, the stronger volume on this runup and the bullish alignment of moving averages mean that it could break above the resistance at the upper boundary of the Head-and-Shoulders bottom at any time now, and it may therefore not both to consolidate further.
 Conclusion: the chart pattern for Madalena Energy is very positive, as it appears to be readying to break out upside from a large Head-and-Shoulders bottom pattern, and we are thus thought to be at a favorable entry point here, and especially if we see a minor dip before it breaks out, which may not happen. The right tactics for those interested in this stock are to buy say half of a position right away, and the balance either on a minor dip over the short-term (1 – 3 weeks), or on a breakout above the key C$0.20 level.
 Point for a stop is C$0.13, which is admittedly a long way below, but there is support all the way down to this level. Madalena trades in adequate volumes on the US OTC market and it has a heavy 543.8 million shares in issue, but is a big company with many properties in Argentina, where the business environment is rapidly improving under President Mauricio Macri (after the disaster of the Kirchners) – the Argentinian Merval index has soared about 70% this year.
Madalena Energy
website
Madalena Energy Inc, MVN.V, MDLNF on OTC, closed at C$0.19, $0.145 on 17th November 17.
Posted at 7.05 am EST on 18th November 17.