All the pieces are falling into place for the biggest gold bullmarket in history and by the look of the long-term gold chart, it is set to start very soon. The biggest reason of course is the accelerating demise of fiat. There are many other reasons that we will be considering going forward, but the one that looks set to trigger the immediate start of the bullmarket (and has already since the move of the past 2 weeks is viewed as the initial impulse wave of this bullmarket, even though it hasn’t broken out yet) is the Fed chickening out of its “normalization” program, which was a joke anyway because
there is no way they can normalize the hopeless mess they have created. . The markets called the Fed’s bluff and they very quickly folded, establishing that they are now powerless.
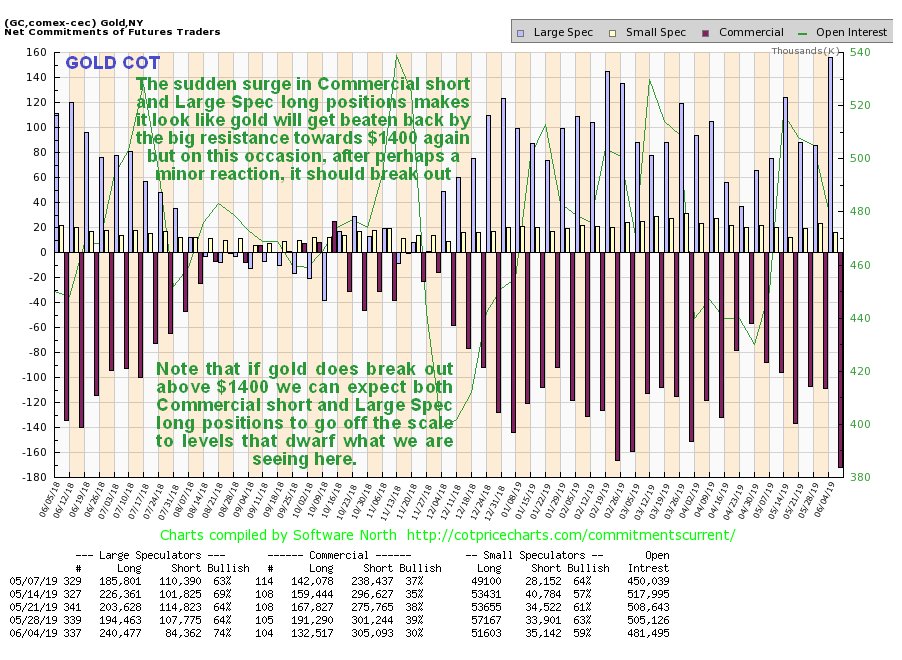
A key point to make at this juncture is that the latest COTs for gold looked bearish because there was an explosion in Commercial short and Large Sec long positions to an at least 1-year peak, which many are taking to mean that gold will fail again at the big resistance at the upper boundary of its huge base pattern. But what may instead happen this time is that gold breaks out anyway, perhaps after backing off a little first, and rockets higher, with positions ballooning to well off the scale levels, which would hardly be surprising since if gold breaks out above $1400 a huge number of investors and traders will come down off the fence and pile in. When they have reached wild extremes on a spike, then we will see a correction or at least a consolidation before the next upwave starts. We have learnt from a mistake made early in 2016 when we called the end to the strong rally in progress then off the lows of the giant complex Head-and-Shoulders pattern too early due to high Commercial short and Large Sec long positions.
The main purpose of this update is to emphasize two crucial points. One is that the sharp rally in the Precious Metals over the past 2 weeks is considered to be the start of a “breakout drive” that will soon bust gold through the key resistance towards and at $1400, a development that will probably trigger a spectacular spike. The other is that the seemingly bearish looking COTs won’t stop it – there be a minor short-term reaction but other than that gold is looking set to blast higher soon. It’s hard to see how it wouldn’t with the Fed’s reversal to dropping rates set to rip the rug out from under the dollar, and the global move to dedollarize given added urgency by the recent spate of bullying and crude threats issued to the rest of the world from the US in the form of sanctions, tariffs and possible military. The US Neocons would do well to heed the old saying “People who live in glasshouses shouldn’t throw stones” – the key to neutralizing them is to dedollarize, collapse the dollar and starve the US military – industrial complex of the torrent of foreign funds that it depends on for its power. The rest of the world knows this and, after making sure that they are able to defend themselves militarily (in the case of the major powers), are taking steps to dump the dollar and push it off its perch. This of course will be a huge driver for gold, especially as most other currencies are also in a parlous state.
Let’s now quickly review the latest most pertinent charts.
Starting with the 10-year gold chart we see that it is at last in position to break out of its gigantic 6-year long base pattern, that may be described either as a complex Head-and-Shoulders base or as a Saucer. The sharp rally of the past 2 weeks is viewed as the probable start of a “breakout drive” out of the pattern, and it will not be stopped by the seemingly bearish COT even if that triggers a modest reaction (possible because June is not a seasonally good month for the Precious Metals). However, we should not be put off by this because any such dip will be like the side of a molehill compared to Mt Everest.
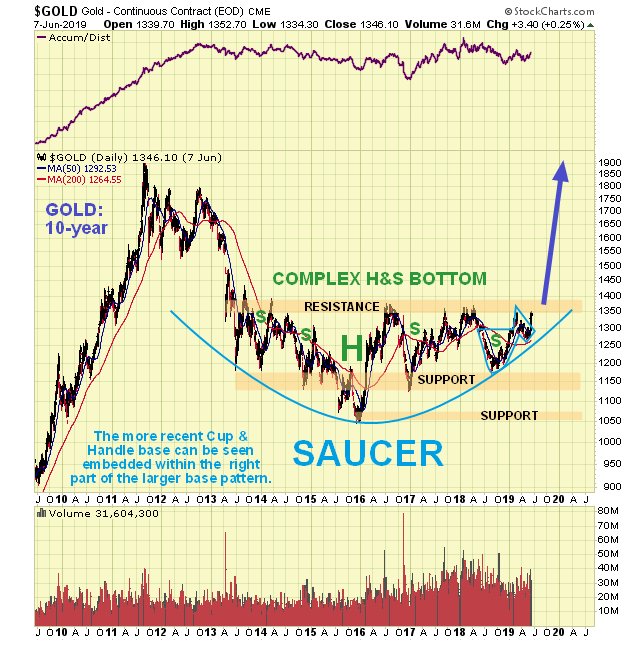
Click on chart to popup a larger, clearer version.
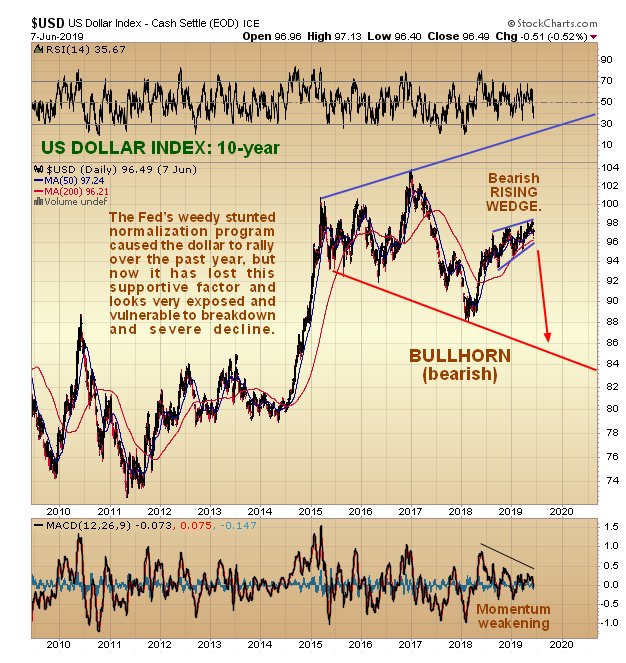
Since a dollar collapse will be a primary driver for gold, how does the dollar look? On its 10-year chart we can see that the rally of the past year or so caused by the Fed’s normalization program is fizzling out as the Fed has been backed into a corner (backed itself into a corner) and has been forced to capitulate. We are now on course for 0% interest rates or lower – think about it – what would you rather hold in a NIRP environment where banks help themselves to your cash via bail-ins, which is reality plunder, cash or gold that they can’t touch? – it’s a no-brainer.
Silver investments look most attractive at this time, as silver is still close to a rock bottom price and it tends to lag gold.
We will be expanding on the reasons for a massive bullmarket in the Precious Metals going forward.
End of update.
Posted at 12.00 noon EDT on 10th June 19.