We have already been over the reasons why a major PM sector bullmarket is starting, and remarked on how undervalued silver is compared to gold, and how this is typical at the start of a major sector bullmarket, but it is worth “thumping the table” over this, because silver and silver investments may well be the best place of all to put your money at this time.
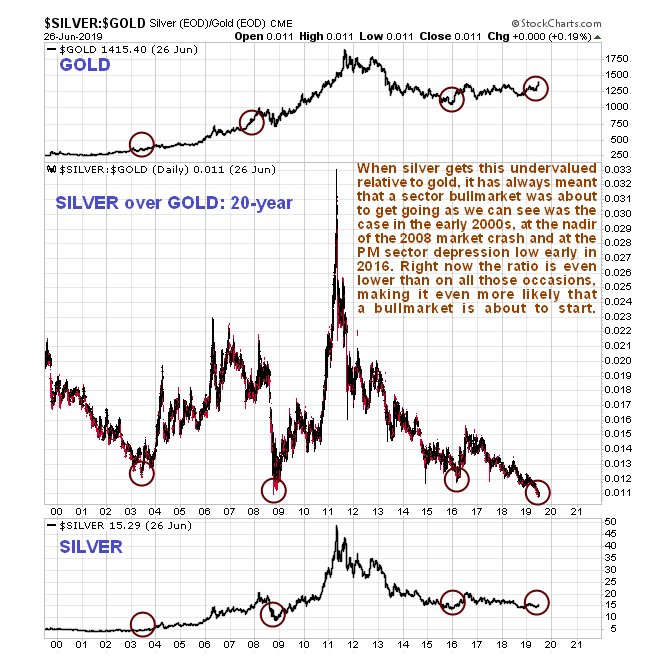
Many silver investors are manic-depressive and fanatical, which is a reality that we can turn to our advantage, for if we can figure when they are just starting to emerge from the depths of despair, it is the time to move into the sector in a big way. They are just starting to emerge form the depths of despair right now as it happens, which graphically is shown by the silver to gold ratio, the basis of which being that when investors in the sector are at their most risk averse, they tend to favor gold over silver, which is hardly surprising as gold conjures up images of solidity and security to a much greater extent than silver, which is also known as “poor man’s gold”.
It is thus most illuminating to observe a long-term 20-year chart of the silver to gold ratio, on which we see that the rare occasions on which it has dropped to the sort of extremely low levels it is now at, have always preceded a major sector bullmarket except early in 2016 which preceded a big rally. What is remarkable right now is that this ratio has even exceeded its earlier record lows, which makes a new sector bullmarket even more likely, and this indicator, just by itself, is a strong sign that this is what’s brewing.
Now to examine silver’s latest charts to see how it is shaping up.
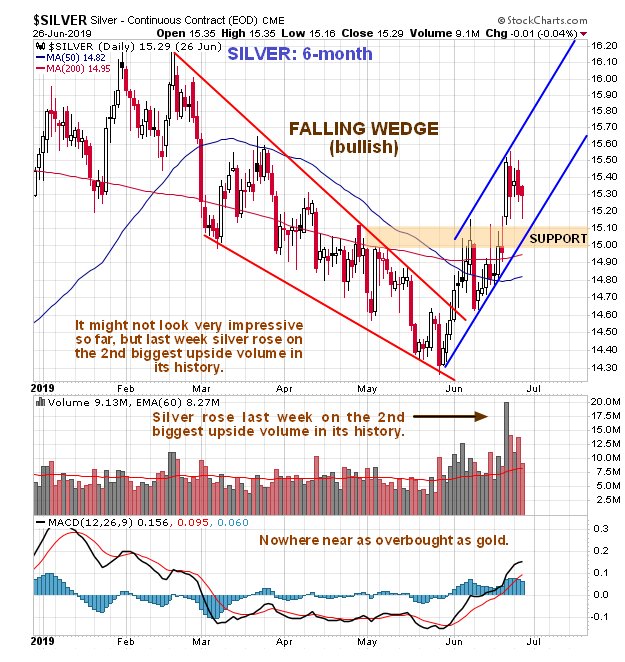
On the 6-month chart we can see that although silver has reversed, breaking out of its preceding downtrend into a new uptrend, it has still only risen by a meager $1 from its late May lows
– BIG DEAL!! Rather than being upset by this,
WE SHOULD BE THANKFUL THAT IT HASN’T RISEN MORE because otherwise silver investments would have gone through the roof. Silver’s restrained performance so far is giving us more time to buy investments across the sector before it really gets moving. An important point to note before leaving this chart is the strong volume on a big up day last week,
which was the 2nd biggest up day volume in history which is a very bullish sign.
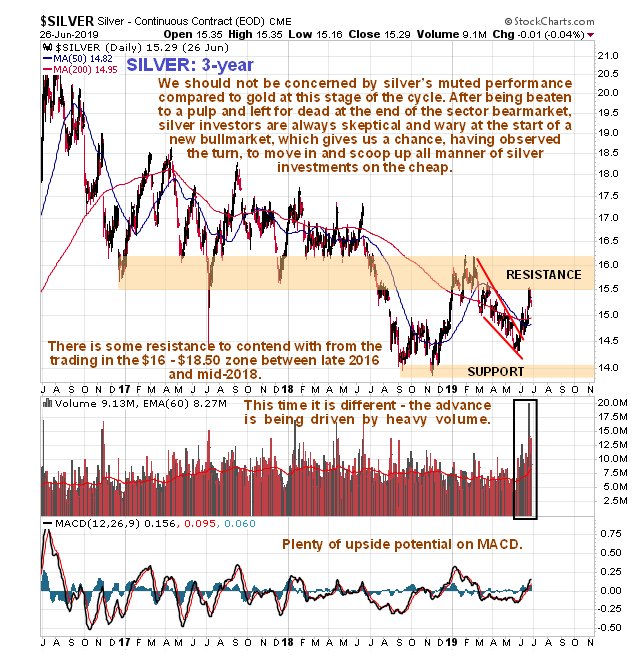
The 3-year chart shows that silver has been an especially dull market during this period, but what is interesting is to compare this chart to the 3-year chart for gold in the article
Gold’s Epochal Breakout, which looks way different and shows a massive divergence that is going to be made good by silver catching up big time at some point. Although silver’s 3-year chart still doesn’t look very inspiring, with weak price performance and an overhang of resistance between about $16 and $18.50, the volume buildup of recent weeks coupled with gold’s strong performance suggests that this resistance could be overcome a lot more quickly and easily than many would believe possible.
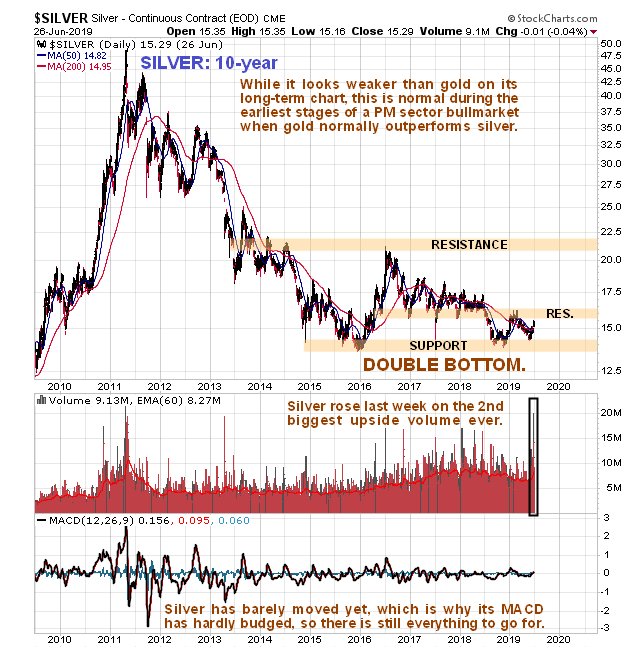
Finally, the long-term 10-year chart shows that despite gold breaking out from its giant 6-year long base pattern over the past week or so, silver is still scraping along not very far off its lows. However, this is not a situation that is expected to persist for much longer – if gold goes up it’s going to take silver with it, and the volume buildup in silver as it has risen off recent lows suggests that this rally has legs, and what is believed to be happening is that silver is just starting to rise off the 2nd low of a Double Bottom, whose 1st low occurred late in 2015 – early in 2016. If this interpretation is correct then we are at an excellent entry point here for all silver related investments.
End of update.
Posted at 2.05 pm EDT on 27th June 19.