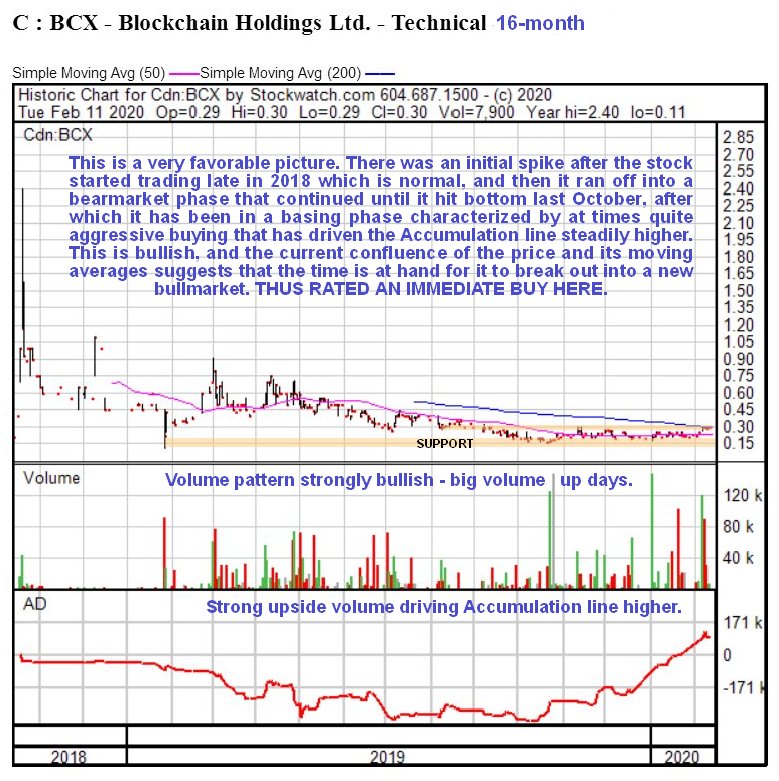
Blockchain Holdings is believed to be at the point of breakout from a base. On its 16-month chart we can see how, after it started trading late in 2018, it spiked higher before reversing into a bearmarket that in effect ended last October, although the low then wasn’t lower than the low in January 2019. Since October it has drifted sideways marking out a low base, but what is most interesting about the period from last October is that it has been characterized by a number of big volume up days that have driven the Accumulation line steadily higher. This is definitely bullish and viewed as a strong indication that the price is destined to break out of this base before much longer into a bullmarket.
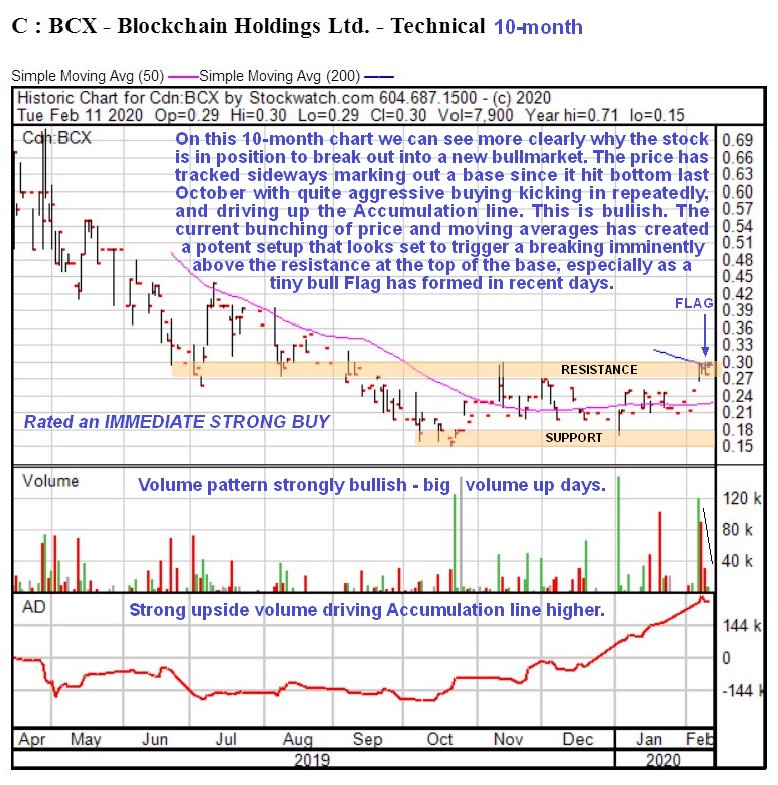
On the 10-month chart we can see recent action in more detail and in particular how the confluence of the price and its moving averages is creating a potent setup that makes a breakout to the upside much more likely soon. Thus it is interesting to observe how the price ran at the resistance at the upper boundary of the base on strong volume a few days back, and has since consolidated in what looks like a tiny Flag pattern with volume dropping back in a satisfactory manner.
This action suggests that breakout from the base pattern into a new bullmarket is imminent, and the stock is therefore rated an immediate strong speculative buy.
Blockchain Holdings
website
Blockchain Holdings Ltd, BCX.CSE, closed at C$0.30 on 11th February 20.
Posted at 6.20 am EST on 12th February 20.