Before launching the big article looking at a broad range of silver stocks, I couldn’t resist doing a “special” on this one, Kooteney Silver, because of all the silver stocks that I examined, this is the one with the strongest charts.
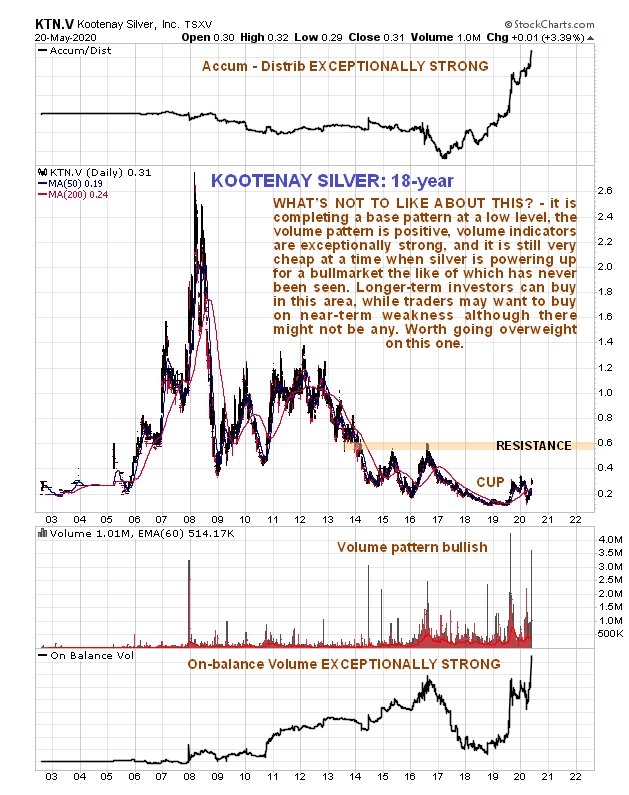
We’ll start by looking at the long-term 18-year chart on which the 1st thing to observe is that Kootenay is still very cheap here as it is still less than one-eighth of its price at its early 2008 high and less than a quarter of its price at its early 2012 high. The 2nd thing to observe is that it has been in a basing process since as far back as late 2014, even if it made new lows in late 2018 and early 2019 as it marked out the lows of a Cup pattern. Then we see it starting to climb out of the Cup during the 2nd half of last year on huge volume, which is very bullish, especially as we can see that this heavy upside volume has driven both its volume indicators strongly higher, with volume indicators continuing to surge on the recovery from stockmarket crash phase March lows of this year. This is all very bullish action indeed and the good news for us is that the price has hardly moved yet, but clearly, if silver takes off strongly higher into a major bullmarket as expected, then this has huge upside potential from here.
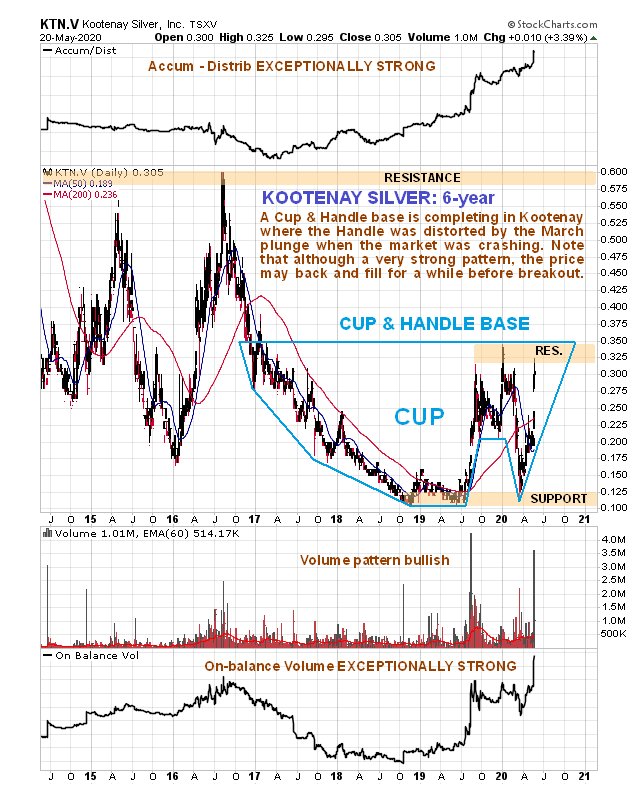
The 6-year chart enables us to see the Cup base much more clearly and to discern that all of the action from late 2016 is a big Cup & Handle base. The Handle part of the pattern got distorted from how it ought to have looked by Kooteney and other PM stocks being dragged down by the crashing stockmarket in March, so that the brief period of the low of the Handle is almost at the low of the Cup. Nevertheless it has recovered well and has become decidedly perky in recent days, ascending swiftly to challenge the resistance at the top of the entire base pattern. However, as it now very overbought, it is thought likely that it will at least pause here for a bit before it breaks out. The recent volume pattern and volume indicators are very strong indeed so we need to be careful that angling for a reaction doesn’t result in us missing it before it busts out of this base pattern and rockets higher.
On the 6-month chart we can see the very impressive action of recent days, with it gapping above a resistance level on huge volume – the 2nd highest ever – and surging towards the next resistance level at the upper boundary of the base pattern shown on the 6-year chart. Since it is now critically overbought on its RSI indicator, and getting very overbought on its MACD, it is logical to expect it to “take a breather”” here for a bit, which will allow time for its 50-day moving average to start catching up and improving moving average alignment, in common with many other silver stocks, although this is such a strong chart that we shouldn’t expect much of a reaction if at all, and as mentioned above we need to be careful that by angling for a slightly better price we don’t wind up “missing the boat”.
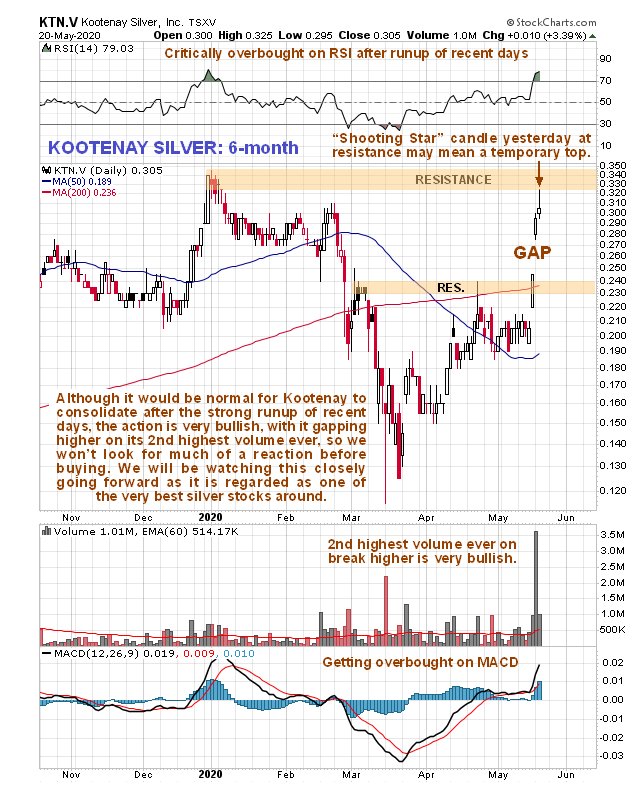 Conclusion: Kooteney Silver is regarded as one of the most promising silver stocks around, with an exceptionally strong chart and big upside potential from here. This being so longer-term investors may want to buy it immediately since any reaction over the short to medium-term is likely to be minor. More aggressive traders may want to angle for a reaction before buying, especially as yesterday’s “shooting star” candle at resistance normally marks a short-term top. We will be looking to really jump on it on any reaction.
 Kootenay trades in good volumes on the US OTC market. The number of shares in issue is on the high side at 287 million, but this is believed to be factored into the price and the company has a wide range of properties.
Kooteney Silver website
Kooteney Silver Inc. KTN.V, KOOYF on OTC, closed at C$0.305, $0.224 on 20th May 20.
Posted at 8.50 am EDT on 21st May 20.