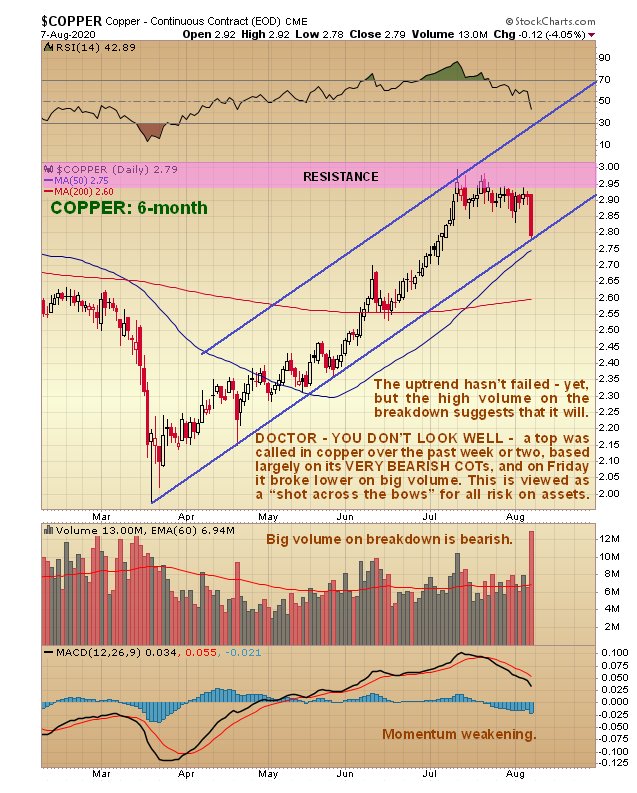
A lot happened on Friday so we are going to review a range of charts in this update. We’ll start with copper, because it broke down hard on Friday, which we had expected because of its increasingly bearish COTs for several weeks, and this has negative implications for “risk on” assets as a whole. On its latest 6-month chart we can see that the breakdown followed its trading sideways for nearly a month beneath a zone of heavy resistance. We can also see that Friday’s drop did not break it down from the uptrend shown, but the negative COT and very heavy volume on the breakdown suggest that it won’t be long before this uptrend fails. Copper isn’t called Dr Copper for nothing – when it drops it has negative implications for the economy and markets generally.
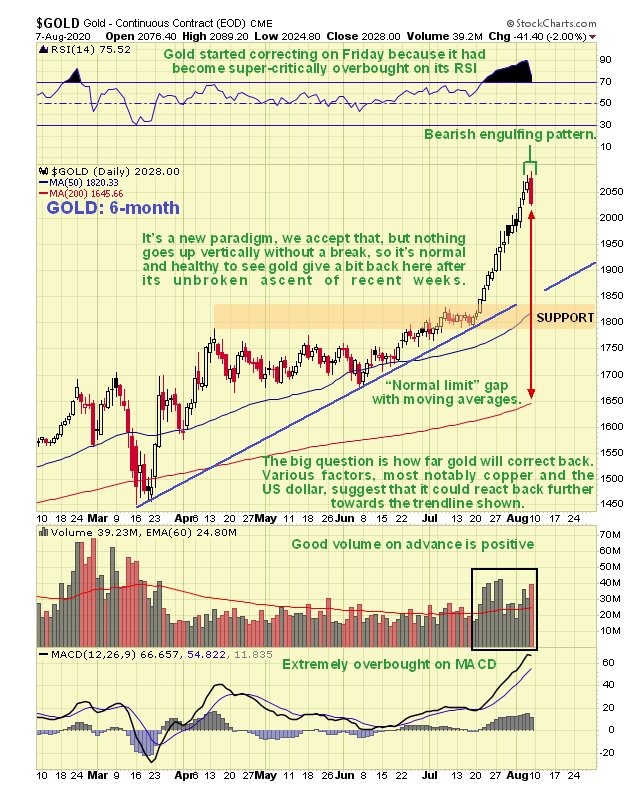
Moving on to gold we see that it also dropped quite hard on Friday, which is hardly surprising as it had been rising steadily and steeply for about 3 weeks to become super-critically overbought on its RSI indicator. The question now is whether it will turn back up again or continue to correct back for a while. The action in copper and other metals like silver and also in the dollar suggests that it will now correct for a while, perhaps for several weeks. A small “bearish engulfing pattern” appeared on gold’s chart at the end of the week which also suggests that we are entering correction mode.
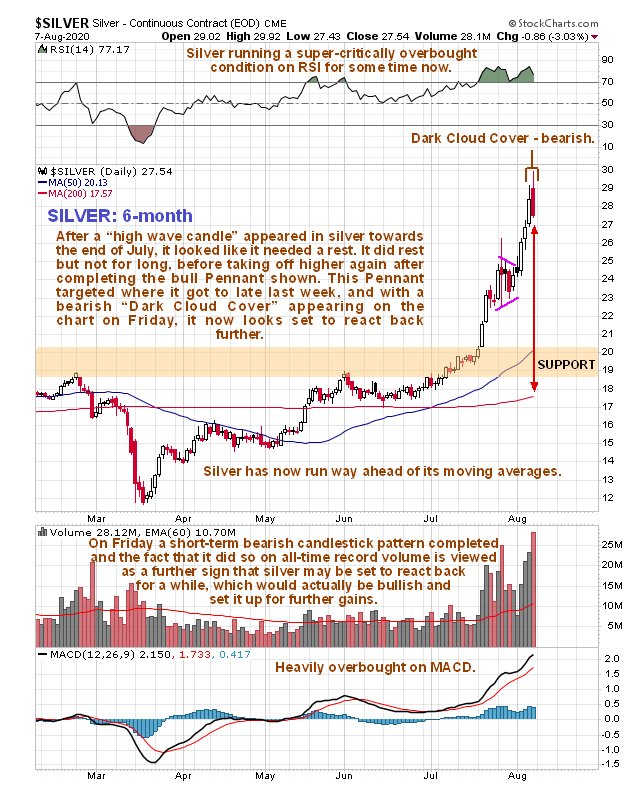
After a stellar rise, silver reached a target presaged by a small bull Pennant where it reversed hard on Friday on all-time record volume, which is viewed as a serious warning that it has probably just burned out for a while, especially as a bearish “dark cloud cover” 2-day candlestick pattern completed on Friday. Again, this should hardly come as a surprise as silver has been super-critically overbought on its RSI indicator for a while and has run way ahead of its 200-day moving average with a near-vertical spike.
We took profits in a gold and a silver stock early on Thursday morning, suspecting that may have peaked and got out at very good prices, although it remains to be seen whether they will continue to react back from here.
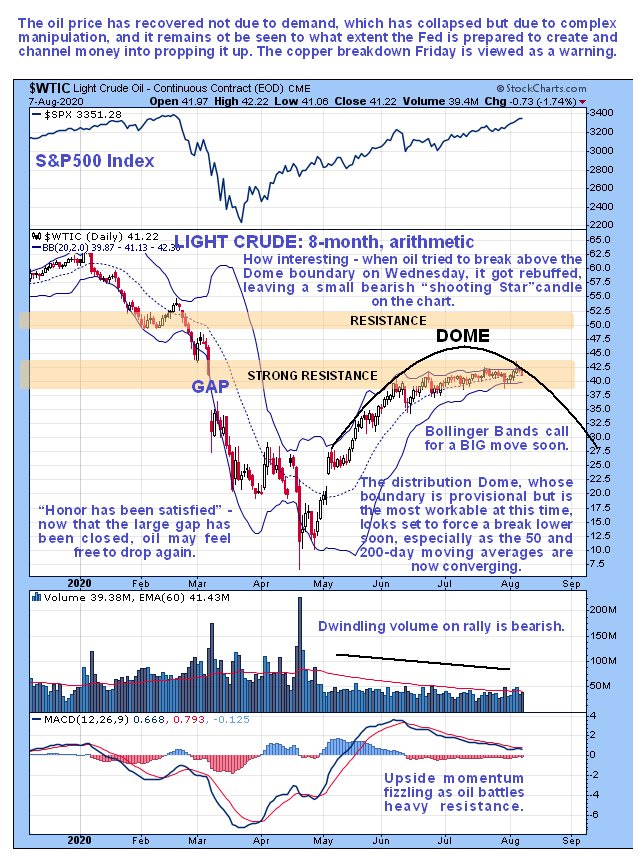
What about oil? – we have observed for a while that Light Crude has been trundling sideways in an increasingly narrow range beneath a zone of resistance and its falling 200-day moving average (not shown on chart below), which is a potentially very bearish setup, even if we know that the Fed is trying to keep it propped up. Oil’s recovery from its April lows is viewed as being almost entirely due to manipulation and price fixing etc., as there are a lot of vested interests that are dependent on a higher oil price – it is certainly not due to demand, which has collapsed, although it may in part be due to misplaced optimism about a return to normal, which is not going to happen. On our chart we can see an extraordinarily tight pinching in of the Bollinger Bands such as normally precedes a big move, and after what copper did on Friday, and taking into account a likely 2nd wave of the virus (or is it 3rd?) leading to increased lockdowns, it still seems likely that it will break to the downside. Interestingly, it tried to break out above the Dome distribution pattern shown on our chart on Wednesday, but got rudely repelled and closed with a small but bearish “shooting star” candle which can be seen to advantage on a 3-month chart. Absent vigorous Fed pumping it therefore looks like it could soon be “sent packing”.
With the commodities that we have just reviewed looking toppy, it follows that the dollar should be starting to look up, at least temporarily, and as we will now see it is. Thanks to the Fed’s manic money creation of the past several months, the world is now very negative on the dollar and with good reason. However, this negativity has reached the sort of extremes that can trigger a sudden short squeeze, which would obviously be expected to knock the metals back down some (hopefully providing us with a nice buy spot to build positions further). On its latest 6-month chart we can see that just over a week ago, it hit a target in an extremely overbought state at its downtrend channel boundary. Since then it has chopped sideways with a couple of larger and thus bullish looking white candles appearing and the extremely negative sentiment towards the dollar and its lopsided COT structure makes it more likely that the pattern of the past week or so is an intermediate base that will lead to a short squeeze rally.
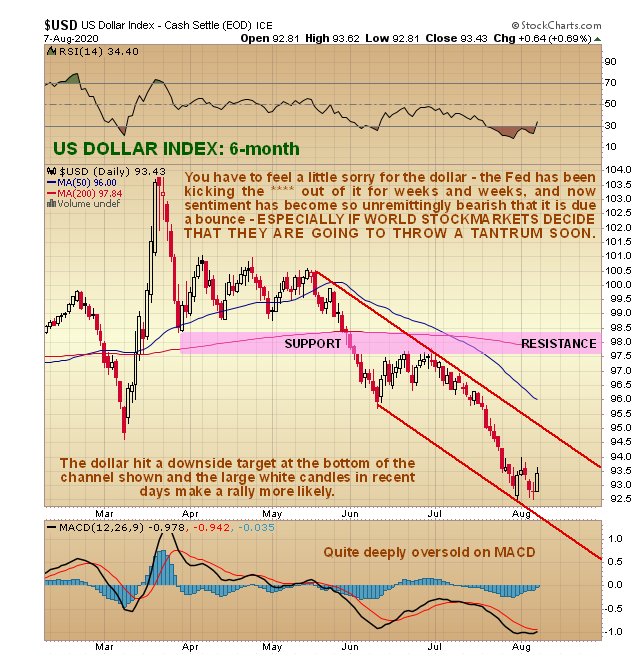
The dollar’s latest COTs show readings at levels that typically in the past have led to a rally.
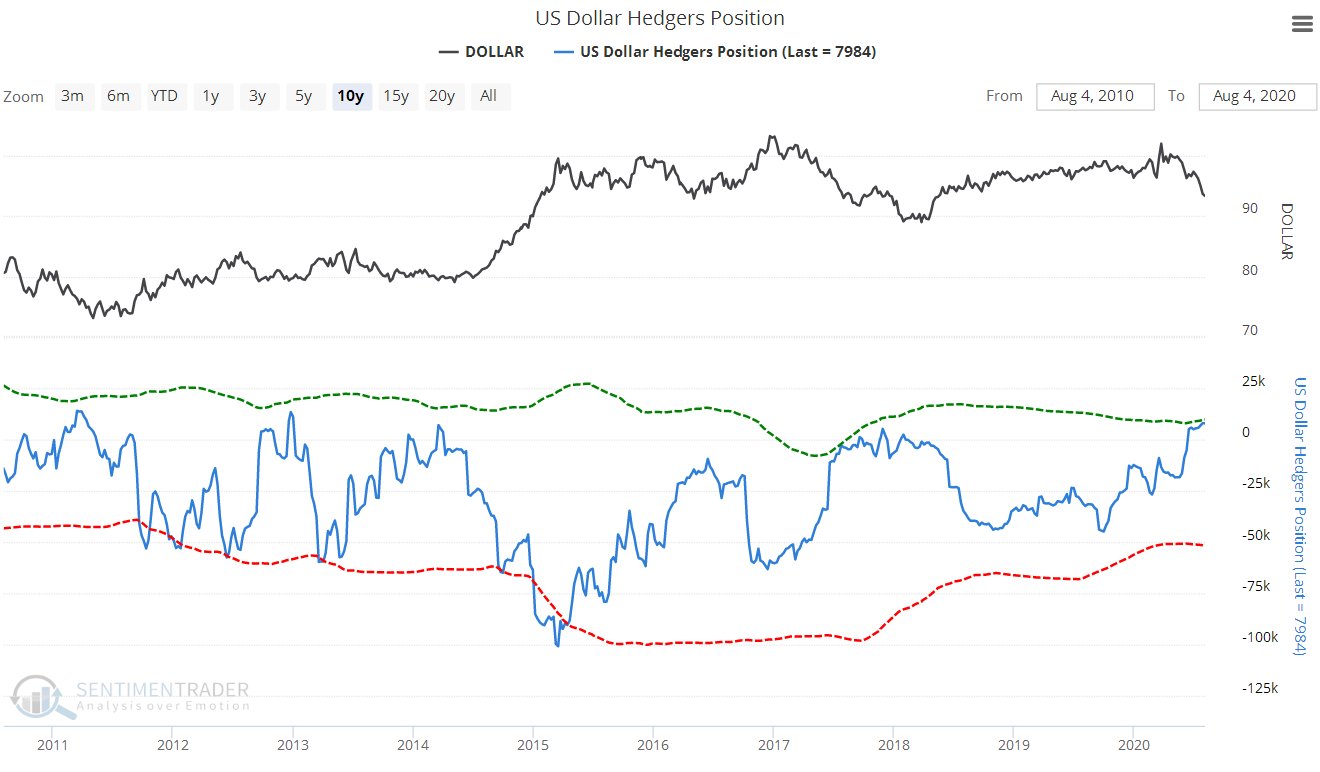 Chart courtesy of sentimentrader.com
The dollar optix or optimism levels have been plumbing extremely low levels that make a snapback rally soon more likely…
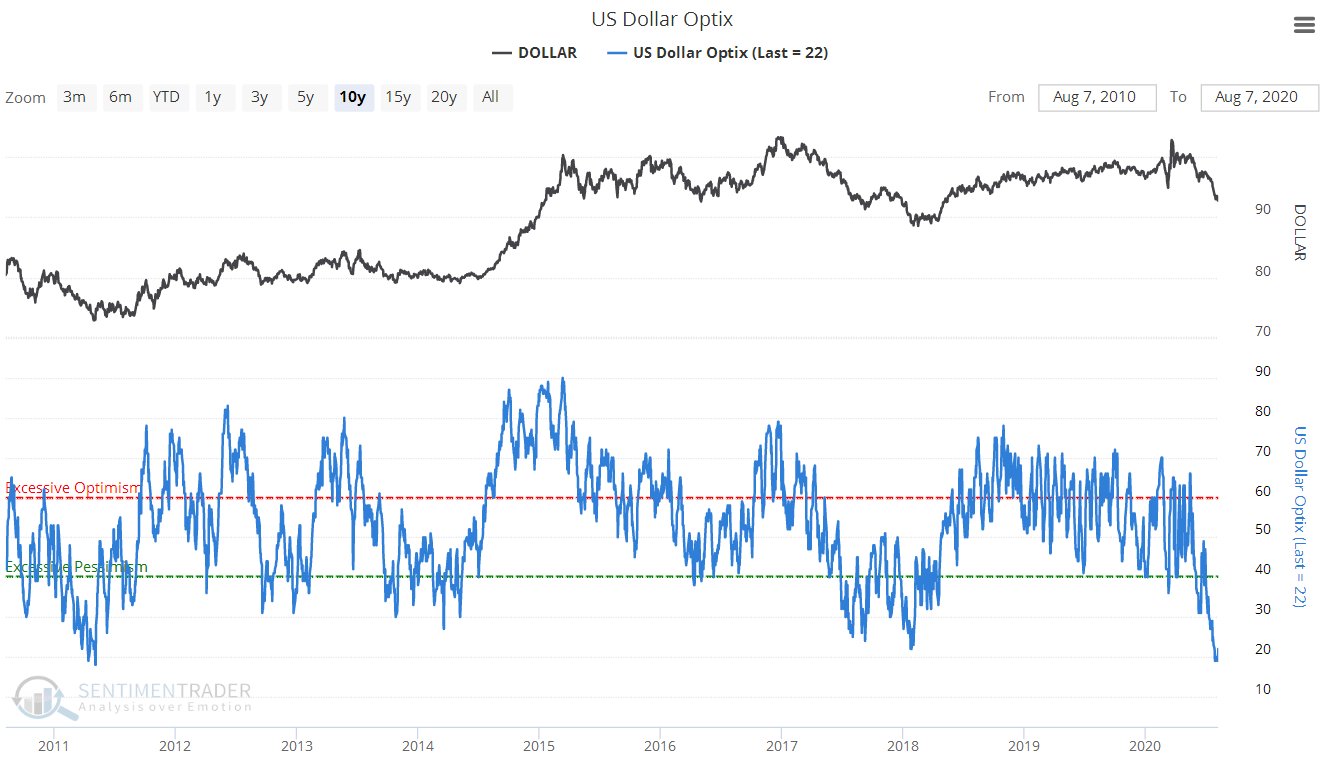 Chart courtesy of sentimentrader.com
Finally we will turn to the stockmarket, which Trump considers to be the “shop window” of his Presidency. The trouble is that the real powers want rid of him, and having failed to get him kicked out or completely discredited with their various campaigns like the Russiagate hoax, they have had to settle for hobbling him and obstructing him as much as possible so that he now comes across as a broken and resigned man, but having observed how much he “hitches his wagon” to the stockmarket they may decide to crash the markets in order to expedite his removal. The question is the timing. With respect to creating a 2nd downwave we have already observed how the Fed and Wall St banks might seek to do this in order to fleece yet again what is left of the middle class, following the little guy and the Robinhood traders etc. all piling in again in the recent past – crash the markets again and then mop all the little guys’ holdings at the bottom, and if the timing is right Trump will have too small a window to repair the damage before the election. If they are going to do this one suspects that the optimum time would be in September, but there would likely be a lead in time before the plunge, that could see markets start to crumble this month.
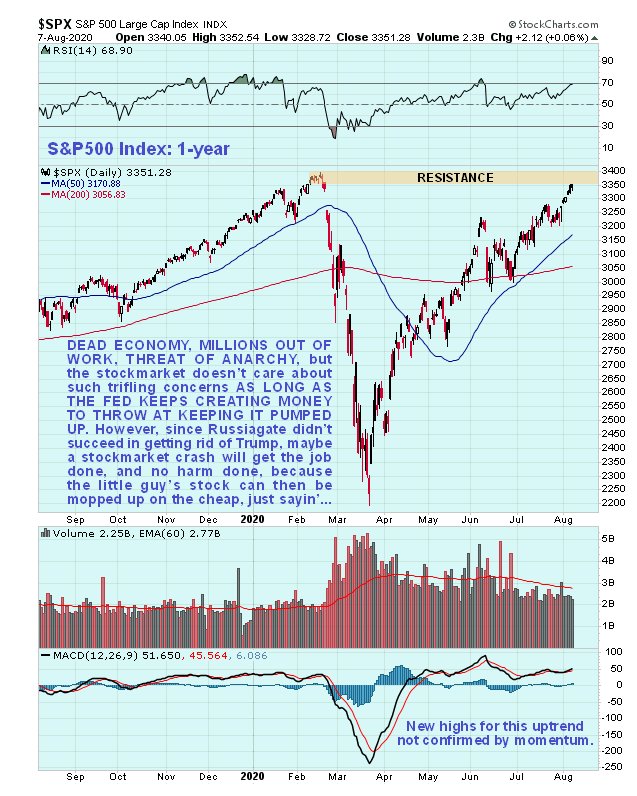
The stockmarket may fairly be regarded as a “wealth transfer engine” that serves to drain the wealth of the lower and middle classes into the coffers of the elites and super wealthy, and the way it works couldn’t be simpler. The Fed creates vast quantities of money which it gifts to itself and to its favored large corporations and crony associates etc. and by means of direct buying and through the Wall St banks it bids up the stockmarket, which benefits the super wealthy most of all simply because they own most of the stock. The tab for all this is passed to the little guy through higher inflation down the road, which reduces the purchasing power of his meager income. Now, you might say, if that’s the case, why would they crash the stockmarket – don’t they want it to go ever higher and higher for the benefit of the super wealthy? – the point to understand here is that it is a temporary flush that achieves 2 objectives; the 1st is to force the little guy to disgorge his holdings at the bottom before they create more money to ramp the market back up again, and the 2nd is that they can then justify more money creation on a vast scale in order to “rescue” the economy, like they did to great fanfare in March. This is what makes another downwave a big danger soon, despite the Fed having the ability to create trillions more to drive it higher and higher without much of a pause, and here’s a key point – if the markets do cave in soon, everything will get taken down as in February and March, and for similar reasons.
We will be watching carefully to see how all this unfolds going forward, and know how to play it if the markets do start to crumble, either hedging with options and selected leveraged ETFs, or allowing ourselves to be stopped out and then capitalizing on any such drop with bear plays like Puts, standing ready to wade in at the bottom, or just before in the case of the PMs, to scoop up a range of the better stocks at great prices, because if we do see another panic low soon the scale of Fed intervention on this occasion will be gigantic, dwarfing anything that has come before, and will quickly lead to PM sector investments doing a moonshot.
End of update.
Posted at 12.30 pm on 9th August 20.