I got the idea to write about New Found Gold now as a result of seeing
a new article by Bob Moriarty of 321gold which looked at it and also at West Red Lake Gold. On checking the latest chart for New Found Gold, I saw that it is at a great “buy spot” right now. While West Red Lake is also at support and will probably go up too, I’m not quite so keen on it because of its still weak Accumulation line, but this could soon change.
New Found Gold has made the biggest gold discovery of the past 20 years at it Queensway property in Newfoundland and that surely must work to its advantage as gold embarks on its biggest ever bullmarket, and most importantly from our point of view, it will work to the great advantage of its shareholders. The name of the company is of course a play on them making a big new find in a place called Newfoundland.
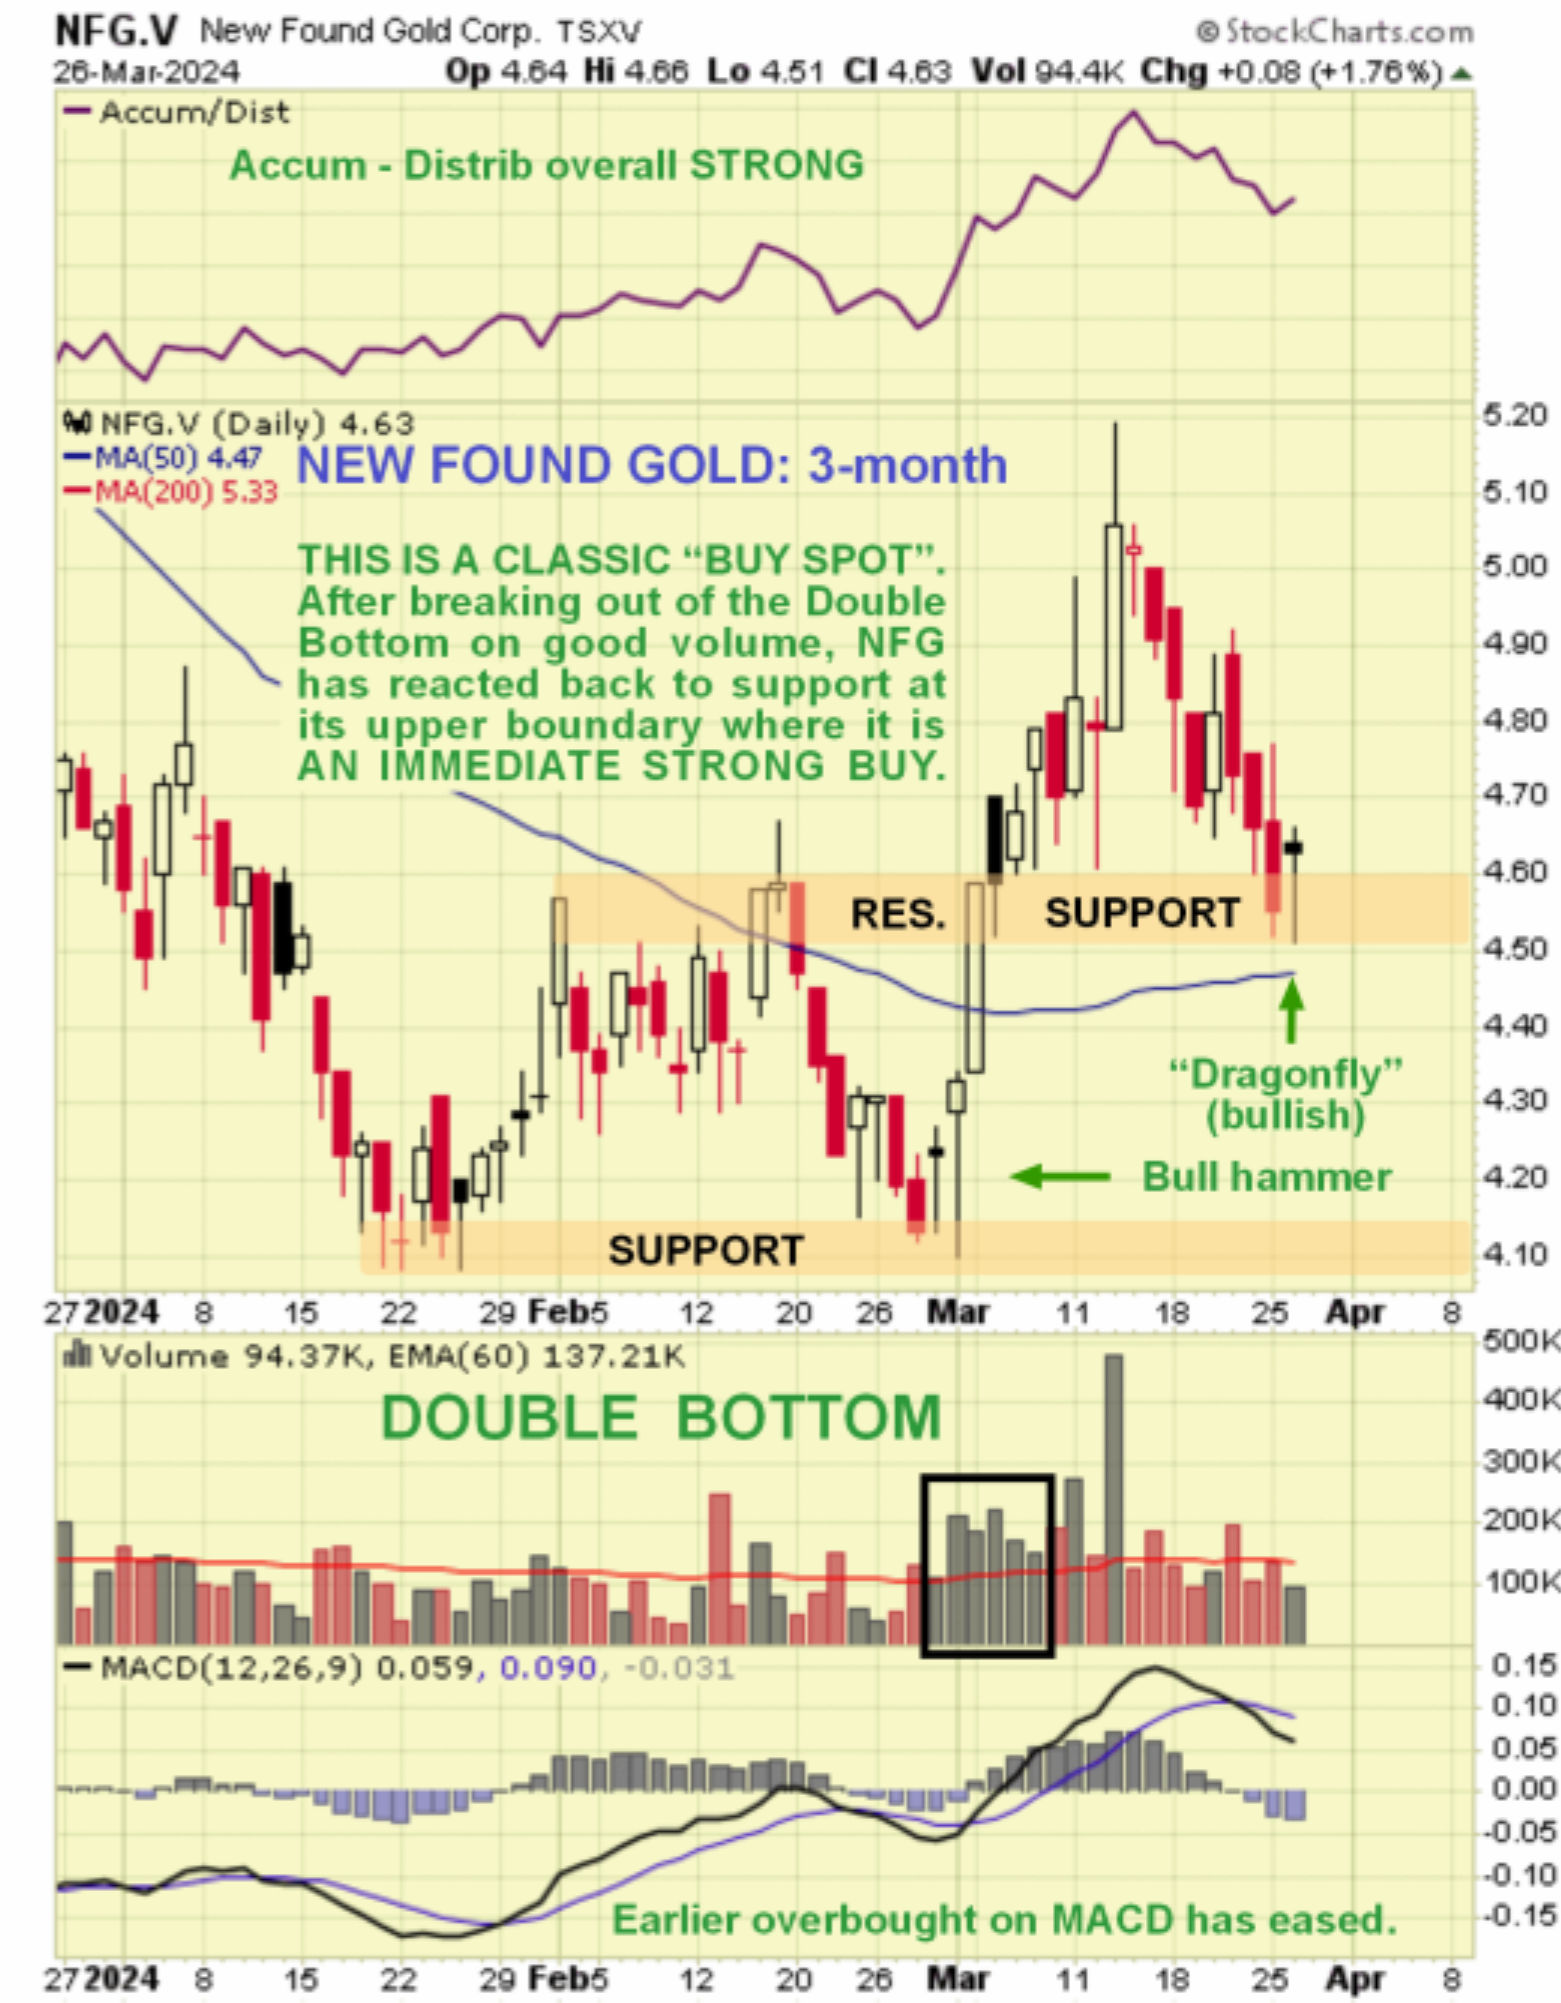
We ‘ll start by looking at the short-term 3-month chart which shows to advantage how New Found Gold broke out of a fine Double Bottom early this month, but after running up briskly for a week or two it then had a normal post-breakout reaction back to the support at the upper boundary of the base pattern and to a point above its now rising 50-day moving average, which means that it is now at a perfect “buy spot” ahead of renewed advance.

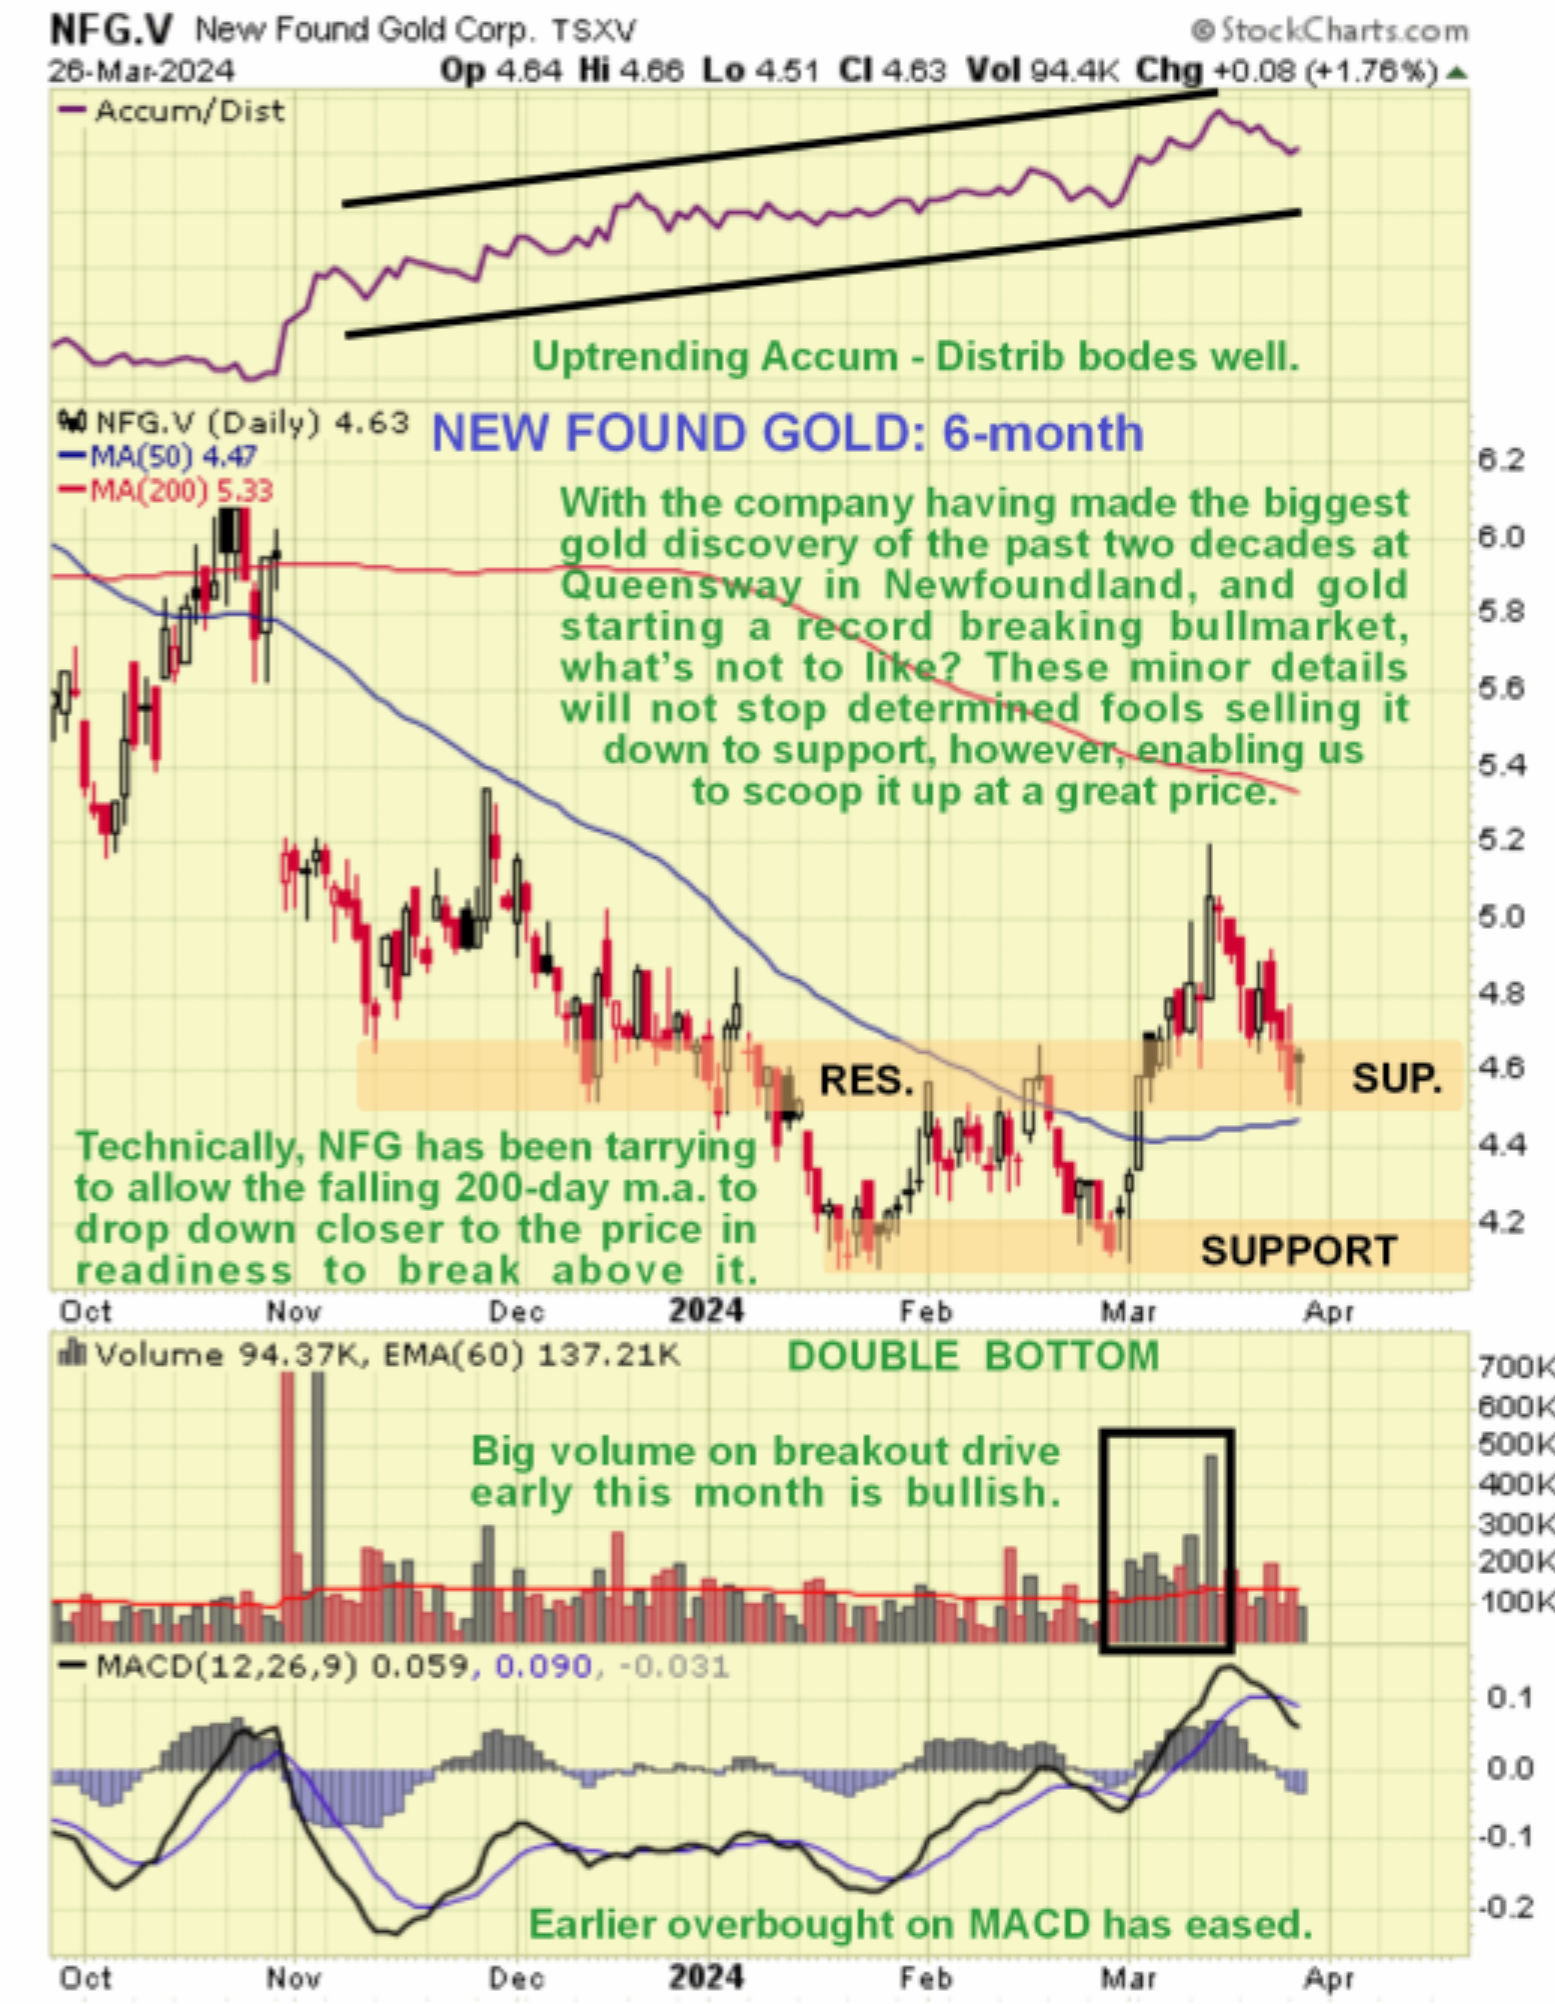
Zooming out now via the 6-month chart we see that there was quite a drop late last year and in January leading into the 1st low of the Double Bottom. On this chart we can also see how the Accumulation line has been trending quite strongly higher since late October which is a bullish divergence that calls for a reversal – and now we have it. We can also see why the stock has been taking its time getting moving – it’s because the 200-day moving average is falling and still quite a long way overhead, although with the 50-day now rising this gap is closing and the more it does, the more likely it is that the stock breaks above it and given the now very favorable outlook for gold, that could happen soon. Note also the strong volume on the breakout from the Double Bottom which is bullish.

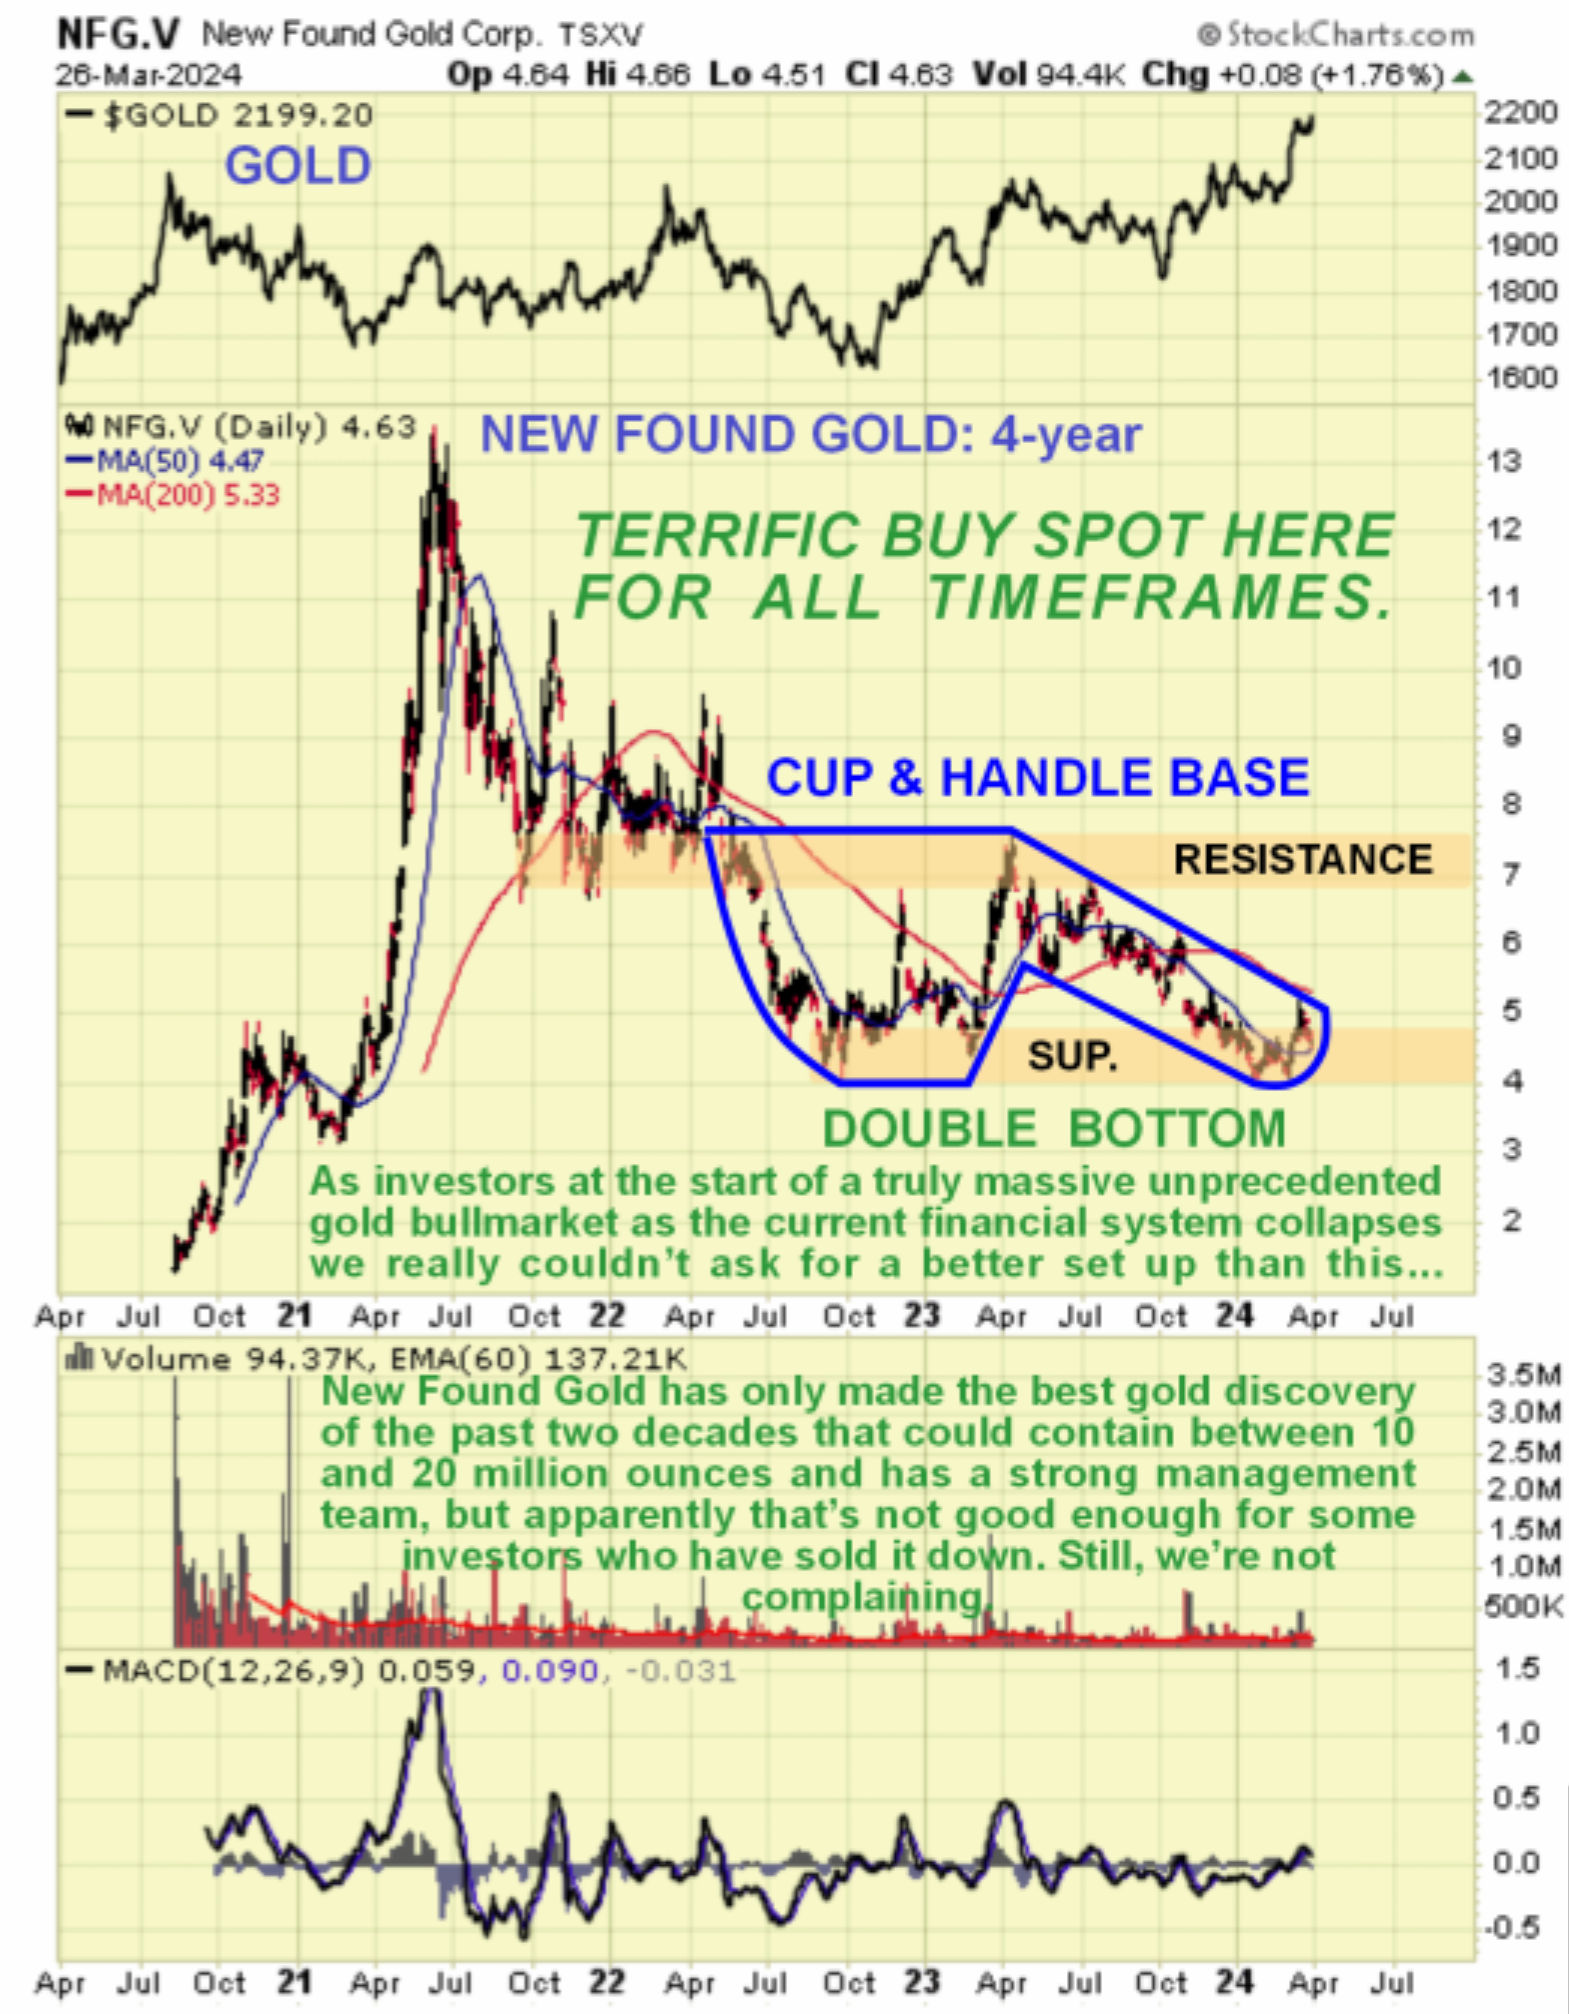
The 4-year chart provides “Big Picture” perspective on what is going on. On this chart we see that we couldn’t ask for a better setup. It is amazing given the magnitude of the company’s main asset and where gold is (gold is shown at the top of this chart) that it is still possible to pick the stock up at the current silly price, which is not expected to last for much longer. For we see that New Found Gold is in the latest stage of a large base pattern that started to form back in mid-2022. This base pattern is a hybrid that is both a Cup & Handle base and a Double Bottom at the same time. But whichever you prefer to think of it as, it looks very ready to break out of the entire base pattern into a major bullmarket and since it is still very close to its lowest price of the past several years, it is viewed as a great bargain here.
 New Found Gold is thus rated a strong buy for all timeframes and it is not considered to be speculative.
 It is regarded as a great mid-cap addition to a PM sector portfolio. There are 187 million shares in issue which might be considered to be on the high side, but is not when you think of the magnitude of the company’s main asset and in any event, of these, Palisades Gold owns 30% with a further 20% being owned by Eric Sprott. The shares trade in robust volumes on the US OTC market. The following picture, lifted from
the company’s latest Investor Deck, lets you know that you are in good company if you own this stock.

New Found Gold
website
New Found Gold Corp., NFG.V, NFGC, closed at C$4.63, $3.36 on 26th March 24.
Posted at 7.35 am EDT on 27th March 24.


