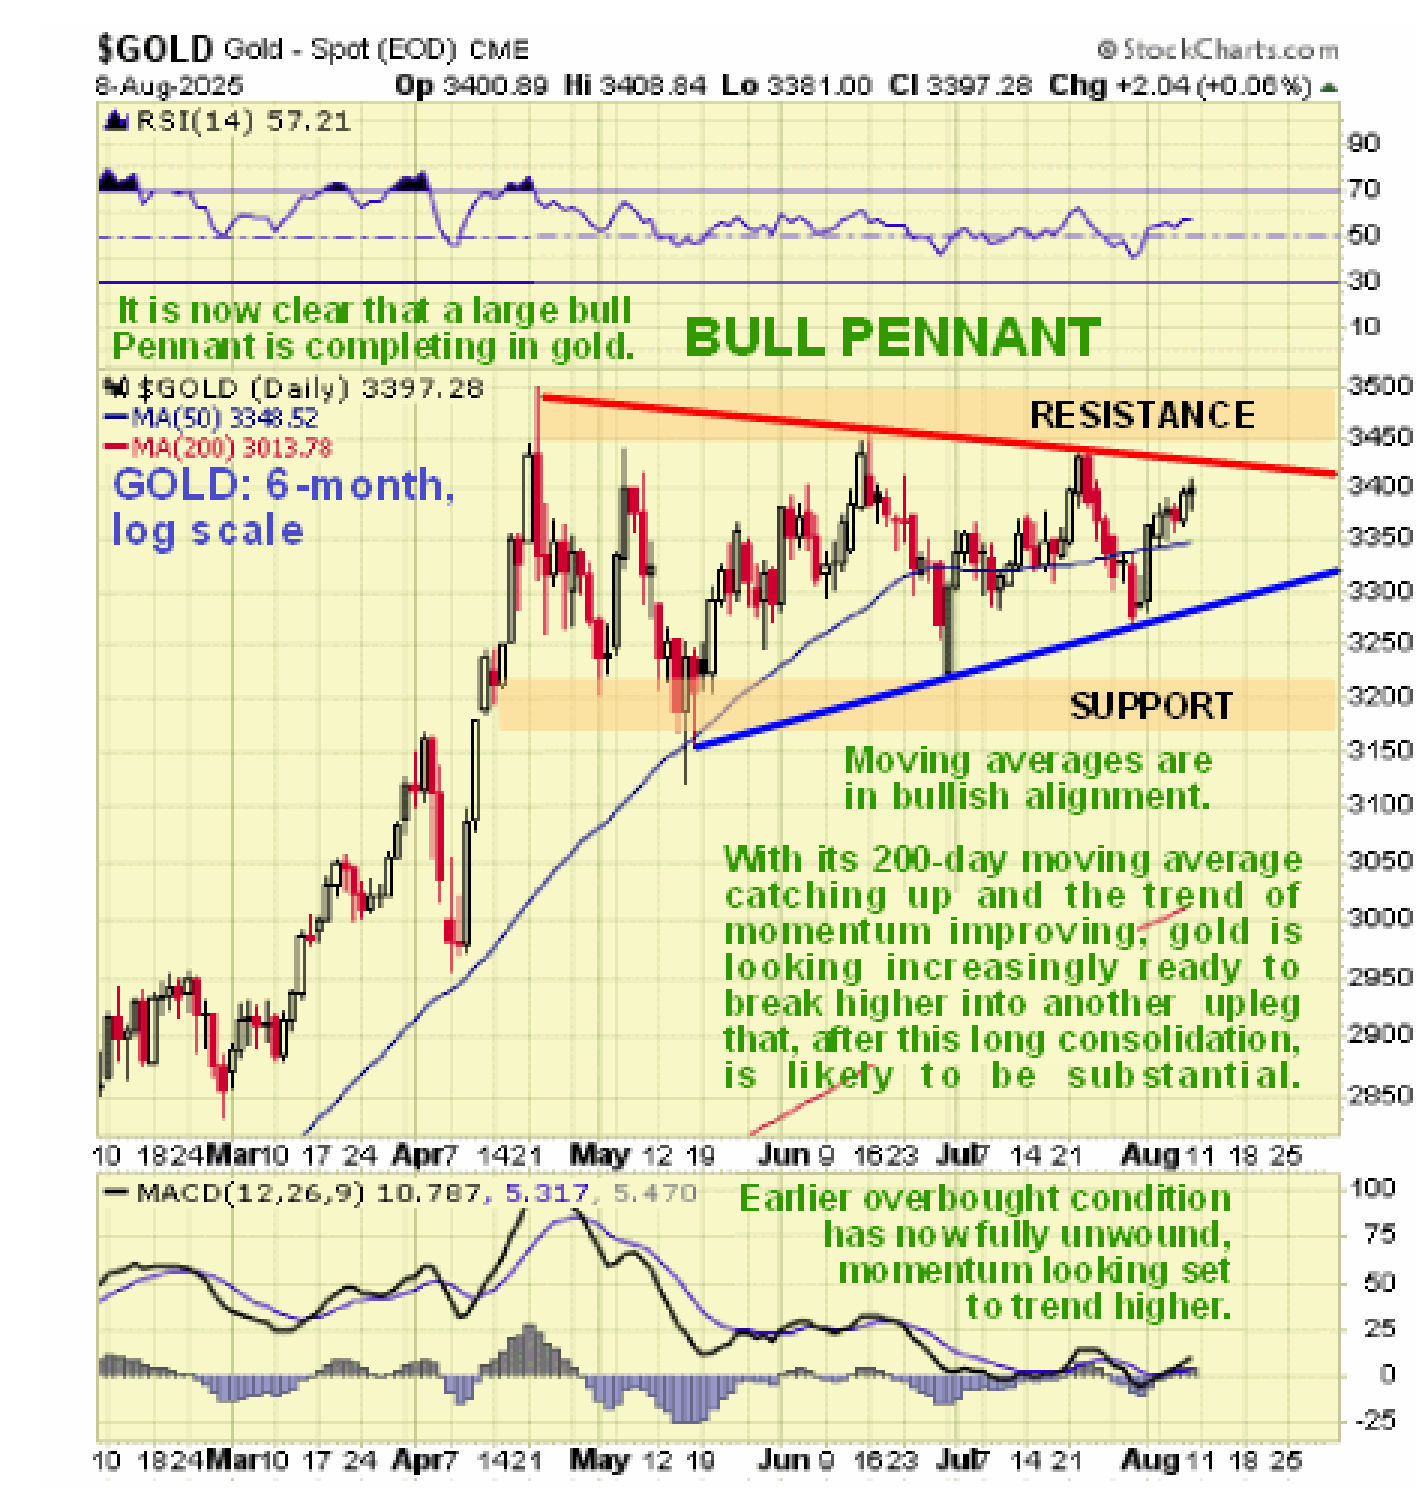
The large bull Pennant consolidation pattern in gold that has been building out for almost 4 months from mid-April is now approaching completion as we can see on its 6-month chart below and with a seasonally bullish time of year drawing near an upside breakout from this pattern is a fast growing probability and it could happen soon. The resistance marking the upper boundary of the consolidation is in the $3450 - $3500 zone and it is thus clear that a break above the April highs at $3500 should mark the start of the next upleg. The duration of the Pennant has allowed time for the overbought condition on the MACD indicator to fully unwind with it looking set to trend higher again shortly and also for the rising 200-day moving average to closet he gap with the price, all of these developments setting gold up renewed advance.
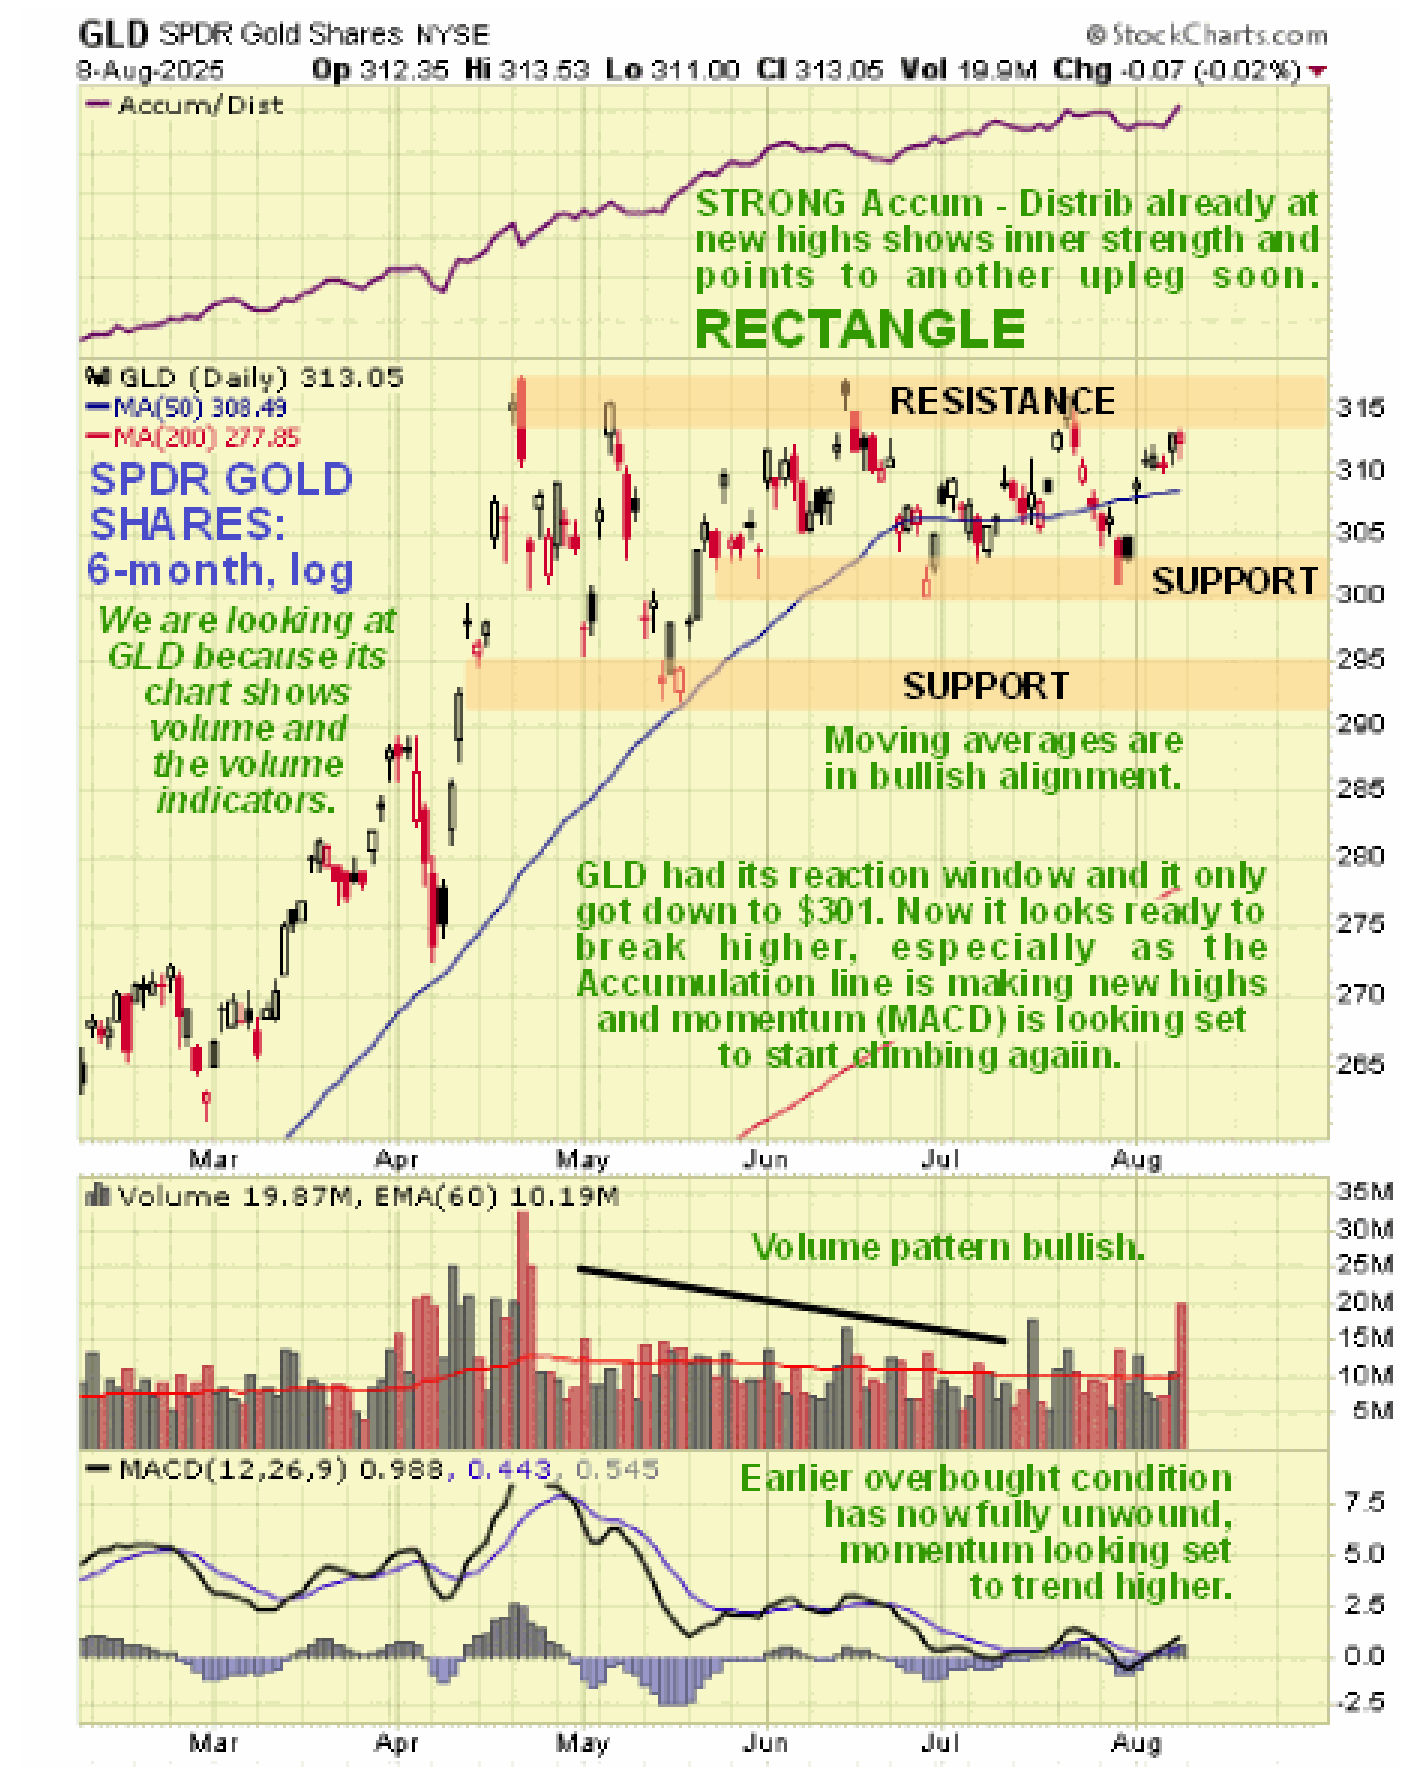
We can get around the fact that volume and volume indicators are not now shown on Stockcharts charts for gold by looking at a chart for reliable gold proxy SPDR Gold Shares for the same time period, 6-months. Although the chart is similar to gold’s as we would expect, it is different in that rather than a Pennant forming, the consolidation pattern that has formed is better described as a Cup & Handle continuation pattern whose implications are similar. However the main points to observe on this chart are the bullish volume pattern that has driven the Accumulation line steadily higher which is a reliable indication that an upside breakout is to be expected and with respect to this, there was a big volume buildup on Friday which drove the Accumulation line to new highs which might be the precursor to a breakout.
Zooming out now via the 6-year chart we see that gold has been in a powerful uptrend since early last year with the correction of recent months being in order as the price had rallied to hit the upper boundary of the uptrend in April. The fact that a rather tidy Pennant has formed in recent months implies that when the price breaks out of it, it is going to make a move of similar magnitude to the advance leading into the Pennant and this will clearly involve the price breaking out of the top of the channel as the uptrend accelerates to become steeper.
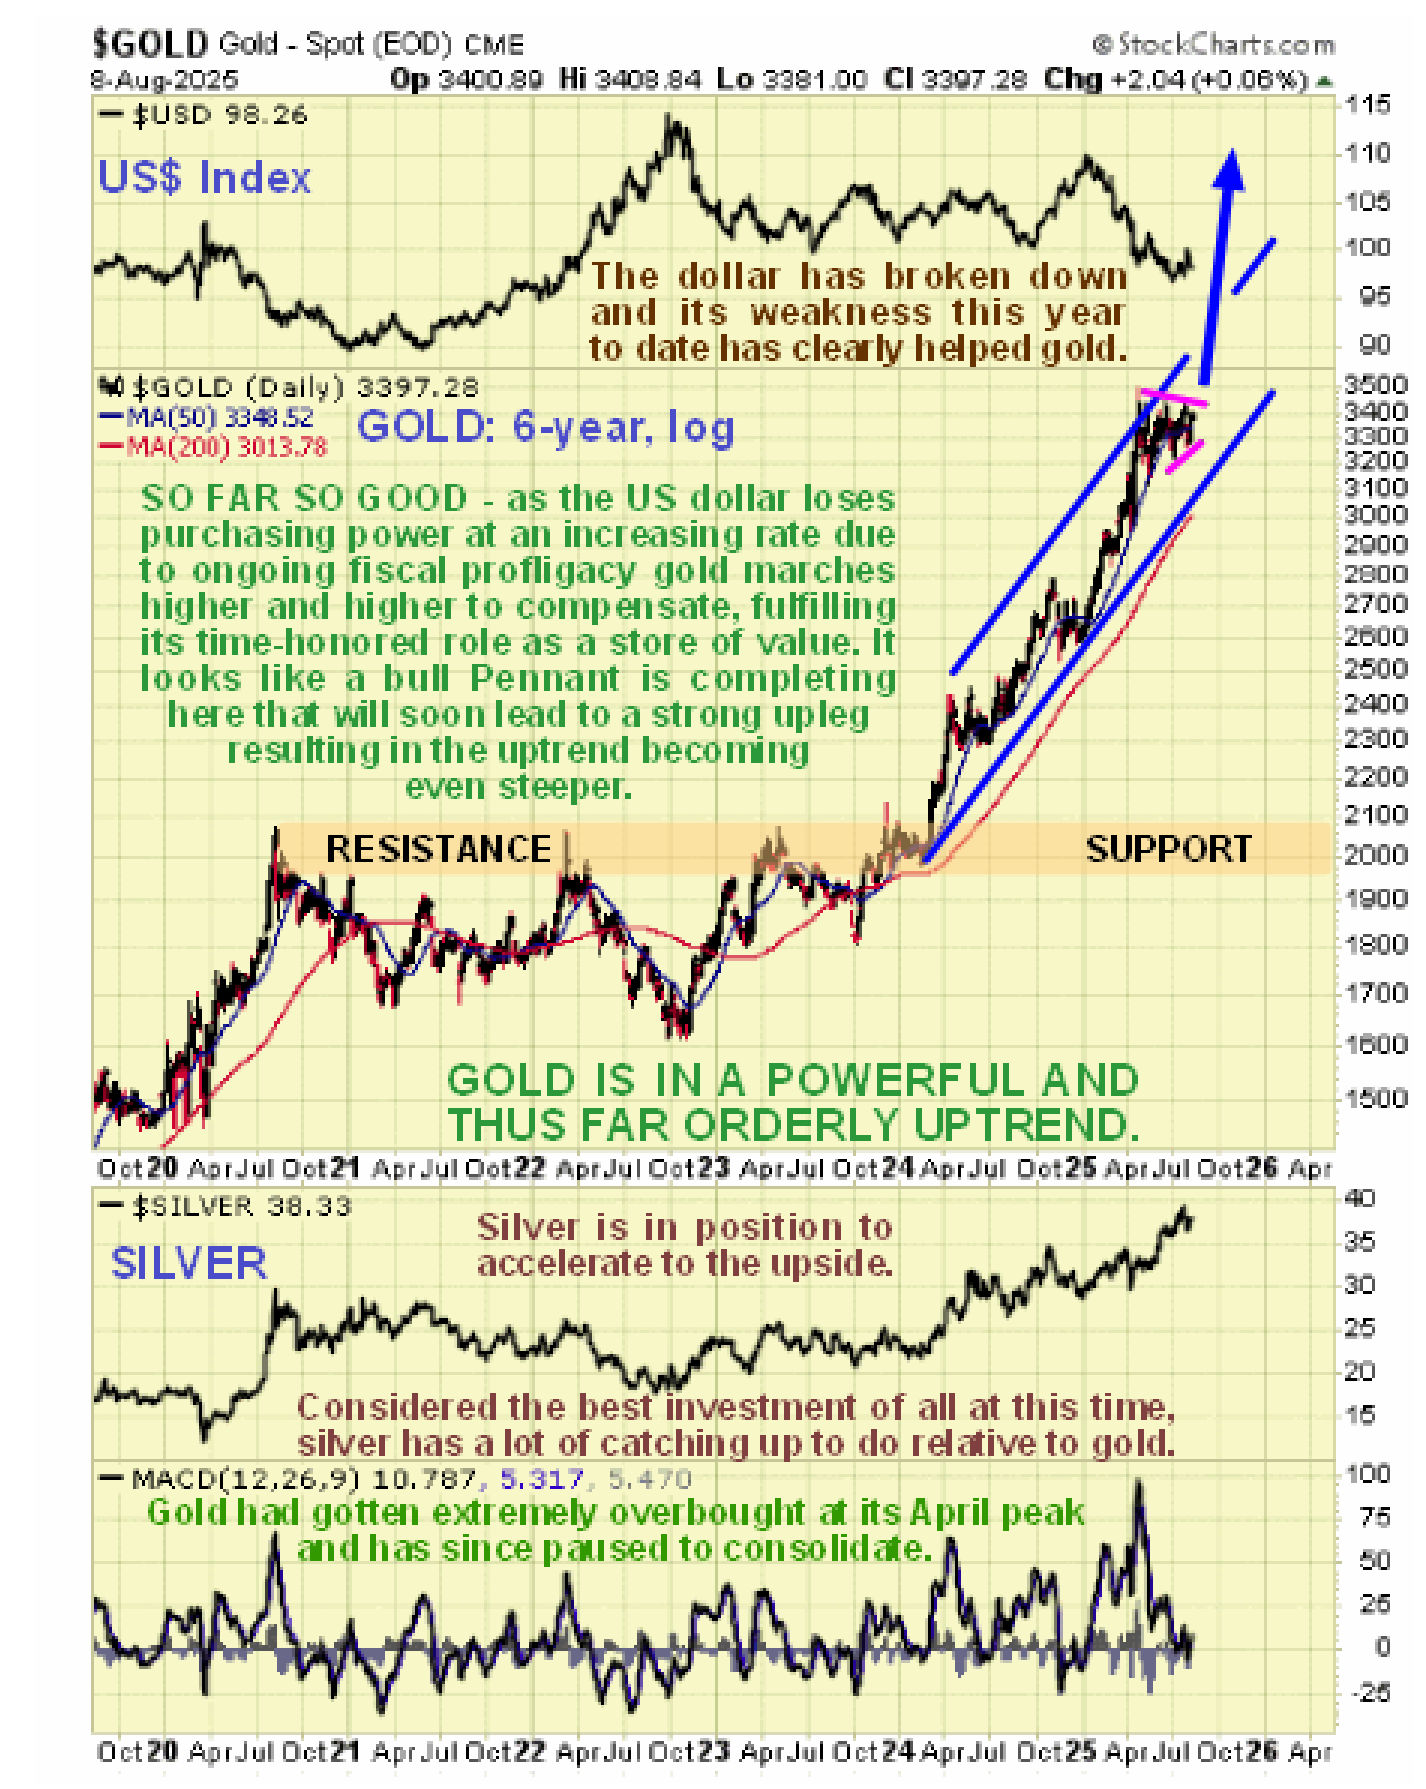
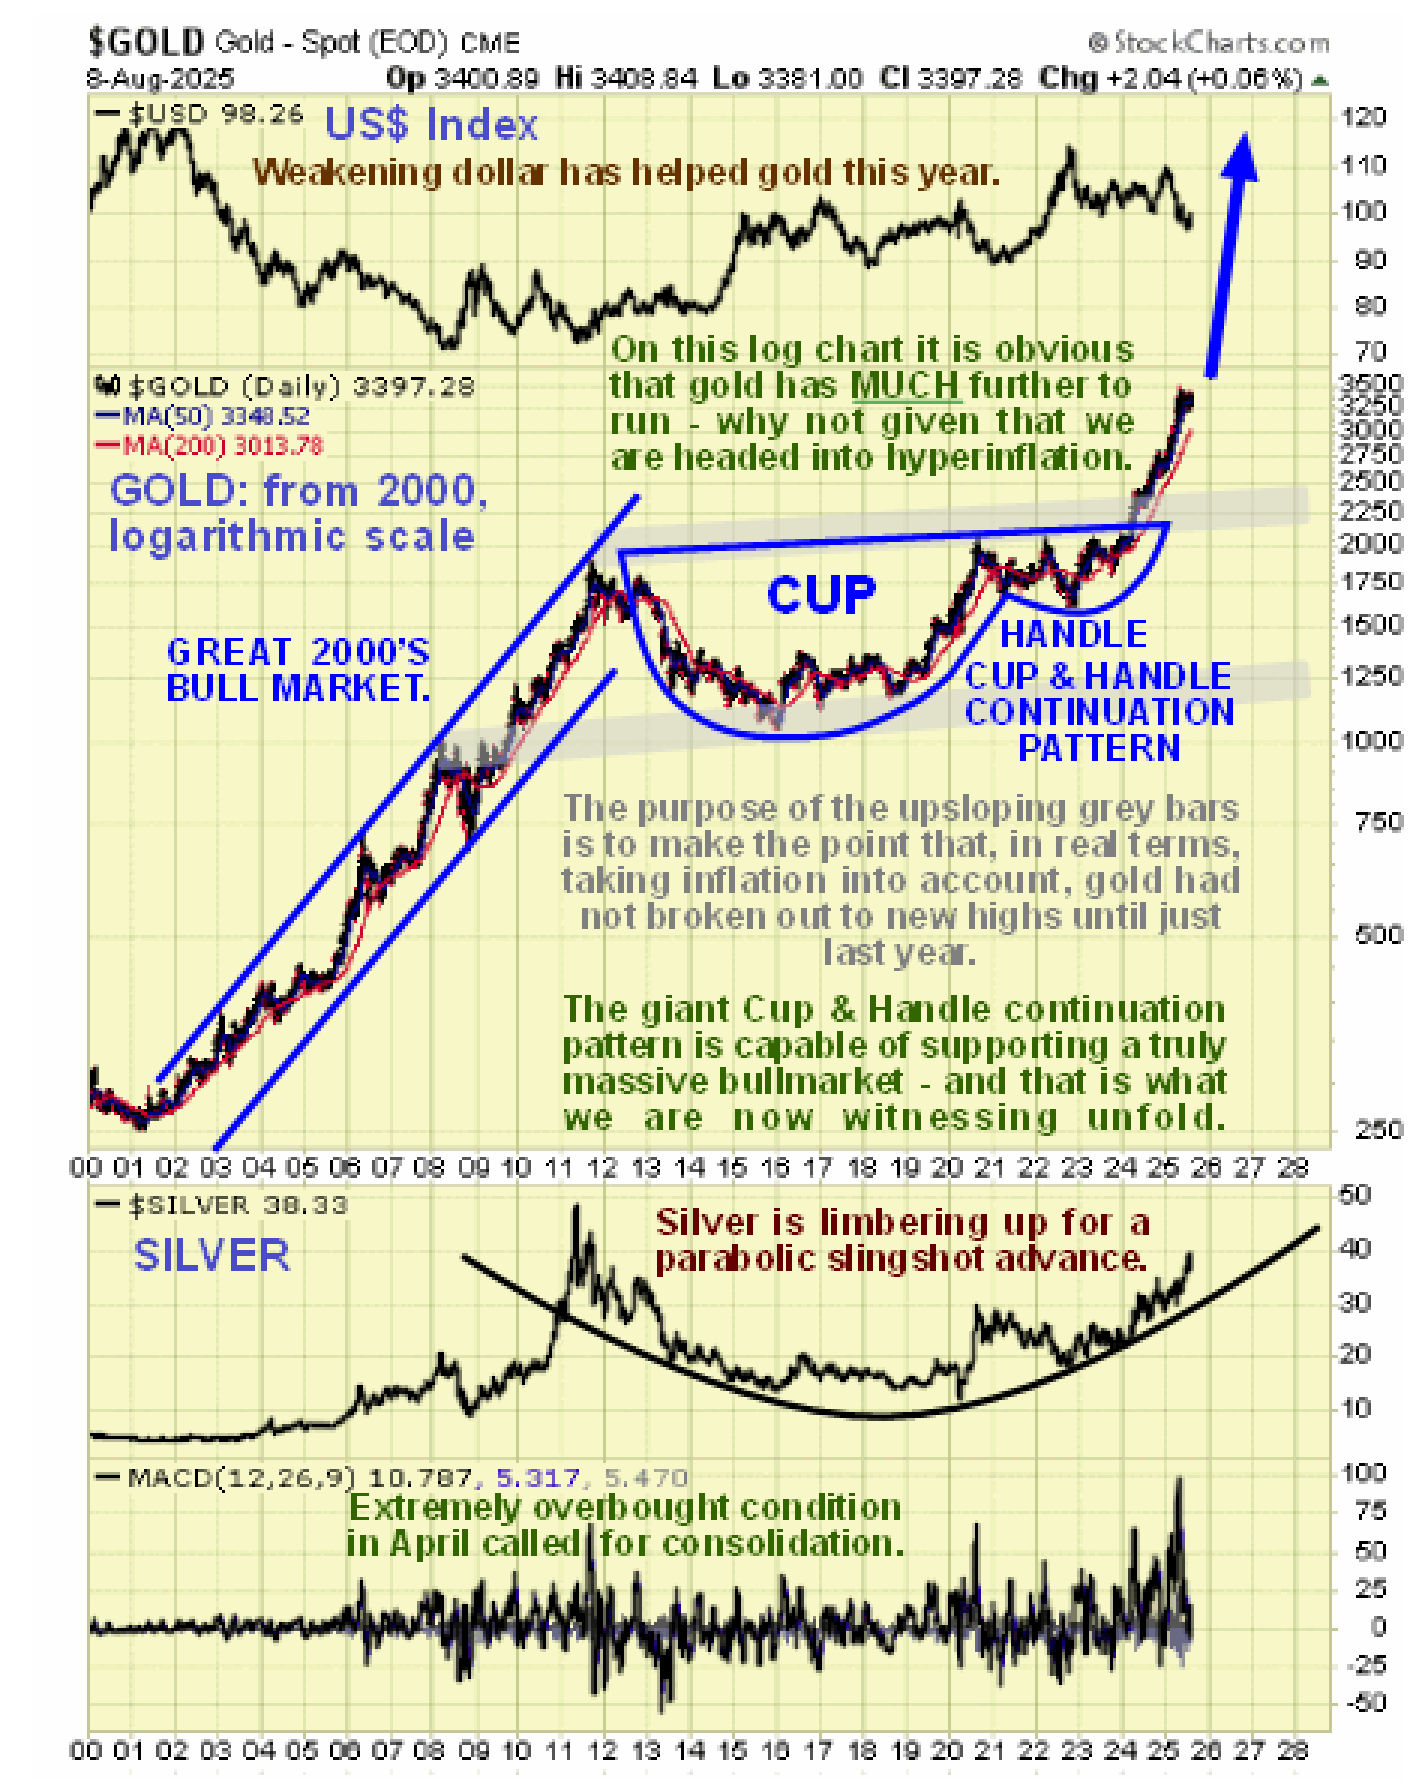
Lastly, the very long-term chart from the start of the millenium, i.e. the year 2000, makes clear that the major bull market that began early last year is still in its early stages, since it is hardly likely that the giant Cup & Handle continuation pattern that started to form as far back as 2012 would lead to a bull market lasting only a year or two. It will likely end up being at least as long and strong as the great 2000’s bull market and probably much greater because of the accelerating destruction of currencies. Before leaving this chart observe how silver, shown at the bottom of it, is setting up for a dramatic “slingshot” move higher, which will be triggered by a breakout above its 2011 highs at $50.
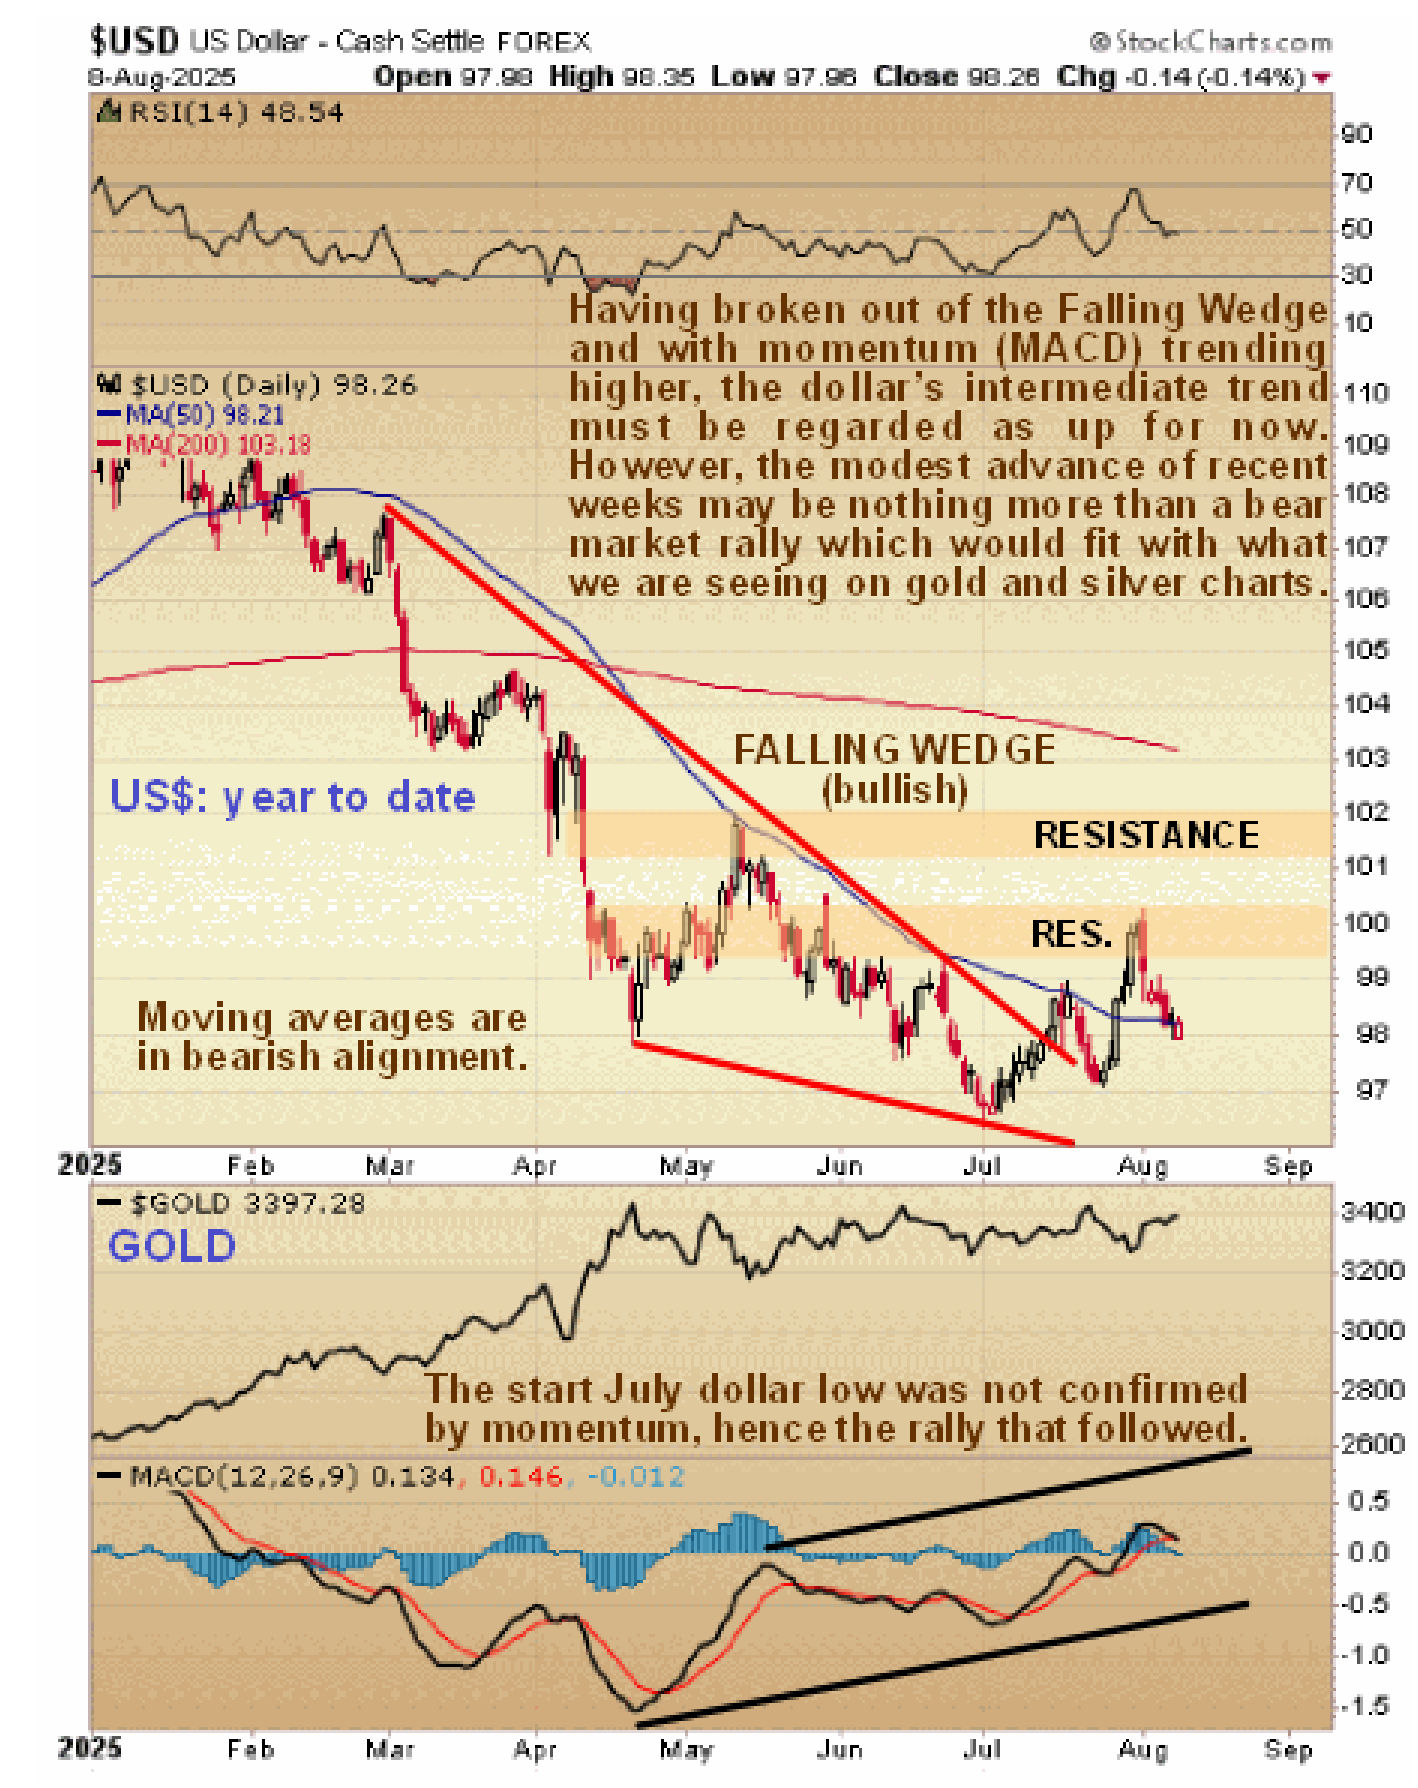
Finally, on the year-to-date chart for the dollar index we can see how the breakout from its Falling Wedge has (so far) led to a rather spluttering advance. This rally is viewed as nothing more than a bear market rally that is likely to be contained by the resistance levels shown and it could start lower again at any time, although this is said with an awareness that, having broken out of the Wedge, the intermediate trend is up until proven otherwise.
 Conclusion – a breakout into a big, strong rally by gold is expected to occur soon, probably within the next the few weeks and it could even happen in a matter of days.
End of update.