Blue Lagoon Resources is fully permitted to re-open the historic high-grade Dome Mountain gold mine in BC and it is believed to be going into production about now which is clearly an excellent time to start producing and selling gold.
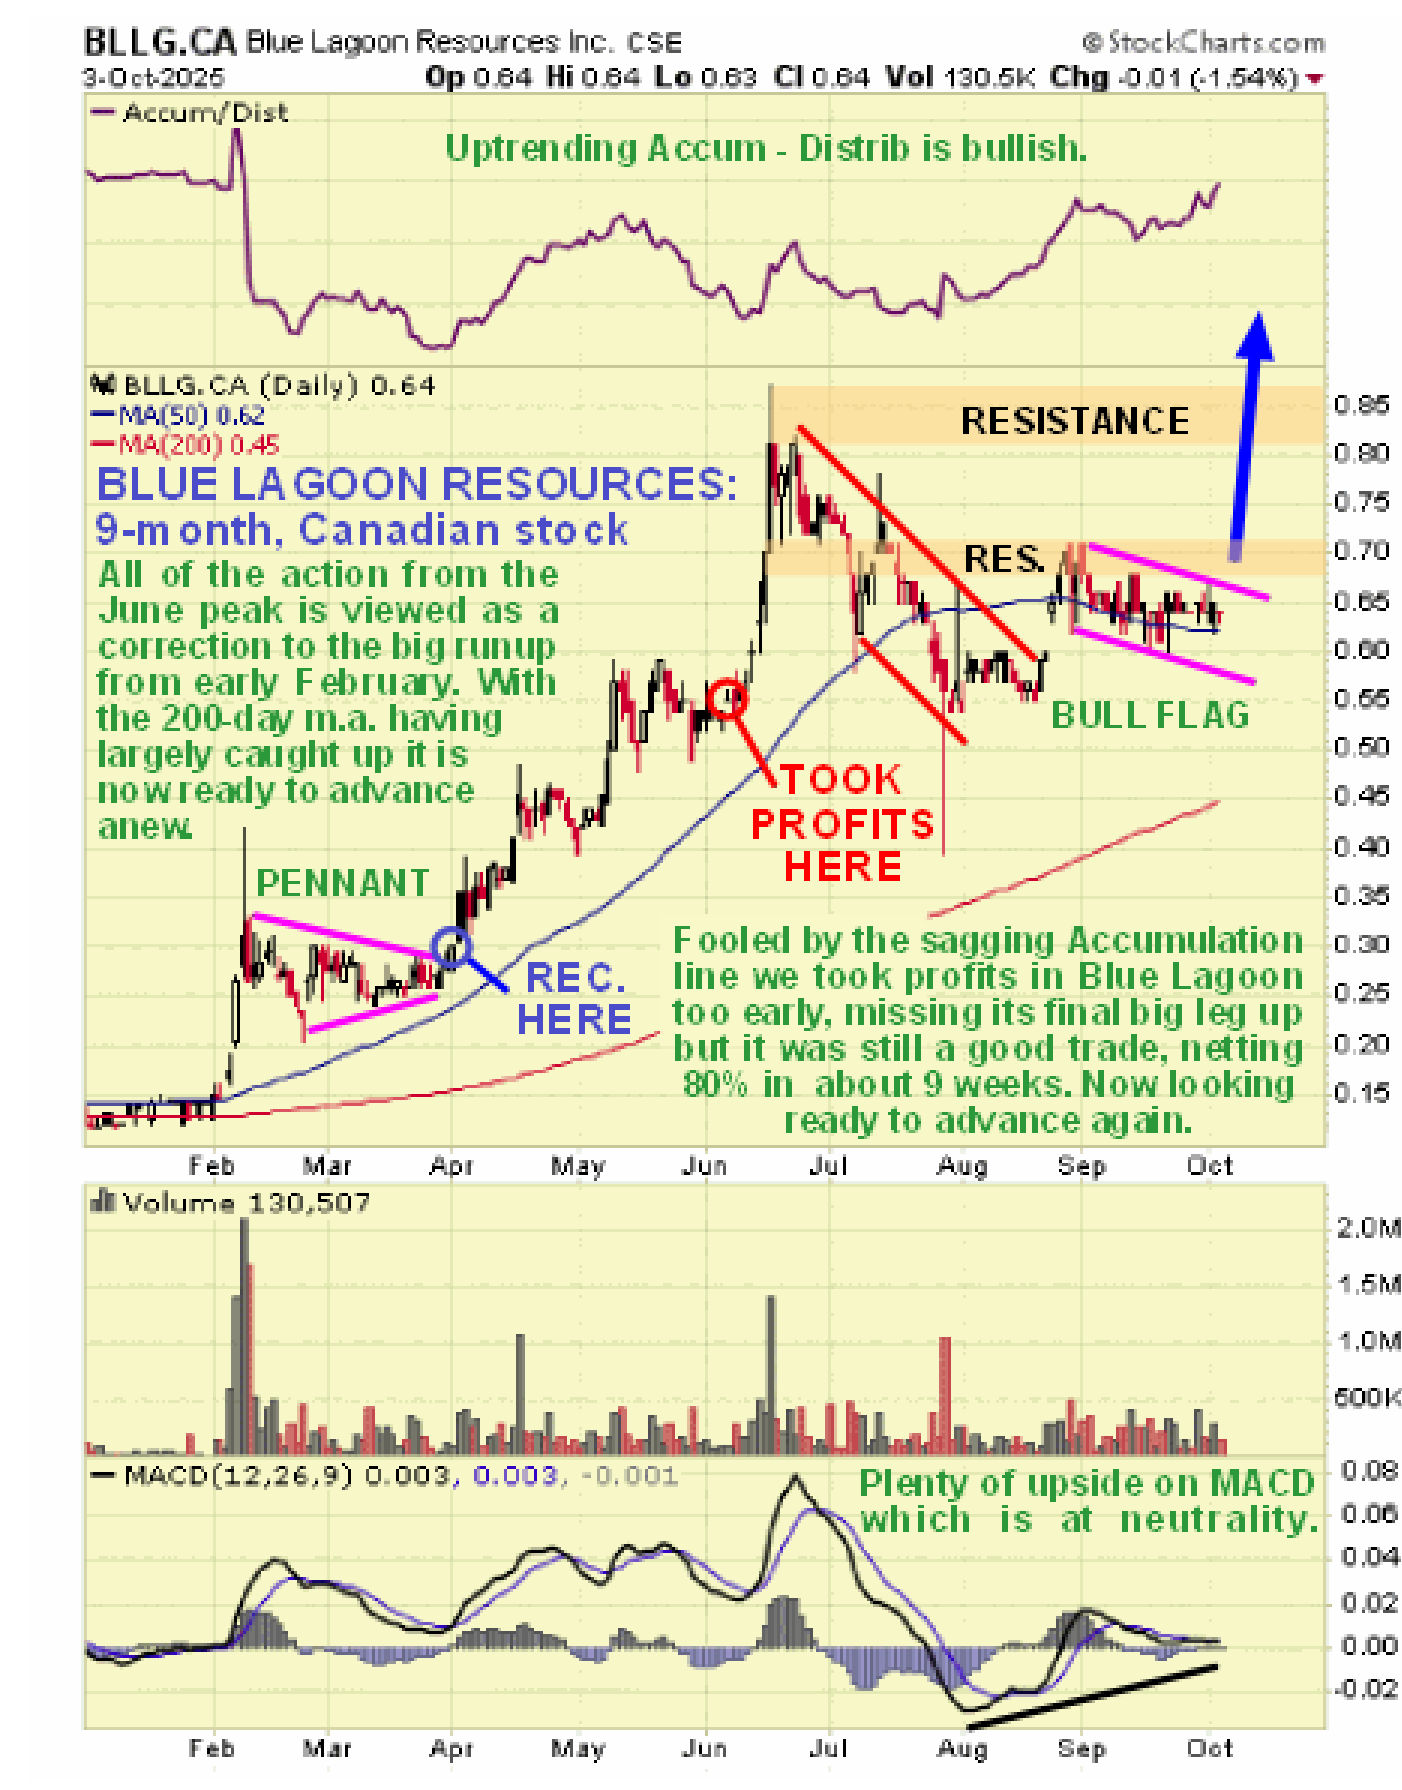
Blue Lagoon Resources stock hasn’t done much in recent months essentially because it has been continuing to digest its huge gains (that we partook of) during the first half of the year. On the 9-month chart for the Canadian traded stock you can see where we bought and sold – the entry point was great but unfortunately we took profits too early and missed the final flourish which was due to me being fooled by stronger downside volume and the weak Accumulation line at that time. Even so we were up about 83% in two months so it could have been a lot worse. The reason for selecting a 9-month chart is that, apart from showing out entry and exit points, it helps us appreciate that all of the action from the mid-June blowoff top is really a correction to the big runup during the first half of the year that saw it rise from about C$0.12 to peak at about C$0.87, a correction that has allowed the trailing 200-day moving average to largely close the earlier very big gap with the price. Blue Lagoon trades in good volumes on the US OTC market so we will now switch to a shorter-term chart for the US traded stock where we can more comfortably review recent action.
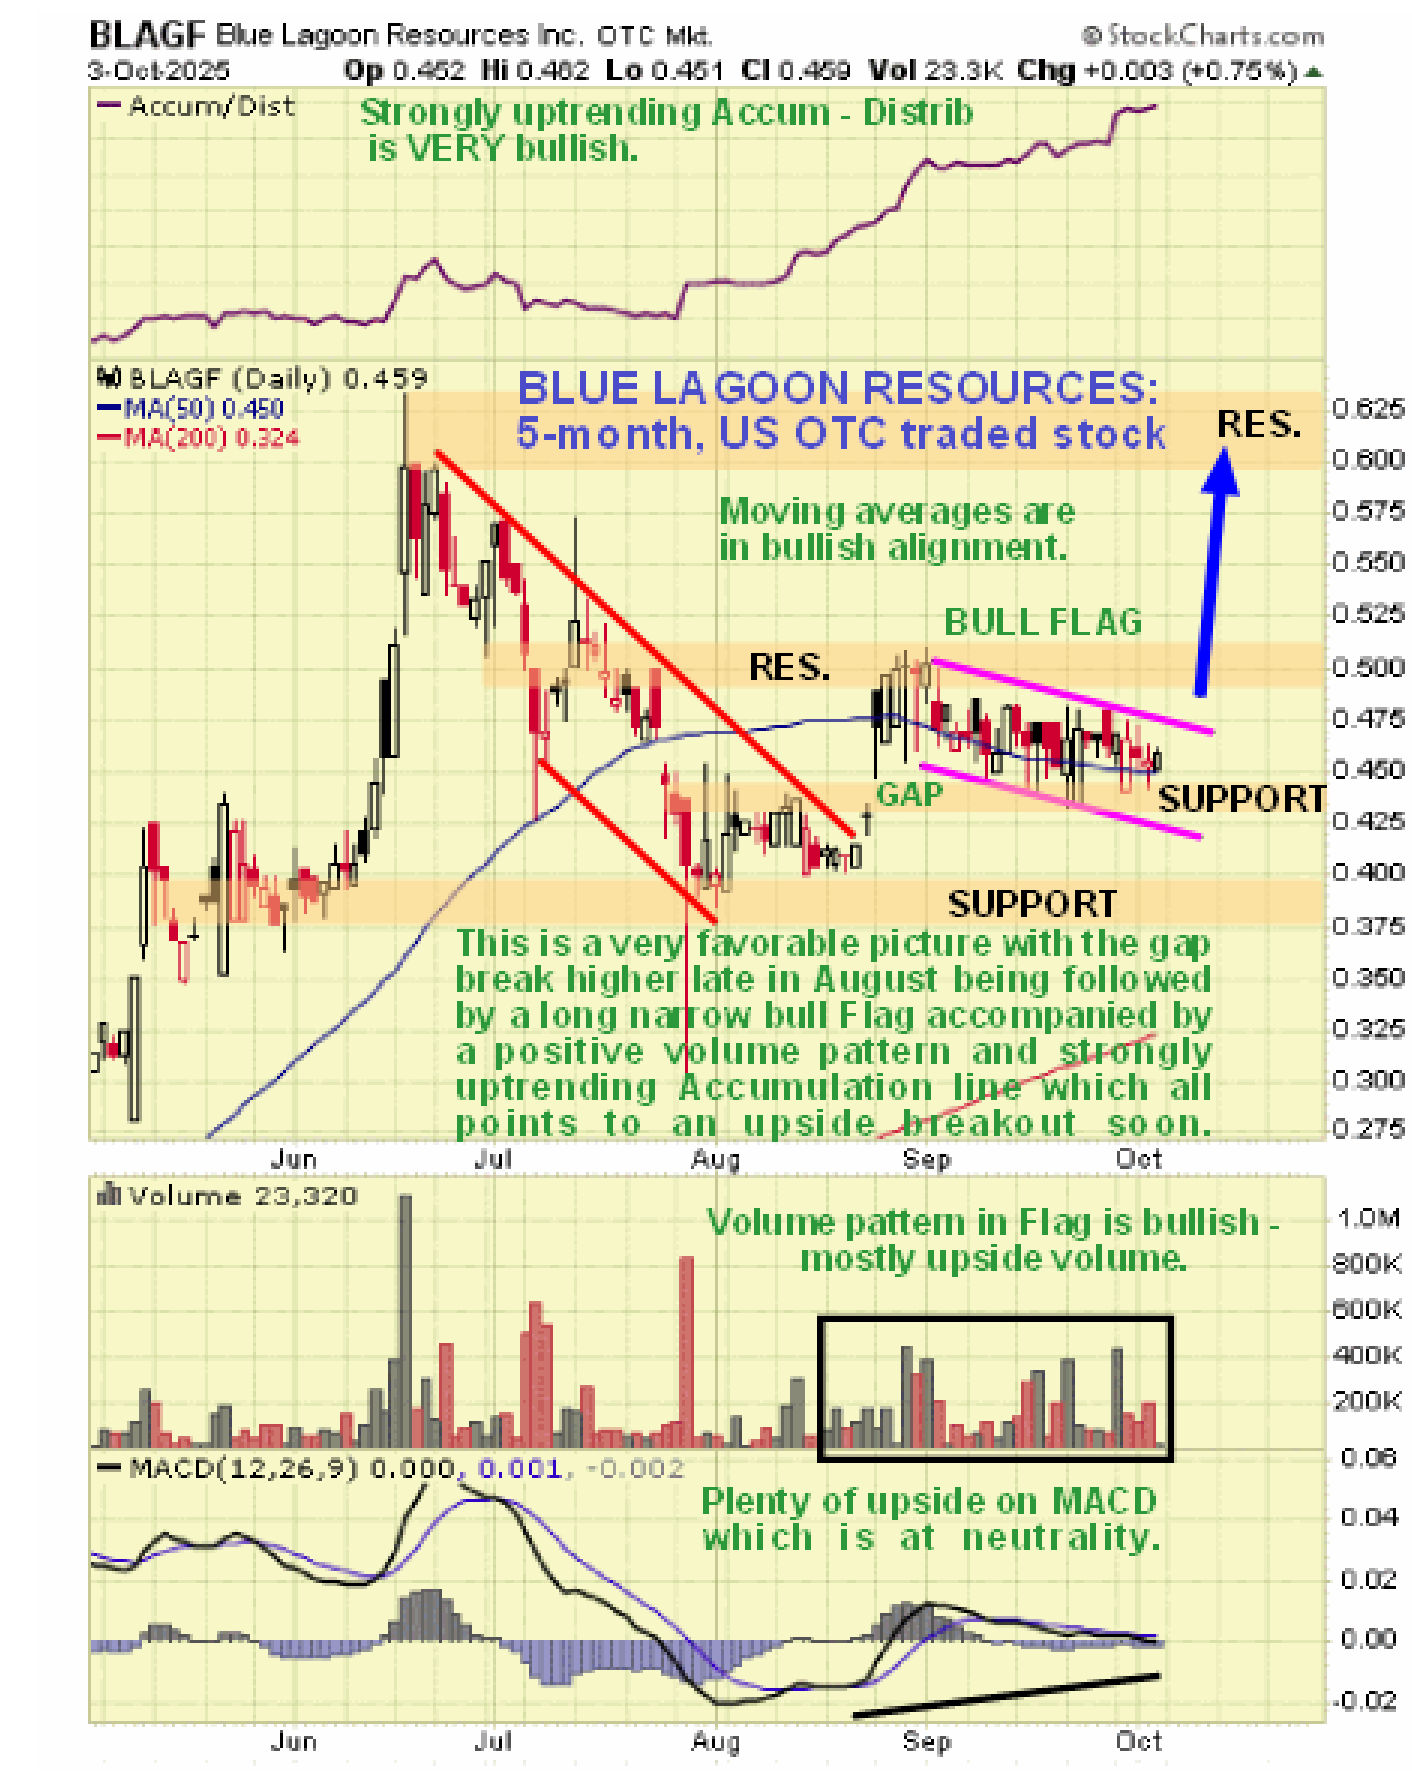
On the 5-month chart for the US traded stock we can see that Blue Lagoon is already pivoting to the upside, with the low for the correction being the rather dramatic wide range “dragonfly doji” that appeared towards the end of July when it briefly touched $0.30 intraday. About 3 weeks after this bottoming candle appeared it broke out of the down trend in force from mid-June in a decisive manner with a gap but because it wanted to spend more time digesting its big gains earlier in the year it then sloped off into the extended narrow bull Flag shown. We know it is a bull Flag because most of the trading volume during its formation has been upside volume which is why the Accumulation line has continued to forge ahead in a robust manner. This very positive volume pattern portends an upside breakout from the Flag, especially as the rising 200-day moving average is now coming into play beneath, and probably soon and after months of underperforming the sector this new upleg should be substantial and will probably take the stock comfortably to new highs.
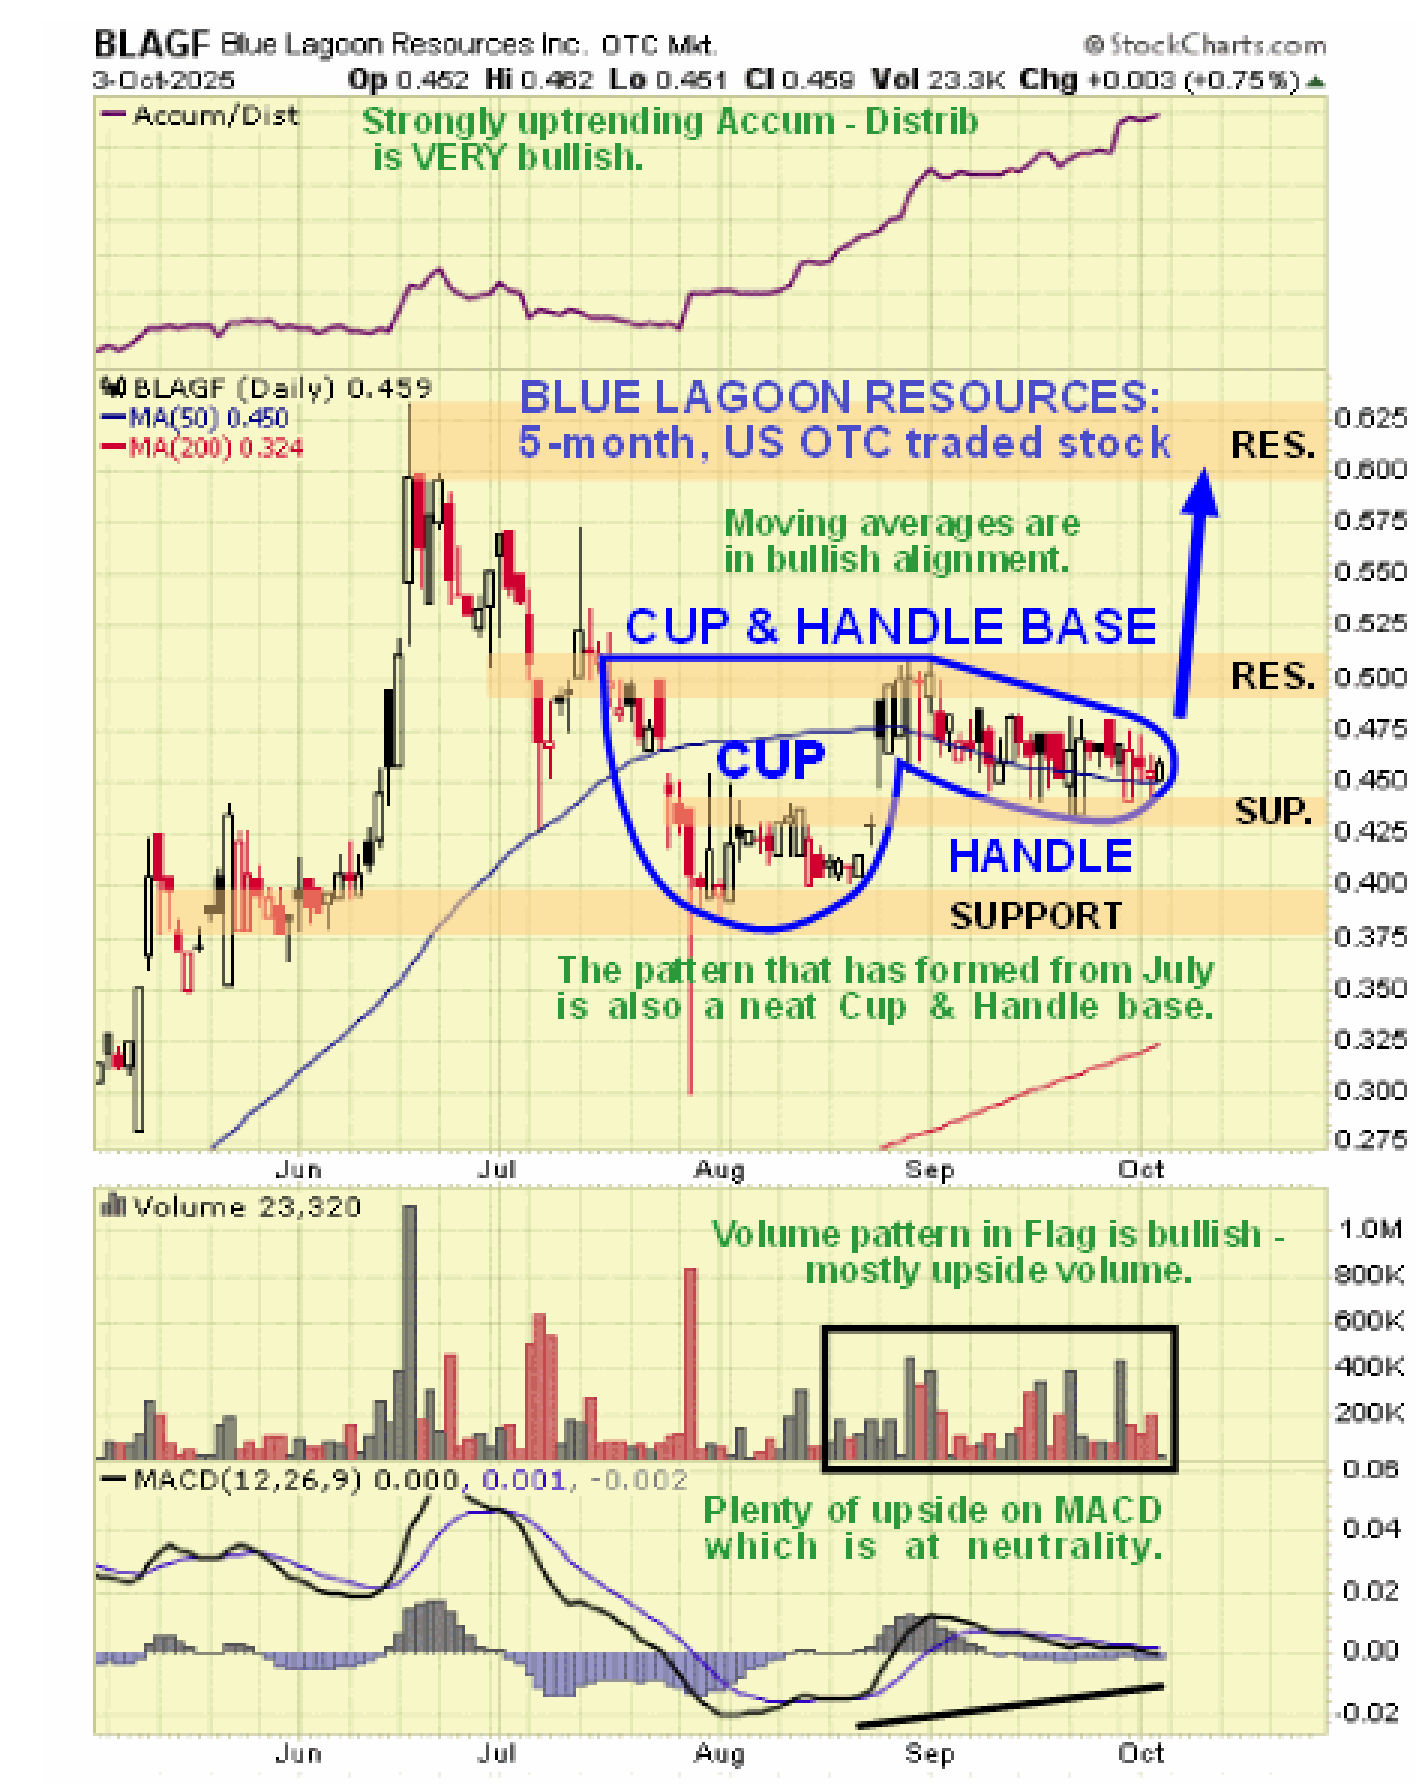
We can also see on the additional 5-month chart added below that a fine Cup & Handle base has formed in Blue Lagoon since mid-July, this chart being added to avoid cramming too many elements on one chart which would become excessively cluttered…
 Blue Lagoon Resources is therefore rated an immediate strong buy for all timeframes.
Blue Lagoon Resources
website
Blue Lagoon Resources Inc., BLLG.CSX, BLAGF on OTC, closed at C$0.64, $0.459 on 3rd October 25.
Posted at 5.30 am EDT on 6th October 25.