Platinum’s major bull market started relatively recently last May, when it decided at last to join gold and silver’s major bull markets and as we will proceed to see, it has a lot further to run. This bull market was predicted on the site back in April of last year in the article
PLATINUM – a still HORRIBLY UNDERVALUED PRECIOUS METAL with HUGE UPSIDE and so it proved to be with platinum gaining some 70% since then.
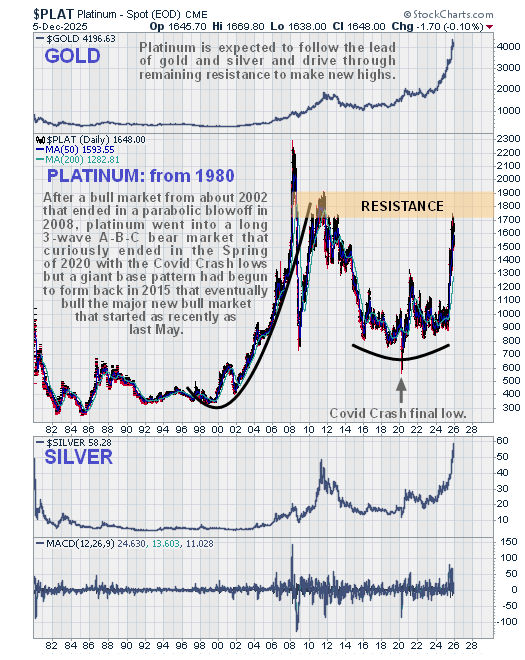
We’ll start by looking at the very long-term chart going back to 1980 to gain an overall perspective. On this chart it is amazing to observe that platinum had made no net gain from its early 1980 peak to its price early last year, which clearly indicates a severe loss in value in real terms taking inflation during all the intervening years into account. On this chart we can also see that there was a major bull market between 2002 and 2008 that ended in a parabolic blowoff which led inevitably to a long 3-wave A-B-C bear market. This bear market finally ended with the Covid Crash low in the Spring of 2020 when this carefully orchestrated psyop caused many to believe that the world was about to end. However, long before the final low, a giant base pattern had started to form as far back as 2015 which was correctly indentified in last year’s article as a Head-and-Shoulders bottom.
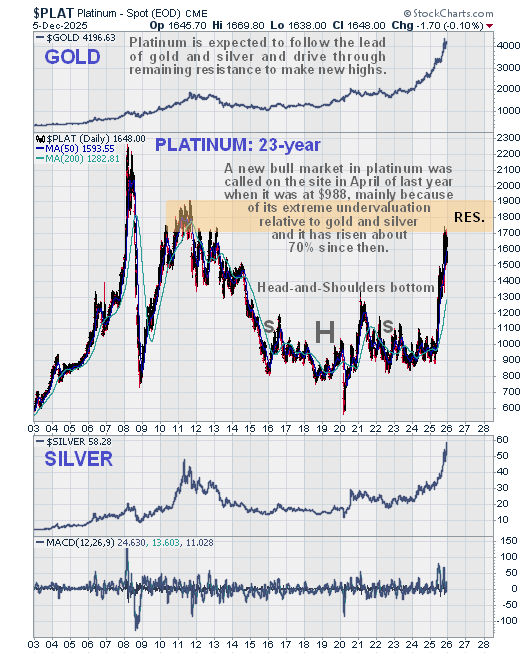
We can see the giant Head-and-Shoulders bottom to advantage on a somewhat shorter-term 23-year chart, and how it ended in a rather dramatic manner with the powerful uptrend that began in May of this year that quickly broke it clear out of the pattern. Gold and silver have been added at the top and bottom of this chart to show what caused the breakout in platinum – the continuing strong bull market in gold and silver pushed platinum into joining the party, just as we’d expected. Before leaving this chart we should note that the price is now arriving in a zone of significant resistance in the area of the 2010 – 2012 peaks. However, this is not expected to impede it for long for reasons that we observed on the charts for the Sprott Physical Platinum and Palladium Trust just yesterday where we have the benefit of being able to see volume and the Accumulation line which are extraordinarily bullish, which suggests that both platinum and palladium will easily drive though any remaining resistance to achieve new highs before too much longer.
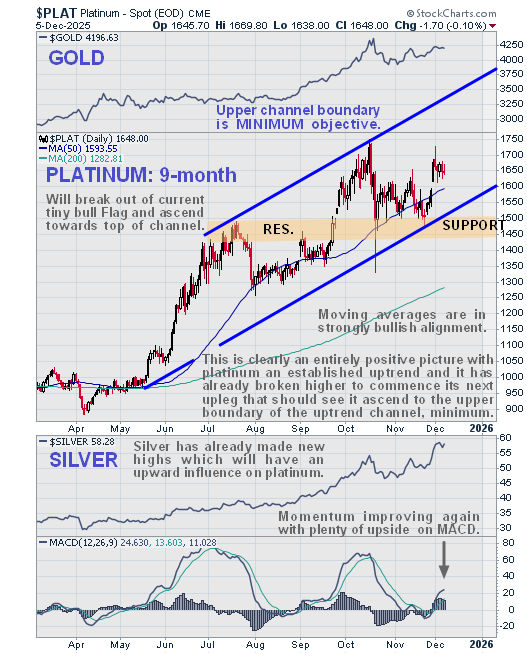
Now we will look at the strong new bull market uptrend in platinum in detail on a 9-month chart which shows all of it and the lead in to it. As we can see, platinum is advancing in a fine orderly uptrend. There have so far been 2 impulse (up) waves that have been followed by periods of consolidation / reaction that have served to allow time for the overbought condition to unwind and for moving averages to partially catch up. After correcting back to the lower rail of the channel, the 3rd upwave is believed to have just begun with the gap break higher not long ago which we will now look at it more detail on the 3-month chart.
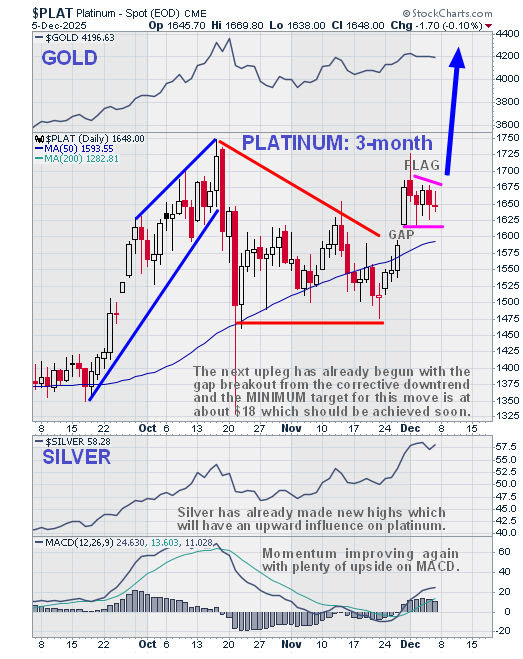
On the 3-month chart we can see how the gap breakout from the corrective pattern that developed from mid-October has been followed by a small bull Flag that is expected to end soon with another sharp break to the upside with the price then continuing to advance to the upper rail of the channel shown on the 9-month chart which is a mínimum objective as this uptrend could become even steeper.
Having made these observations, the next logical step for us is to look at a way of capitalizing on them. A good vehicle for this purpose is the stock of Platinum Group Metals PLG on AMEX, $2.46, PTM.TSX, C$3.39, a South African producer of both platinum and palladium whose charts show great promise with it just starting to rise out of the 2nd low of a gigantic Double Bottom. We will look at its charts in a separate article, but in any case it is viewed as an immediate strong buy.
The conclusion is that platinum and all things platinum are a strong buy here for continued gains.
Platinum closed at $1648 on the 5th December 25.
Posted at 5.30 am EST on 8th December 25.