Everything is “going to plan” as far as the Precious Metals sector is concerned with gold taking off strongly higher as predicted and the Precious Metals sector outperforming the broad market for the 1st time in a long time, also as predicted. Two articles were posted on the site about this. One entitled
WHY THE PRECIOUS METALS SECTOR IS BELIEVED TO BE AT A TERRIFIC BUY SPOT HERE was posted at the sector low at the end of January right before the current vigorous rally started and the other entitled
GOLD & SILVER SET TO SOAR AS BANK ACCOUNTS AND CRYPTO WALLETS COME UNDER THREAT called for further strong gains in gold and especially big high dividend paying gold stocks, which is what we saw courtesy of the Russian invasion of Ukraine.
We will start with Larry’s latest gold chart, which speaks for itself…
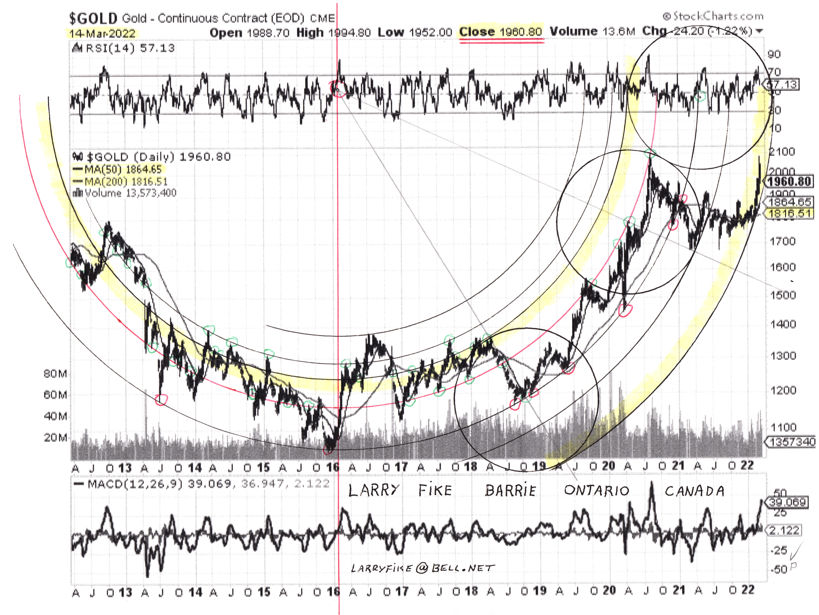
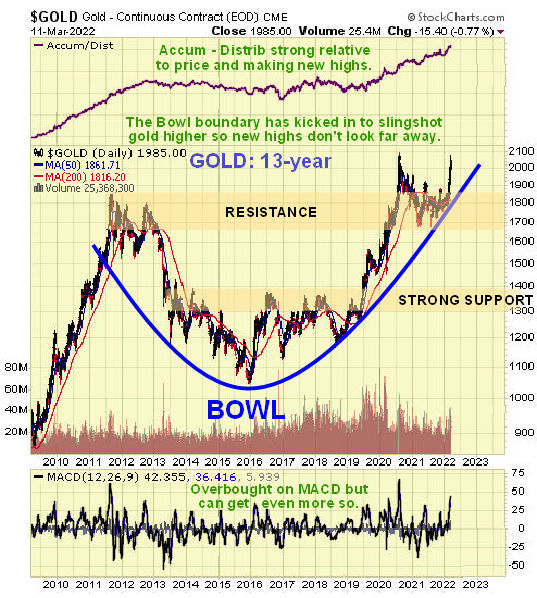
On gold’s latest 13-year chart we can see how it has been projected higher by the boundary of a giant Bowl pattern and even though it may pause to consolidate for a little while at the resistance at its 2020 highs to allow its overbought condition to ease somewhat, new highs don’t look far away, and it is ultimately set to go much much higher as the value of the dollar continues to dwindle in the face of frenetic money creation. The Bowl shown on this chart is a parabola, whereas Larry’s chart shows a giant circle, and whilst I am not sure which is most appropriate, it doesn’t much matter as both project the price higher. It can be argued that gold must eventually break down from Larry’s circle because it goes vertical, but that wouldn’t be a problem as all it would mean is that gold would then proceed to mark out the Handle of a Cup & Handle pattern before continuing higher anyway and maybe that’s what it already did from August 2020.
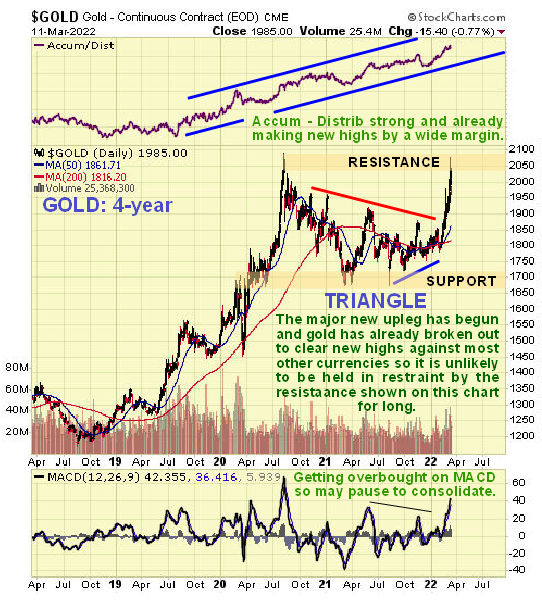
On the 4-year chart we can see how gold broke higher last month from a large triangular consolidation pattern exactly as predicted in ----. As it has already broken out to clear new highs against most all other currencies, it is unlikely that it will stopped for long by the resistance at the 2020 highs.
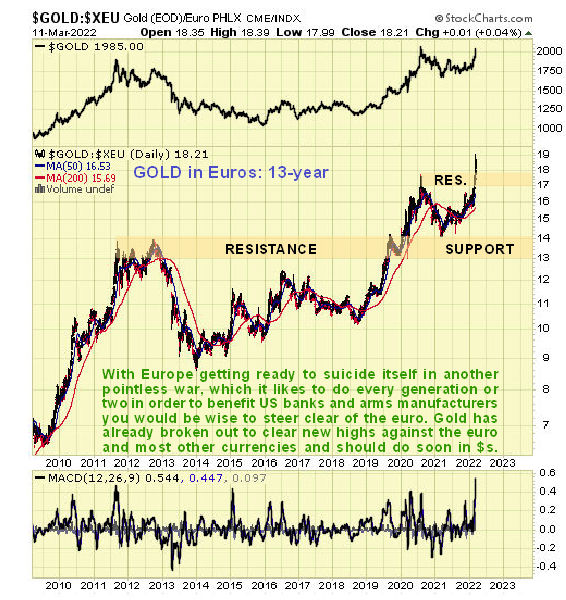
On the 13-year chart for gold in euros we can see how gold has already made a clear breakout against this currency, which is hardly surprising with Europe on the brink of another major conflict, which it likes to do every generation or two. The Ukraine war marks Stage 2 of The Great Reset, and it serves to draw attention away from the vaccine holocaust at a time when it was becoming more obvious, block closer economic ties between Europe and Russia, drive up the price of energy in order to both promote alternative energy and collapse the world economy, and stop the exports of both fertilisers and grains from Belarus, Hungary and the Ukraine the better to reduce the world population through starvation. So gold should continue to advanc e strongly against the euro and Europe is ground down and impoverished by spreading conflict.
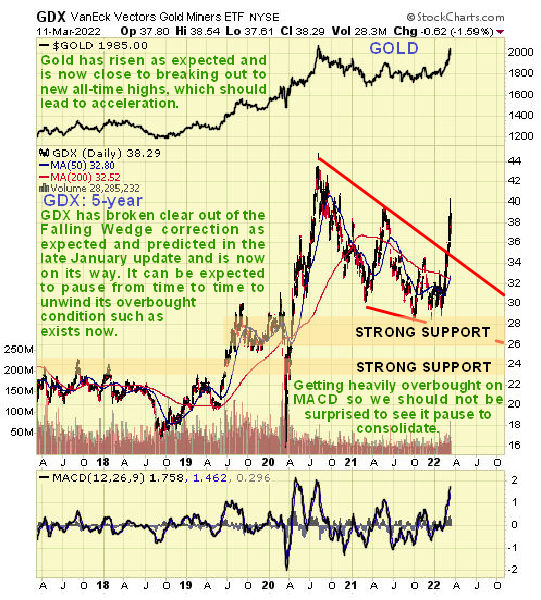
Turning now to Precious Metals stocks which have been doing very well in the recent past, we see on its 5-year chart that GDX has broken out strongly from the large consolidation Pennant that formed from the August 2020 highs. A major new uptrend is believed to have begun that should see it rally above these highs and then continue on, with pauses to consolidate along the way, towards the resistance at its 2011 highs, which it is expected to eventually overcome.
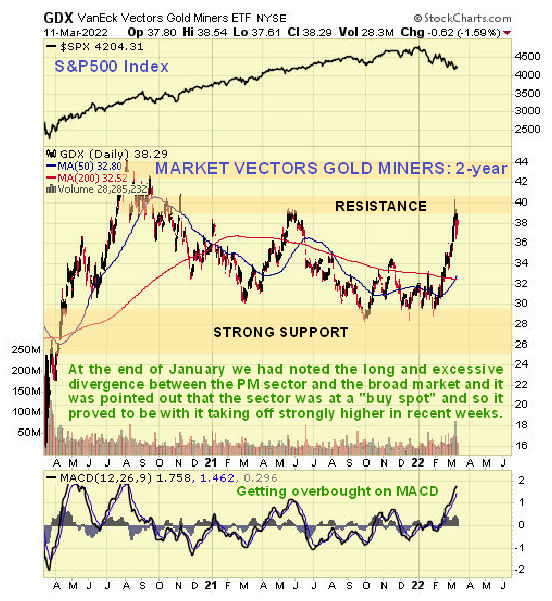
On the 2-year chart we can see how the strong advance by GDX brought it to a resistance level which it arrived at in a quite heavily overbought state, so it has paused to consolidate. Notice how, after markedly underperforming the broad stockmarket (shown at the top of this chart) from its August 2020 highs, it has now switched to outperforming it, as expected.
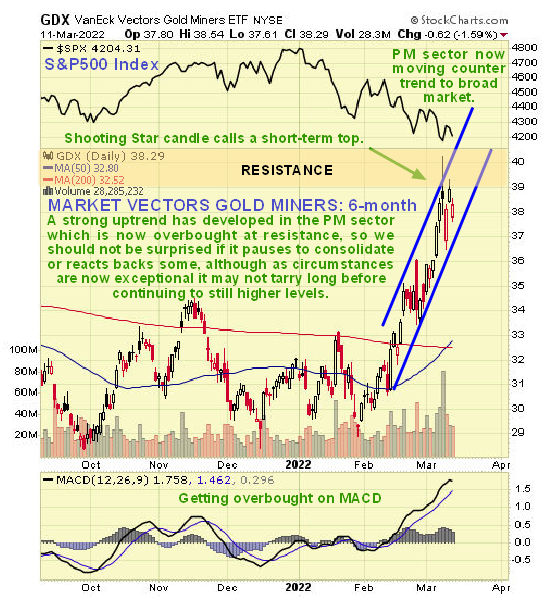
On the 6-month chart for GDX we can see the fine strong uptrend that has taken hold since the middle of February, obviously assisted by the Ukraine conflicto. As it is now overbought at resistance it may pause and possibly react back some, and it should be noted that it doesn’t matter much if it breaks down from this uptrend channel, as it is so steep. If it does it will probably form a consolidation pattern such as a trading range or a Flag / Pennant before advancing anew.
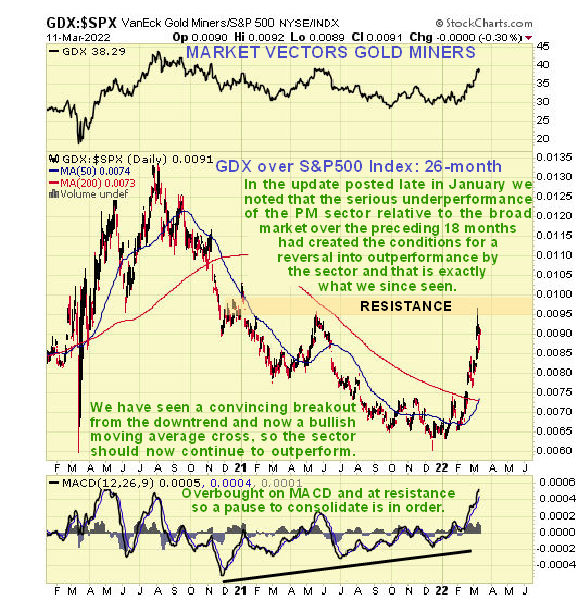
The 26-month chart for GDX relative to the S&P500 index reveals the serious underperformance of the sector relative to the broad market that went on until the end of last year, but this year it has reversed into significant outperformance although it still has quite a bit of ground to make up.
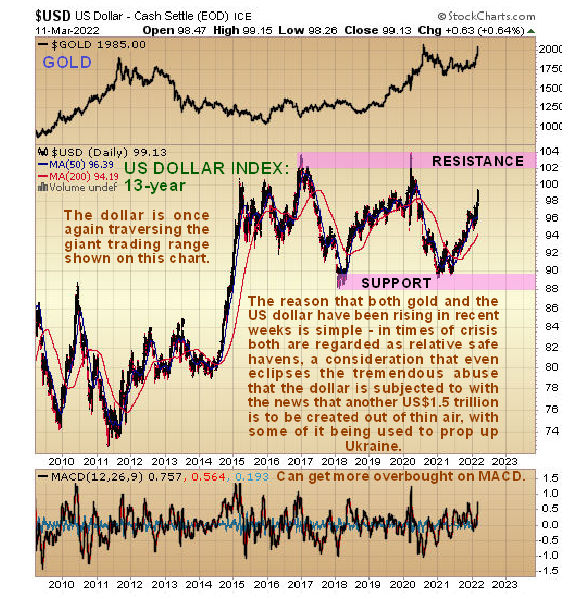
We’ll finish by taking a quick look at the dollar index which has rallied quite sharply with gold in recent weeks basically for the same reason, which is that at a time of crisis of this nature, both are regarded as relatively safe havens. Whilst the dollar is intrinsically weak and ultimately doomed, along with all other fiat, it is for now the best of a bad bunch, which is why its exchange rate against most other currencies has improved. On the dollar’s 13-year chart we can see that it is traversing back up across the giant trading range that has been forming since early 2015. It looks likely that it will continue on to the top of this range, but it is hard to say at this juncture if it will succeed in breaking out of the top of it.
What is happening now across the world was predicted many years ago by Elliott Wave theorists who detailed a confluence of upward cycles all coming to an end around this time, including what they call a “grand supercycle” which is a massive long-term cycle, the biggest. We are at the end of an era or epoch, and are now entering the downward part of what is also known as the Kondratieff Wave which is a long-term economic cycle. The global collapse that is gathering pace is the inevitable result of yet another doomed fiat experiment that has gotten completely out of control and has been taken to the wildest extremes imaginable. This collapse is also laying bare who really governs the world, which is the World Economic Forum, also known as the Globalists or the New World Order, an elite transnational club of billionaires and plutocrats, who have come to the fore as they steer the world towards their objectives of mass depopulation, the implementation of a total control grid and the transfer of all assets and wealth to themselves.
End of update.