The
last Gold Market update, posted at its recent peak on the 11th, called for a significant reaction back by gold, and that is exactly what has since happened. It also called for a rally in the dollar, which hasn’t happened – yet, but as we will see in this update, it looks likely to happen soon, and given that gold’s COTs have barely eased on the current reaction to date, it therefore seems likely that gold will lose more ground on a dollar rally.
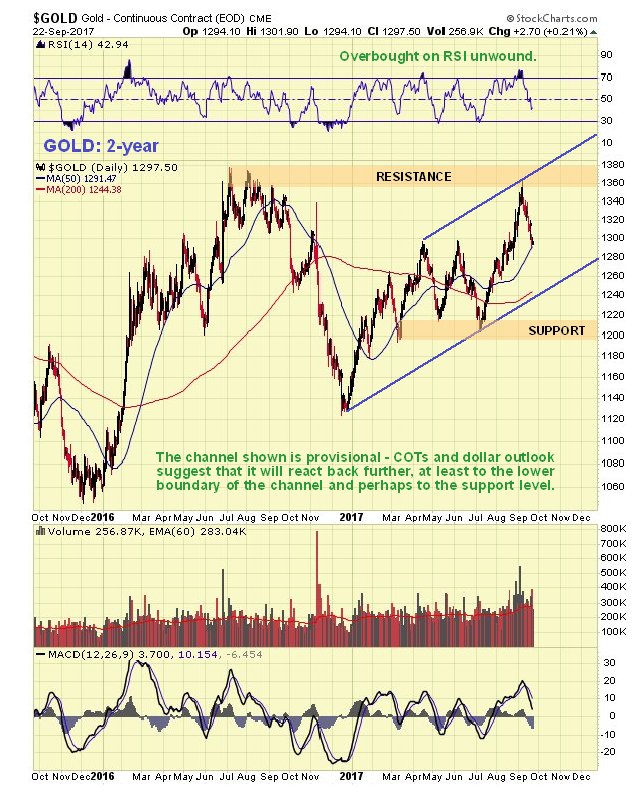
On gold’s 2-year chart we can see that it was at a good point to reverse to the downside early in the month as it had risen into the zone of substantial resistance in the vicinity of its mid-2016 peak. A potential channel is shown, and if it should drop back to the lower boundary of this channel, as looks likely given the immediate outlook for the dollar, it would drop back to about $1250, and COTs suggest it could go lower still.
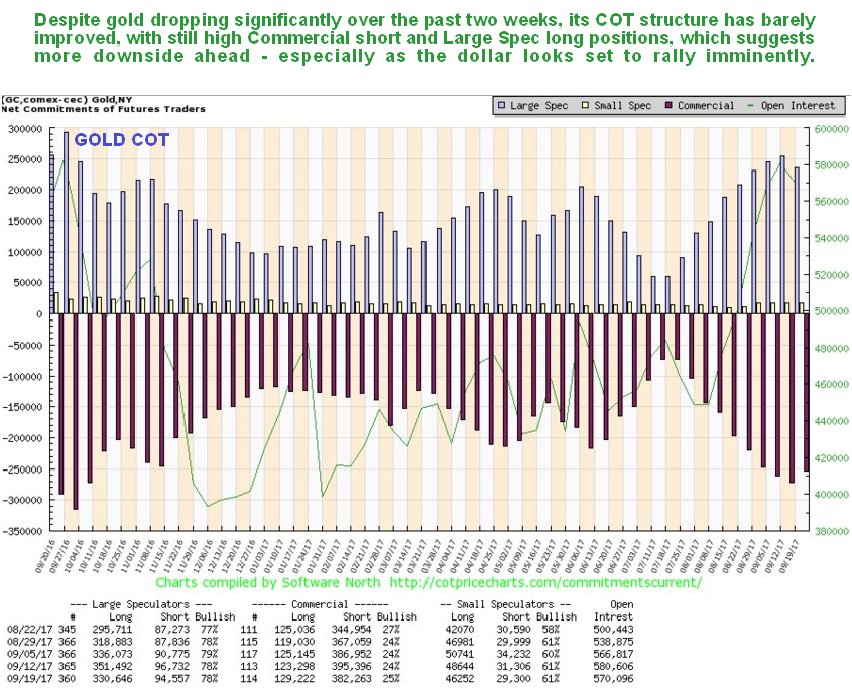
The latest COT chart shows that, as mentioned above, positions have barely eased on the reaction of the past 2 weeks – the Commercials still hold a high short position and the Large Specs a high long position. These positions will probably need to be “wrung out” before gold can resume the upward path, especially as the technical outlook for the dollar is for a significant rally over the short to medium-term.
Click on chart to popup a larger, clearer version.
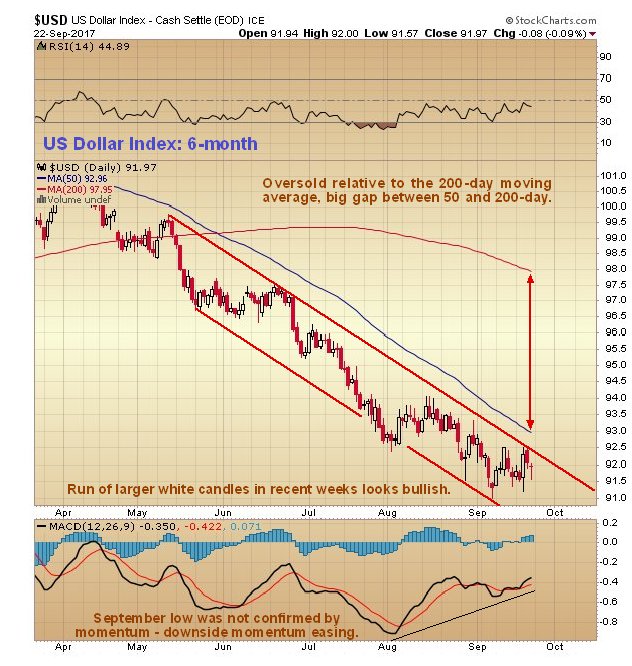
The key charts for us to consider in relation to gold are of course those for the dollar, now more than ever. On the 6-month chart for the dollar index we can see that it has become more “agitated” over the past week or so, with a number of larger white candles appearing on its chart. This is bullish, especially as the lows early this month were not at all confirmed by momentum - the MACD shows downside momentum dropping out at a time when the dollar and its 50-day moving average have opened up a large gap with the 200-day moving average, and at a time when the dollar has arrived at support at the lower boundary of its large Broadening Top formation – it’s time for a last gasp “swansong” rally before the dollar makes a graceless exit from the stage through the trapdoor – that’s when gold and silver will take off.
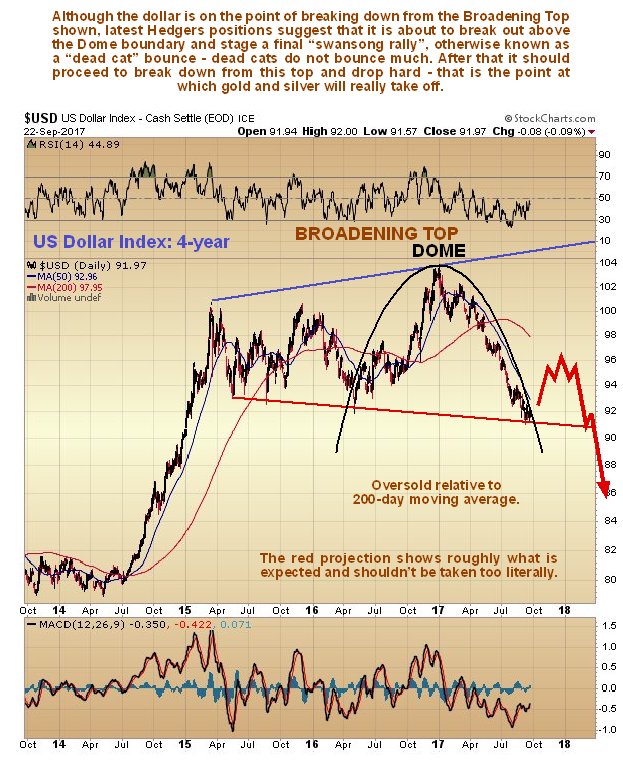
The dollar’s arrival at the lower boundary of its large Broadening Formation is shown to advantage on the 4-year dollar index chart below. This looks set to generate the proverbial “dead cat” bounce.
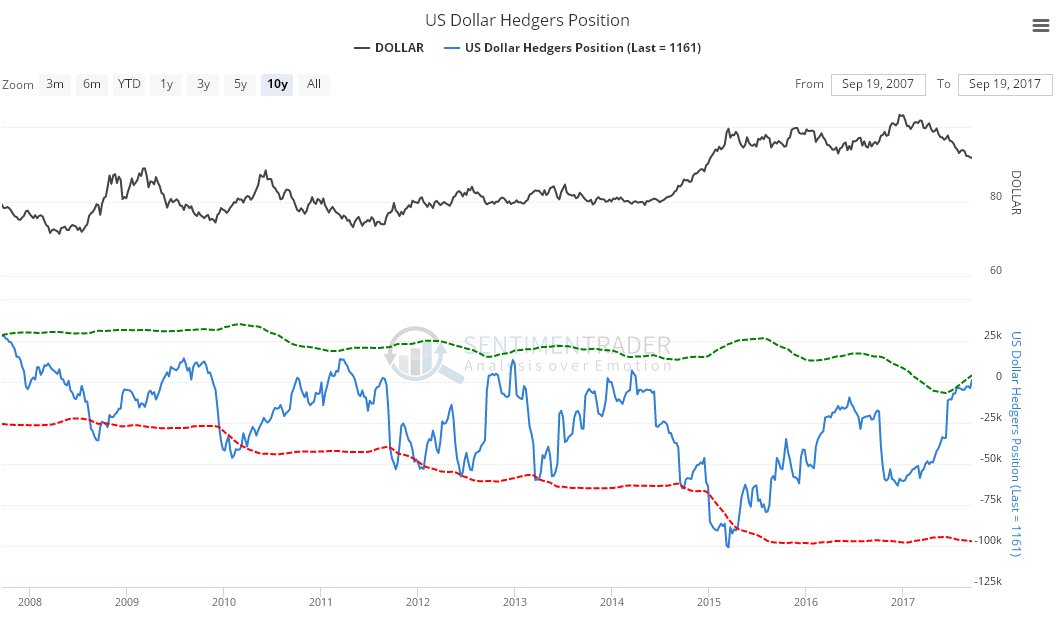
Underlining the high probability of an imminent dollar rally is the latest dollar Hedgers chart, which shows that large Commercial Hedgers, who are normally right, have progressively unloaded almost all of their short positions as the dollar has sunk lower and lower, to the point where they are now almost non-existent. Whenever this has happened in the past, as this chart makes plain, a significant dollar rally has followed. We should therefore be on the lookout for a substantial dollar rally soon – it hasn’t started yet, but looks imminent.
Click on chart to popup a larger, clearer version.
Chart courtesy of www.sentimentrader.com
Although a dollar rally is expected to start soon, it is important to note that this will be just a “dead cat” bounce - it is not expected to get very far before it turns lower again, and then heads for a breakdown from the Broadening Top pattern leading to a severe decline, as the process of global de-dollarization being spearheaded by China and Russia for obvious reasons gathers pace, so that one day the dollar will be “just another currency” and it will be interesting to observe how the United States adjusts to the new reality of having to “live within its means” instead of on the labor of the rest of the world by swapping piles of intrinsically worthless paper (dollars and Treasuries) for goods and services that are the product of REAL WORK.
End of update.
Posted at 7.20 pm EDT on 24th September 17.