A number of you are understandably concerned that the time may have arrived to take at least partial profits in our inverse ETFs after the market cratered last week to become deeply oversold. The purpose of this update is to address this concern.
We bought the twice leveraged ETFs back in the middle of November.
A point I want to make at the outset is that even if you work in this business all your life, you only get to witness 3 or 4 such major crashes during your career, so only have a certain amount of personal experience to go on, and have to build up an understanding of such events by studying crashes in other markets (like Bitcoin) or sector specific crashes. The last one we witnessed was back in 2008 of course, and one thing we do know is that since all the problems that surfaced at that time were not fixed, but simply papered over with QE, the crash now starting is likely to be a lot worse, especially as the Fed, partly to spite Trump, is throwing gasoline on the conflagration by hiking rates and withdrawing liquidity.
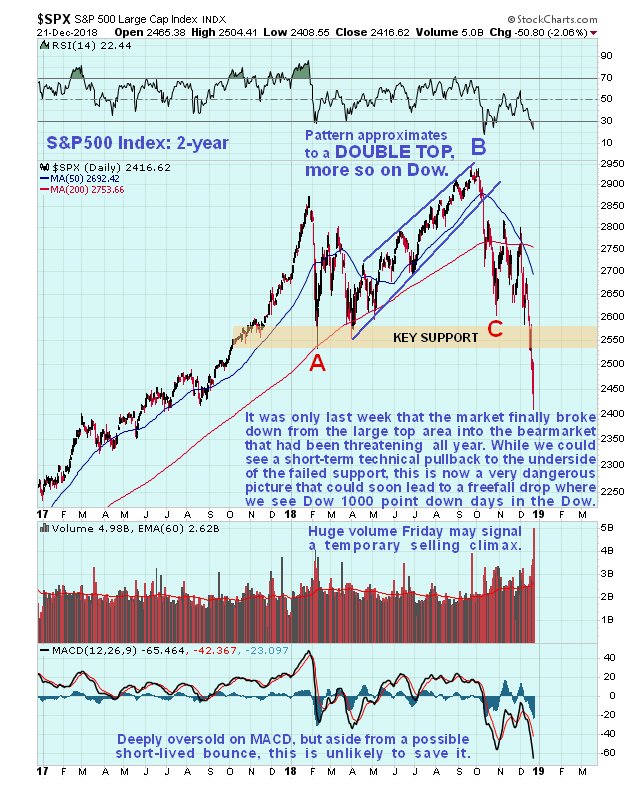
Last week the starting gun was fired for the crash to begin, with the Fed doing the honors of firing the starting pistol by raising rates again. This caused the market to break down from its large top area, that has been forming all this year, which we had earlier predicted would lead to its entering crash mode. We can see all this to advantage on the latest 2-year chart for the S&P500 index shown below…
With respect to whether or not we should take profits in our bear ETFs, or partial profits, there are 2 key points to make. One is that, as the market has just this past week broken down from its big top area, this major bearmarket has only just begun, and over time it has much, much further to drop. The other is that the decline of the past 2 weeks was so steep that it has resulted in the market becoming extremely oversold on a short-term basis – as we can see on the 10-year chart for the S&P500 index, it is more oversold on its MACD than at any time since the most severe declines of the 2008 bearmarket. Putting these 2 points together, a possible scenario is this – we see a brief snapback rally over the short-term that serves to unwind the heavily oversold condition, which is considered more likely because of the unusual trading conditions over Christmas, when the PPT could enter the fray while most traders are more preoccupied with overconsumption of alcohol and foodstuffs, then the decline resumes in earnest with another plunge, probably in January.
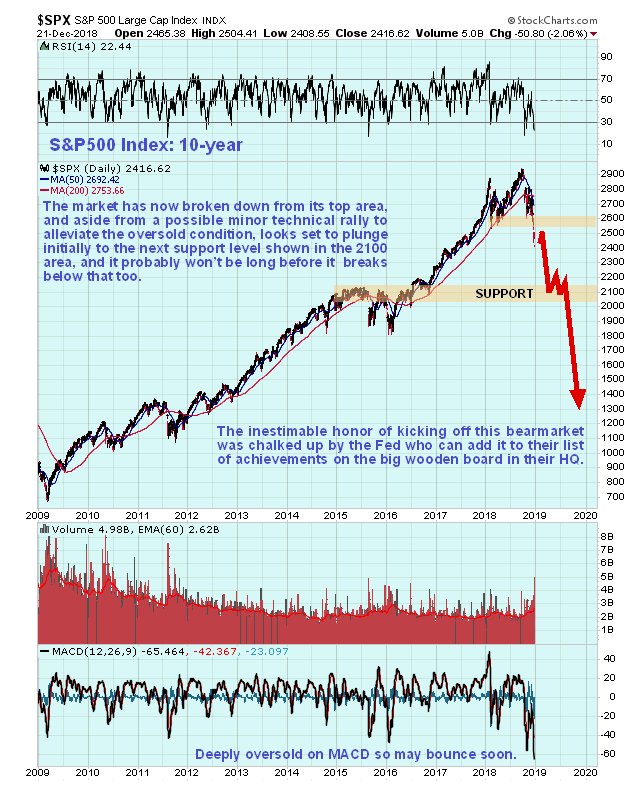
If this scenario eventuates, and it is just a possibility that is considered likely, then the S&P500 index would rally short-term no further than the underside of the failed support at the lower boundary of the top area, which is actually typical post breakdown behavior, a move which would take it from the current 2416 to perhaps around 2550. This is a move which could erase a good part of our hard won profits in our inverse ETFs, which is a reason to take profits immediately here, but we have to be careful, because it is hard to say whether it will rally this much or even at all, and it would be an awful shame to miss “The Big One” by selling out too soon, for after a possible relief rally to the underside of the failed support at the underside of the top area, the market is likely to turn lower and drop hard again, and the 1st downside target shown on the 10-year chart is at about 2100, and since panics have little respect for support levels, that might not prop it up for long.
Probably the most effective tactic here therefore is to take profits in half of any position in these inverse ETFs and let the rest run. That way we should come out ahead whatever happens. If the market continues to drop we have some powder dry to be used to something else, if it rallies back up to the failed support, then we reinstate the positions at a better price, having dodged a reduction in our profits. We are certainly looking a lot better than many hapless souls who listened to the Wall St propaganda machine and have ended up being fleeced.
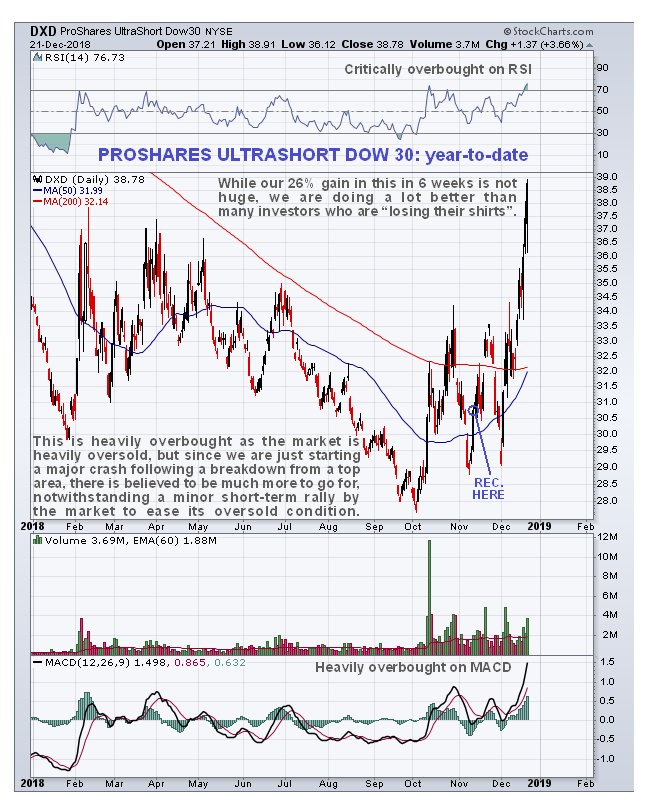
We will now look at the charts for twice leveraged DXD as an example of how these inverse ETFs have performed in the recent past. Most of them looks similar, with the more leveraged ones like the triple leveraged ones having the same patterns on the charts but a different scaling and increased leveraged.
The year-to-date chart for DXD shows that we are are up about 26% since we bought it in November, which is not bad in the space of 6 weeks, especially considering what has happened to most investors.
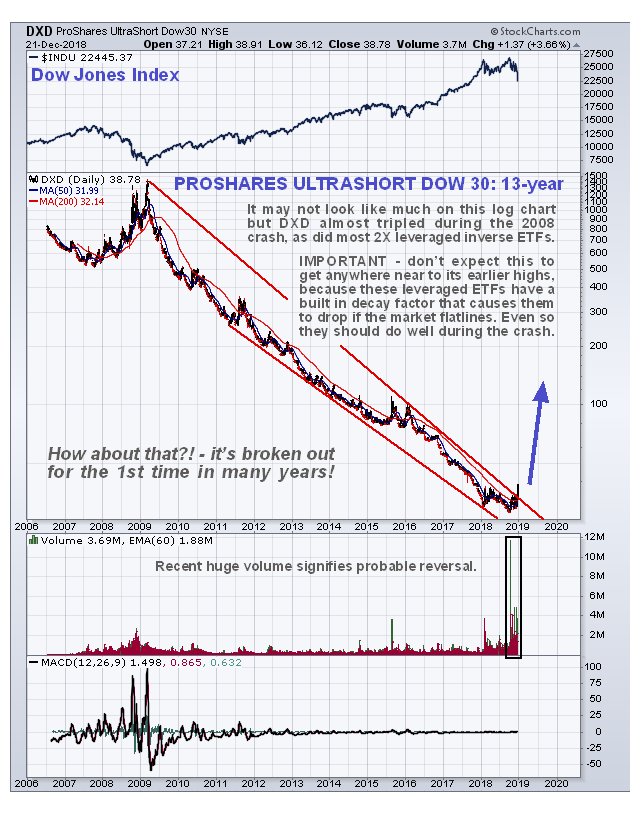
The 10-year chart for DXD is interesting as it reveals the ruinous decline it has suffered as a result of the relentless QE fuelled bullmarket, but it also reveals that it has just broken out of this long downtrend on heavy volume as the QT fuelled bearmarket gains traction. It may not look like it but if you look carefully you can see that it almost tripled during the 2008 market crash, and it is expected to perform as well, or better, during the crash now starting.
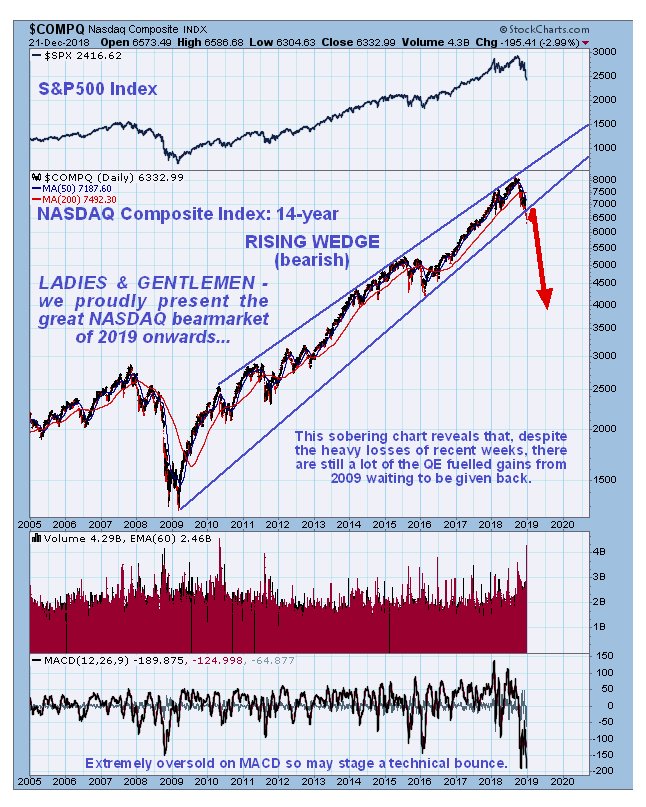
Meanwhile, if you think that the FAANGS and Tech sector have dropped a lot in recent weeks, you are right they have, but our 14-year chart for the NASDAQ Composite index shows that it has only just broken down from a long multi-year uptrend and has much further to fall yet.
 Late addition the next morning (24th) before the open.
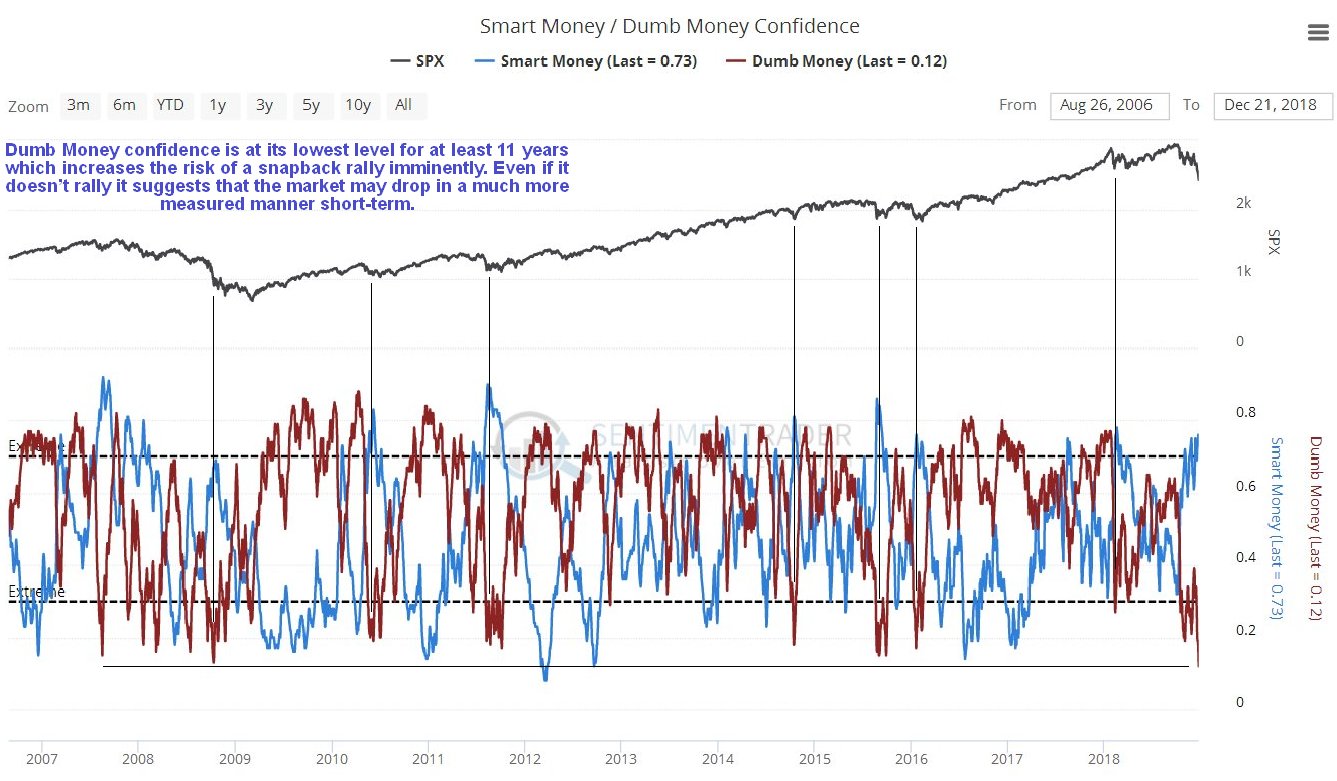
 The market looks set to open down by a relatively modest amount this morning, which will enable anyone wanting to take profits or partial profits on our inverse ETFs to do so at better prices soon after the open. With respect to the chances of a snapback rally occurring soon, I want to draw your attention to the latest chart for the Smart / Dumb money bullish percentages. As we can see on it, Dumb Money confidence is at an 11-year record low at 12%, while Smart Money (what is considered Smart Money by sentimentrader) confidence is at 73%. This is considered to be a strong sign that a snapback rally is likely to occur soon, and a catalyst for it might be a sudden resolution of the government shutdown. Note that so-called Smart Money is not always so smart – after all, they have been much more bullish than Dumb Money for weeks and we can see just how far that has got them – nevertheless this indicator is thought to have more value at the kind of extreme readings we are now seeing. This indicators makes a stronger case for taking at least partial profits on our inverse ETFs here, which we will aim to buy back on a bounce, if there is one.
Click on chart to popup a larger, clearer version.
Chart courtesy of sentimentrader.com
Next we will turn our attention to the Precious Metals sector, where we are well aware that a massive bullmarket is pending, but we are trying to be careful not to "jump the gun" in case it gets dragged down temporarily by the crash.
End of update.
Posted at 3.05 pm EST on 23rd December 18.